5151 Highway A1a Hwy #211 · Indian River Shores, FL
Flood risk 9/10 · Severe
- FEMA flood zone
- X (shaded)
- Chance of flooding over 30 yrs
- 0.99%
- Est. flood insurance / yr
- $507 – $1,088
Fire risk 1/10 · Minimal
- Est. fire insurance / yr
- $947 – $1,759
Heat risk 10/10 · Severe
- Hot days now (above 105°F)
- 8 days/yr
- Hot days in 30 yrs
- 26 days/yr
Wind risk 10/10 · Severe
- Chance of severe wind over 30 yrs
- 99.0%
Air-quality risk 1/10 · Minimal
- Unhealthy air days now
- 0 days/yr
- Unhealthy air days in 30 yrs
- 0 days/yr
Risk factors via First Street. Map © Google.
Why this score? — see what drove the D+ grade
The composite is a weighted blend of 9 inputs, each scored 0–100. Each bar is that input's sub-score; the figure is the points it added to the 100-point composite (weight × sub-score).
- Cash flow +13.4/30.0
- ARV discount +11.4/15.0
- 1% rule +5.6/10.0
- Rent growth +5.0/5.0
- Schools +4.2/10.0
- DSCR +4.1/10.0
- Livability +3.4/5.0
- Condition / age +2.5/5.0
- Appreciation +0.0/10.0
$469,000
🖨 Deal sheet (PDF) 📄 Offer letter ✓ Due diligence
Listing remarks MLS
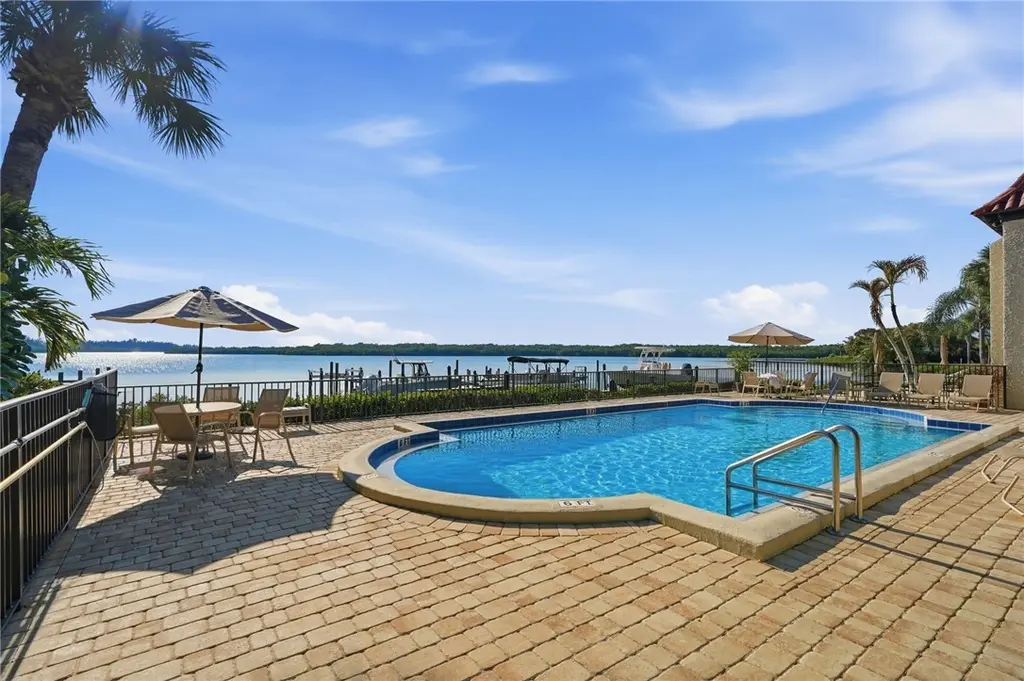
Rarely available largest condo (1895 sq ft) in Vera Cruz! 1st floor location! Includes assignment of boat slip #11! 2/2 plus den. Tile (diagonal) & wood floors thru-out! Remodeled kitchen w/ white cabinets & appliances, granite counters! Beautifully upgraded baths! Crown molding, walk-in closets, enclosed porch, bonus office space! Riverfront community clubhouse, pool, docks & kayak rack!
Key facts
- Remodeled kitchen
- Private beach access
- Upgraded bathrooms
Tags
Property features AI
Finance
- Financial info: Pets not allowed
- HOA & community: Association: AR CHOICE; Association fee $1,039 per month; Fees cover common areas, insurance, structure maintenance, recreation facilities, reserve fund, sewer, trash and water; Community amenities include clubhouse, fitness center, billiard room, sidewalks, water access and pool; Senior community
Exterior
- Parking: Assigned uncovered parking
- Security: Smoke detectors
- Utilities: Public water; County sewer
- Home design: 2-story building; North-facing; Has attached property; Residential property; Stucco construction; Has a view
- Construction: Stucco exterior; 2 stories
- Exterior features: Porch; Enclosed porch / screened porch; Beach access; Community pool
Interior
- Kitchen: Range; Microwave; Dishwasher; Garbage disposal; Refrigerator; Electric water heater
- Bedrooms: Bedroom — 14 x 13; Bedroom — 18 x 12
- Flooring: Tile; Wood
- Bathrooms: 2 full bathrooms
- Heating & cooling: Central heating (electric); Central air conditioning (electric)
- Interior features: Wet bar; Crown molding; Walk-in closets; Blinds and window treatments; Casement windows; Sliding doors; Unfurnished
- Laundry & utility: In-unit washer and dryer
Neighborhood map
What this means for you Summary
Snapshot
- This is a 2-bed/2.0-bath townhouse listed at $469k.
Deal economics
- At list price, monthly cash flow is $-54 ($-645/yr) — negative.
- To cash-flow at today's rent, offer at most $459k (2.0% below list).
- Meets the 1% rule at list price ($5k rent vs $469k).
- Recommended offer: $427k (9.0% below list) — sets the bar for market timing.
- Cap rate 6.3% vs local median 1.5% in Indian River Shores — top-decile yield for the area; either an underpriced asset or a hidden risk that comps aren't pricing in. Stress-test before assuming the spread holds.
Location & tenants
- Location reads 68/100 on livability (#517 in FL) — a middle-class / working-renter tenant base. Strengths: crime A+, employment A+, housing A-; Watch: amenities F, commute F, cost of living F.
- Indian River (other): math 48% / reading 52% proficiency, ranked #35 of 73 in FL (top 48%) — acceptable for families but not a draw, mixed tenant base, ~2y average lease.
- Zoned schools: Beachland Elementary School (math 54% / reading 58%, grade C+, #832 of 2,144 statewide, top 40%, 523 students, 39% FRL); Gifford Middle School (math 46% / reading 45%, grade D+, #305 of 571 statewide, top 54%, 582 students, 72% FRL); Vero Beach High School (math 28% / reading 43%, grade F, #367 of 667 statewide, top 57%, 2,847 students, 50% FRL) — zoned schools at 54% FRL track the district average.
- Market conditions: Rents rising fast (+11.0%/yr); 501 active listings in the ZIP; 40 comparable units currently listed for rent nearby; rentals at typical pace (median 23d on market — plan ~3-4 weeks tenant-placement turnaround); high-income renter base; 564 units permitted in Indian River County in 2024 (281 in 5+ unit buildings).
- This rent runs 40% of the median local income ($150k/yr) — at the standard rent-burdened threshold; future hikes will face affordability resistance.
Forward outlook
- Local home prices are declining (-3.0%/yr); year-one equity from $3k of loan paydown is wiped out by about $14k of value loss. Plan a longer hold.
- Indian River County population projected at +18% by 2050 — long-run rental-demand tailwind backs the buy-and-hold thesis.
Negotiation context
- It's been on market 94 days — a 9% lower offer ($427k) is reasonable based on typical stale-listing flexibility.
- 2 sale attempts since 7y ago with the ask held roughly flat each time — persistent listings suggest the price (not the market) is what's stuck; bring a comps-based counter.
- Current owner paid $340k; 38% above their basis — modest negotiation headroom, anchor on the comps not their cost.
Risks & watch-outs
- Watch-outs: flood insurance adds $66/mo; HOA is 21% of rent.
- Climate carrying-cost: severe flood risk; severe wind risk, 99% chance of damaging wind over 30y; extreme-heat days projected 8→26/yr by 2055 (HVAC capex compounding) — expect insurance premiums to compound above CPI over the hold.
Questions for the listing agent
- What do current leases actually rent for vs. the listed asking? Can we see a recent rent roll and the last 12 months of T-12 income?
- It's been on market 94 days. Have you received any prior offers? Is the seller open to a 9% concession, seller financing, or rate buy-down credit?
- Built in 1974 — when were the roof, HVAC, electrical panel, plumbing, and water heater last replaced?
- What's the actual annual flood-insurance premium (NFIP or private), and is the property in a SFHA with mandatory coverage?
- What does the HOA fee cover, when was the last increase, and are there any pending special assessments or reserve-fund shortfalls?
- Why hasn't it sold? Are there any deal-killer items the seller is aware of (foundation, flood, title, zoning, code violations)?
- Is there a deadline driving the sale (1031 exchange, divorce, estate, relocation)? That informs how much negotiation room exists.
- The area grade is low — what's the realistic commute time and amenity access for the typical tenant pool here? Any planned neighborhood developments (good or bad) we should know about?
- What's the average days-on-market for RENTAL listings here right now (not sales)? A rising rental-DOM trend means longer vacancies and softer asking-rent achievability than the comps imply.
- What's the recent tenant-quality profile in this submarket — average credit score on applications, eviction rate, late-payment / NSF rate, and stable-employment percentage? A property-management company in the area should have these aggregated.
- How much new for-sale + rental construction is in the pipeline within 1–3 miles? Heavy new supply typically softens prices + rents 12–24 months out; constrained supply supports both.
Investment metrics
- 1% rule
- 1.06% ✓
- Cap rate
- 6.33%
- Cash-on-cash
- 0.12%
- DSCR
- 1.01
- GRM
- 7.9
CMA / ARV
- ARV (on-the-fly)
- $513,702
- Comps found
- 12
Show comp detail 12 sales within ~0.75 mi
| Address | Dist | Beds/Ba | Sqft | Sold | Price | $/sf | Match |
|---|---|---|---|---|---|---|---|
| 5101 Highway A1a #108 | 0.10mi | 2/2.0 | 1,643 (-3%) | 2mo | $476,000 | $290 | 88 |
| 5101 Highway A1a Hwy #208 | 0.10mi | 2/2.0 | 1,643 (-3%) | 4mo | $410,000 | $250 | 86 |
| 5601 Highway A1a Unit 303N | 0.43mi | 2/2.0 | 1,637 (-4%) | 2mo | $155,000 | $95 | 72 |
| 5601 A1a Hwy Unit 305S | 0.47mi | 2/2.0 | 1,637 (-4%) | 3mo | $150,000 | $92 | 69 |
| 294 S Peppertree Dr | 0.25mi | 2/2.0 | 1,911 (+12%) | 6mo | $495,000 | $259 | 63 |
| 4901 Bethel Creek Dr Unit I | 0.66mi | 2/2.5 | 1,676 (-2%) | 4mo | $600,000 | $358 | 61 |
| 4901 Bethel Creek Dr Unit F | 0.66mi | 2/2.5 | 1,676 (-2%) | 4mo | $525,000 | $313 | 61 |
| 125 E Park Shores Cir Unit 21E | 0.68mi | 2/2.0 | 1,640 (-4%) | 3mo | $550,000 | $335 | 60 |
| 5000 A1a Hwy #324 | 0.66mi | 2/2.0 | 1,860 (+9%) | 2mo | $685,000 | $368 | 52 |
| 5000 Highway A1a #534 | 0.66mi | 2/2.0 | 1,860 (+9%) | 5mo | $550,000 | $296 | 49 |
| 4904 Bethel Creek Dr #1 | 0.66mi | 2/2.5 | 1,520 (-11%) | 3mo | $475,000 | $313 | 47 |
| 212 Park Shores Cir Unit 212B | 0.61mi | 2/2.0 | 1,456 (-14%) | 6mo | $440,000 | $302 | 42 |
Match score weights: distance 35% · size 25% · config 20% · recency 20%. Top-matched comps best support the ARV.
Projected returns pro-forma
-3.0% appreciation · 8.0% rent growth · sell at horizon
- IRR
- -10.4%
- Equity multiple
- 0.60×
- Total profit
- $-52,601
- Equity at exit
- $69,929
- IRR
- 5.8%
- Equity multiple
- 1.55×
- Total profit
- $71,608
- Equity at exit
- $40,551
Cash invested: $131,320 (down + closing). Projections, not guarantees.
Landlord ↔ Tenant lean methodology
- Overall (STATE)
- 87 Strongly Landlord-Friendly
- State Florida
- 87 Strongly Landlord-Friendly · R+3
- County
- — inherits STATE
- City
- — inherits STATE
ZIP-level market 32963
- Rents YoY
- 11.0%
- Active inventory
- 501
- Price-to-rent
- 7.9×
Monthly cashflow live
- Estimated rent
- $4,975 high interval (Pro) →
- Mortgage (P&I)
- −$2,459
- Tax from tax record
- −$224 /mo · $2,684/yr
- Insurance
- −$195
- Flood insurance flood zone
- −$66 /mo · $798/yr
- HOA
- −$1,039
- Vacancy / Maint / Mgmt
- −$1,045
- Net cashflow
- $-54
Break-even live
Sensitivity live
| Price | -10% $212 | -5% $79 | +0% $-54 | +5% $-187 | +10% $-319 |
|---|---|---|---|---|---|
| Rent | -10% $-447 | -5% $-250 | +0% $-54 | +5% $143 | +10% $339 |
| Rate | -1.0pp $182 | -0.5pp $66 | base $-54 | +0.5pp $-175 | +1.0pp $-299 |
UW: 25.0% down · 7.5% · 30yr · 1.5% tax · 5.0% vac · 8.0% maint · 8.0% mgmt
Financing live
Cash to close
- Down payment
- $117,250
- Closing costs
- $14,070
- Reserves months
- —
- Total cash needed
- —
Loan-product check · same deal, 3 products live
Conventional
25% down · 7.5% · 30yr
- Down + closing
- —
- Monthly P&I
- —
- Monthly cashflow
- —
- DSCR
- —
- Eligible?
- —
Personal DTI + credit; lowest rate.
DSCR
20% down · 8.5% · 30yr
- Down + closing
- —
- Monthly P&I
- —
- Monthly cashflow
- —
- DSCR
- —
- Eligible?
- —
No personal income docs; deal must DSCR.
Hard money
10% down · 12.0% · 12mo
- Down + closing
- —
- Monthly P&I
- —
- Monthly cashflow
- —
- DSCR
- —
- Eligible?
- —
Short-term bridge; refi at stabilization.
Rent comps 40 comps
| Address | Beds | Baths | Sqft | Rent | $/sqft | DOM | Units | Dist |
|---|---|---|---|---|---|---|---|---|
| 5151 Jimmy Buffett Memorial Hwy Unit 512 Indian River Shores, FL | 2.0 | 2.0 | 1339 | $4,600 | $3.44 | 23d | 1 | 0.04mi |
| 5151 Jimmy Buffett Memorial Hwy Unit 305 Indian River Shores, FL | 2.0 | 2.0 | 1339 | $2,300 | $1.72 | 23d | 1 | 0.04mi |
| 5101 Highway A1A #109 Vero Beach, FL | 3.0 | 2.0 | 1848 | $5,500 | $2.98 | 23d | 1 | 0.12mi |
| 5300 Jimmy Buffett Memorial Hwy #301 Indian River Shores, FL | 2.0 | 2.0 | 1300 | $7,000 | $5.38 | 23d | 1 | 0.22mi |
| 5300 Jimmy Buffett Memorial Hwy Unit 305 Indian River Shores, FL | 2.0 | 2.0 | 1300 | $6,000 | $4.62 | 23d | 1 | 0.22mi |
| 5300 Jimmy Buffett Memorial Hwy Unit 408 Indian River Shores, FL | 2.0 | 2.0 | 1300 | $9,000 | $6.92 | 23d | 1 | 0.22mi |
| 5300 Jimmy Buffett Memorial Hwy Unit 214 Indian River Shores, FL | 2.0 | 2.0 | 1300 | $5,500 | $4.23 | 23d | 1 | 0.22mi |
| 5300 Jimmy Buffett Memorial Hwy Unit 314 Indian River Shores, FL | 2.0 | 2.0 | 1300 | $3,000 | $2.31 | 23d | 1 | 0.22mi |
| 5400 Jimmy Buffett Memorial Hwy Indian River Shores, FL | 2.0 | 2.0 | 1200 | $1,800 | $1.50 | 23d | 1 | 0.26mi |
| 131 Peppertree Dr #21 Vero Beach, FL | 2.0 | 2.0 | 1787 | $3,300 | $1.85 | 15d | 1 | 0.27mi |
| 5100 Jimmy Buffett Memorial Hwy Unit 58G INDN RIV SHRS, FL | 2.0 | 2.0 | 1170 | $6,000 | $5.13 | 23d | 1 | 0.34mi |
| 4617 Pebble Bay S Vero Beach, FL | 3.0 | 2.5 | 2240 | $8,500 | $3.79 | 23d | 1 | 0.36mi |
| 5536 Jimmy Buffett Memorial Hwy Unit 211 Vero Beach, FL | 2.0 | 2.5 | 1632 | $6,000 | $3.68 | 23d | 1 | 0.40mi |
| 5554 Jimmy Buffett Memorial Hwy Unit 201 Indian River Shores, FL | 2.0 | 2.0 | 1632 | $12,000 | $7.35 | 23d | 1 | 0.44mi |
| 5554 Jimmy Buffett Memorial Hwy Unit 202 Indian River Shores, FL | 2.0 | 2.5 | 1632 | $12,000 | $7.35 | 23d | 1 | 0.44mi |
| 5601 Jimmy Buffett Memorial Hwy Unit 304N Indian River Shores, FL | 2.0 | 2.0 | 2115 | $1,999 | $0.95 | 23d | 1 | 0.47mi |
| 902 Tides Rd Vero Beach, FL | 3.0 | 3.0 | 1810 | $8,500 | $4.70 | 15d | 1 | 0.48mi |
| 219 Park Shores Cir Unit 219B Vero Beach, FL | 2.0 | 2.5 | 1583 | $3,000 | $1.90 | 15d | 1 | 0.54mi |
| 907 Tropic Dr Vero Beach, FL | 3.0 | 2.0 | 1830 | $10,000 | $5.46 | 23d | 1 | 0.58mi |
| 705 Bahia Mar Rd Vero Beach, FL | 3.0 | 2.0 | 2214 | $16,000 | $7.23 | 15d | 1 | 0.60mi |
| 5680 Highway A1A #111 Vero Beach, FL | 3.0 | 3.0 | 2050 | $6,000 | $2.93 | 23d | 1 | 0.63mi |
| 5670 Jimmy Buffett Memorial Hwy Unit 315S Vero Beach, FL | 2.0 | 3.5 | 2050 | $7,000 | $3.41 | 23d | 1 | 0.63mi |
| 5690 Jimmy Buffett Memorial Hwy Unit 102N Vero Beach, FL | 1.0 | 3.5 | 1900 | $4,500 | $2.37 | 23d | 1 | 0.63mi |
| 926 Tropic Dr Vero Beach, FL | 1.0 | 1.0 | 2000 | $2,000 | $1.00 | 15d | 1 | 0.63mi |
| 5000 Highway A1A #320 Vero Beach, FL | 2.0 | 2.0 | 1980 | $5,000 | $2.53 | 23d | 1 | 0.69mi |
| 4890 Bethel Creek Dr #5 Vero Beach, FL | 2.0 | 2.5 | 1244 | $2,200 | $1.77 | 23d | 1 | 0.71mi |
| 4836 Bethel Creek Dr Unit 4836 Vero Beach, FL | 2.0 | 2.5 | 1650 | $3,000 | $1.82 | 15d | 1 | 0.73mi |
| 4834 Bethel Creek Dr Vero Beach, FL | 2.0 | 2.5 | 1500 | $2,900 | $1.93 | 23d | 1 | 0.73mi |
| 4800 Bethel Creek Dr Unit 5S Vero Beach, FL | 2.0 | 2.5 | 2215 | $5,500 | $2.48 | 15d | 1 | 0.78mi |
| 4800 Highway A1A #207 Vero Beach, FL | 2.0 | 2.0 | 1850 | $7,000 | $3.78 | 23d | 1 | 0.78mi |
| 4800 Highway A1A #506 Vero Beach, FL | 2.0 | 2.0 | 1850 | $4,500 | $2.43 | 23d | 1 | 0.78mi |
| 4800 Highway A1A #116 Vero Beach, FL | 2.0 | 2.0 | 1822 | $3,000 | $1.65 | 23d | 1 | 0.78mi |
| 101 E Park Shores Cir Unit 2 Indian River Shores, FL | 2.0 | 2.0 | 1640 | $2,600 | $1.59 | 15d | 1 | 0.80mi |
| 133 E Park Shores Cir Unit 7E Vero Beach, FL | 2.0 | 2.0 | 1640 | $3,000 | $1.83 | 15d | 1 | 0.81mi |
| 133 E Park Shores Cir Unit 4E Vero Beach, FL | 2.0 | 2.0 | 1540 | $3,500 | $2.27 | 15d | 1 | 0.81mi |
| 4601 Highway A1A #202 Vero Beach, FL | 2.0 | 2.0 | 1440 | $3,250 | $2.26 | 23d | 1 | 0.91mi |
| 4601 Highway A1A #103 Vero Beach, FL | 2.0 | 2.0 | 1600 | $2,500 | $1.56 | 23d | 1 | 0.91mi |
| 100 River Oak Ln Vero Beach, FL | 3.0 | 3.0 | 2245 | $13,000 | $5.79 | 23d | 1 | 0.91mi |
| 4600 Highway A1A #409 Vero Beach, FL | 2.0 | 2.0 | 1725 | $7,500 | $4.35 | 23d | 1 | 0.95mi |
| 4600 Highway A1A #507 Vero Beach, FL | 2.0 | 2.0 | 1400 | $5,000 | $3.57 | 23d | 1 | 0.95mi |
HOA detail
- Monthly dues
- $1,039 · $12,468/yr
- Likely covers
- pool
Listing history 26 events
-
2026-06-22days on market $469,000 Active 94 DOM
-
2026-06-19days on market $469,000 Active 92 DOM
-
2026-06-18days on market $469,000 Active 91 DOM
-
2026-06-17days on market $469,000 Active 90 DOM
-
2026-06-16days on market $469,000 Active 89 DOM
-
2026-06-15days on market $469,000 Active 88 DOM
-
2026-06-14days on market $469,000 Active 86 DOM
-
2026-06-13days on market $469,000 Active 85 DOM
-
2026-06-10days on market $469,000 Active 83 DOM
-
2026-06-09days on market $469,000 Active 82 DOM
-
2026-06-08days on market $469,000 Active 81 DOM
-
2026-06-07days on market $469,000 Active 80 DOM
-
2026-06-05days on market $469,000 Active 77 DOM
-
2026-06-02days on market $469,000 Active 75 DOM
-
2026-06-01days on market $469,000 Active 74 DOM
-
2026-05-31days on market $469,000 Active 73 DOM
-
2026-05-30days on market $469,000 Active 72 DOM
-
2026-03-17$469,000 Active
-
2019-10-04soldstatus $340,000
-
2019-10-02soldstatus $340,000 Sold 409-char remark
Show marketing remark (409 chars)
Rarely available largest condo (1895 sq ft) in Vera Cruz! 1st floor location! Includes assignment of boat slip #11! 2/2 plus den. Tile (diagonal) & wood floors thru-out! Remodeled kitchen w/ white cabinets & appliances, granite counters! Beautifully upgraded baths! Crown molding, walk-in closets, enclosed porch, bonus office space! Riverfront community clubhouse, pool, docks & kayak rack!
-
2019-08-01historical Contingent 409-char remark
Show marketing remark (409 chars)
Rarely available largest condo (1895 sq ft) in Vera Cruz! 1st floor location! Includes assignment of boat slip #11! 2/2 plus den. Tile (diagonal) & wood floors thru-out! Remodeled kitchen w/ white cabinets & appliances, granite counters! Beautifully upgraded baths! Crown molding, walk-in closets, enclosed porch, bonus office space! Riverfront community clubhouse, pool, docks & kayak rack!
-
2019-07-19$344,900 Active 409-char remark
Show marketing remark (409 chars)
Rarely available largest condo (1895 sq ft) in Vera Cruz! 1st floor location! Includes assignment of boat slip #11! 2/2 plus den. Tile (diagonal) & wood floors thru-out! Remodeled kitchen w/ white cabinets & appliances, granite counters! Beautifully upgraded baths! Crown molding, walk-in closets, enclosed porch, bonus office space! Riverfront community clubhouse, pool, docks & kayak rack!
-
2009-04-20soldstatus $210,000
-
2004-03-09soldstatus $207,500
-
1993-10-08soldstatus $108,000
-
1991-10-01soldstatus $103,000
ⓘ Source: listings_history table (triggers on properties + properties_extension) + one-shot
backfill from property_details.listing_events for pre-trigger history.
Tax reassessment forecast FL · Resets to sale price
- Current annual tax
- $2,684 · $224/mo
- Projected year-2 tax
- $3,893 · $324/mo
- Expected delta
- +$1,209/yr (+$101/mo · 45.1%)
ⓘ Screening estimate from a state-policy table — verify with the county assessor before closing.
Climate risk First Street
- Flood 9/10 Extreme FEMA zone X (shaded) · 99% chance over 30 yrs
- Wildfire 1/10 Low
- Heat 10/10 Extreme 8 d/yr ≥105°F today · 26 d/yr by 30 yrs out
- Wind 10/10 Extreme 99% chance of damaging wind over 30 yrs
- Air quality 1/10 Low 0 unhealthy d/yr today · 0 by 30 yrs out
Nearby sold comps map
Loading sold comps map…
Walkable amenities ~0.75 mi
Loading nearby amenities…
Taxation est. · year 1
- Rental income
- $59,699
- − Mortgage interest
- −$26,271
- − Property taxes
- −$2,684
- − Insurance
- −$3,142
- − Repairs & maintenance
- −$4,776
- − Management
- −$4,776
- − HOA
- −$12,468
- − Depreciation
- −$13,644
- Taxable loss
- −$8,062
- Est. tax savings @ 24.0%
- +$1,935
- After-tax cash flow
- $1,289/yr
For passive investors: Depreciation is non-cash, so a rental often shows a tax loss while cash-flowing — sheltering income. Rental losses are passive: they offset passive income freely, and up to $25,000/yr can offset ordinary (W-2) income if you actively participate and your MAGI is under $100k (phasing out to $0 by $150k); unused losses carry forward. On sale, claimed depreciation is recaptured at up to 25%, and gains may owe capital-gains tax (a 1031 exchange can defer both). Figures are a year-1 estimate at your 24.0% rate — not tax advice; consult a CPA.
Schools (NCES district)
- District
- Indian River
- NCES district ID
- 1200930
- Math proficiency
- 48% ▼ -9.00%
- Reading proficiency
- 52% ▼ -3.00%
- Median HH income
- $46,597
- Composite
- 42.45/100
- National rank
- #3218
- State rank
- #35 of 73 in FL
Livability — Indian River Shores
- Score
- 68/100
- State rank
- #517
- US rank
- #9512
Category grades
Schools grade is shown separately in the Schools card above.
Census & demographics
- Census place
- Indian River Shores, FL
- County
- Indian River County · 143,738 people
- City population
- 15,008
- Metro
- Sebastian-Vero Beach, FL
- Population (ZIP)
- 15,008
- Household income
- $149,923
- Rent vs Own
- Severe rent burden
- 119.0
Population outlook (Indian River County) Hauer SSP2
- Today (2025)
- 165,104 people
- By 2030
- 172,869 · +4.7%
- By 2040
- 185,640 · +12.4%
- By 2050
- 194,465 · +17.8%
- By 2075
- 211,115 · +27.9%
- By 2100
- 211,781 · +28.3%
Race, ethnicity, and origin ACS 2023
- Neighborhood character
- Predominantly White (92%)
- Race & ethnicity
- White 92% Two or more races 5% Hispanic / Latino 4% Asian 2%
- Common ancestry
- Slovak 5% Lithuanian 4% Italian 3%
- Foreign-born
- 9% · Canada
- Languages at home
- 92% English-only · Spanish 3% Other Indo-European 1% German/W. Germanic 1%
Political lean MEDSL · Indian River
- 2024 margin
- Strong R (+27.4) · D 36.0% · R 63.4%
- 2008→2024 swing
- -12.5pp toward R · 2008: -14.8pp · 2024: -27.4pp
- All cycles
- 2024: R+27.4 2020: R+21.6 2016: R+24.5 2012: R+22.3 2008: R+14.8
Not yet ingested
- Civics
- —
Market trends
- HPI YoY
- ▼ -180.47%
- Current HPI
- 312.0326
- Rent YoY
- ▲ 11.04%
- Metro
- Sebastian-Vero Beach, FL
- State GDP YoY
- ▲ 3.28%
- F500 in state
- 36
Industry mix (Fortune 500 HQ in FL)
| Industry | F500 HQs | Revenue |
|---|---|---|
| Industrial Technology | 2 | $29B |
|
||
| Insurance | 2 | $17B |
|
||
| Retail | 1 | $60B |
|
||
| Technology Distribution | 1 | $58B |
|
||
| Homebuilding | 1 | $35B |
|
||
| Technology Manufacturing | 1 | $35B |
|
||
Price history
+355.3% since first listed9 events — show timeline
- 2026-03-17 Listed $469,000 RAIRCMLS
- 2019-10-04 Sold (Public Records) $340,000 Public Records
- 2019-10-02 Sold (MLS) $340,000 RAIRCMLS
- 2019-08-01 Contingent — RAIRCMLS
- 2019-07-19 Listed $344,900 RAIRCMLS
- 2009-04-20 Sold (Public Records) $210,000 Public Records
- 2004-03-09 Sold (Public Records) $207,500 Public Records
- 1993-10-08 Sold (Public Records) $108,000 Public Records
- 1991-10-01 Sold (Public Records) $103,000 Public Records
Property tax history
+4.3%/yrLatest (2025): $2,684 · +3.2% YoY. Source: county tax records.
Cash-flow waterfall
monthlySold comps — $/sqft
last 12 mo · ≤1 miLoading sold comps…