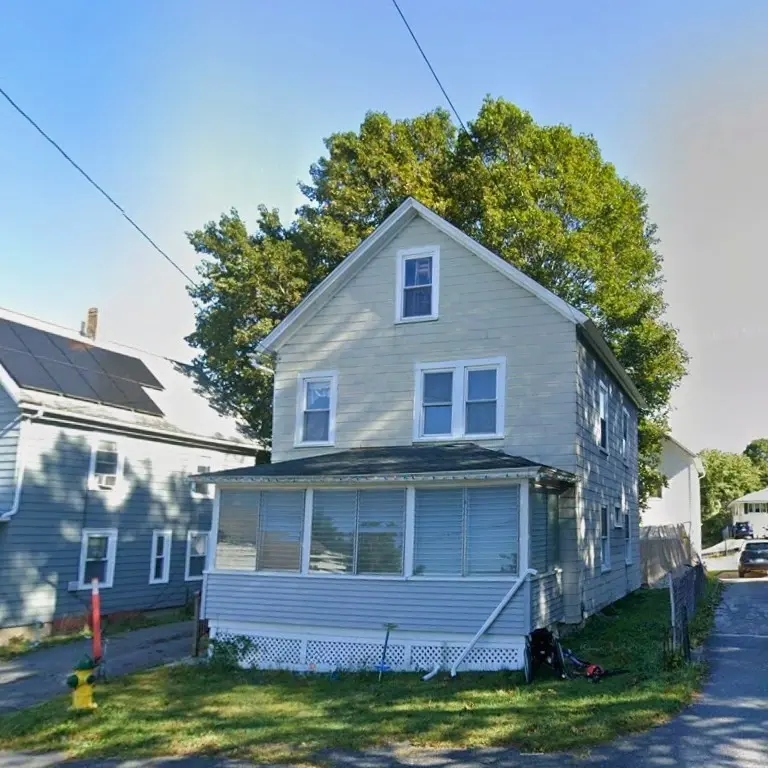
2 Kittler Ave · Adams, MA
Flood risk 1/10 · Minimal
- FEMA flood zone
- X
- Chance of flooding over 30 yrs
- 0.0%
- Est. flood insurance / yr
- $473 – $860
Fire risk 3/10 · Minor
- Est. fire insurance / yr
- $915 – $1,699
Heat risk 3/10 · Minor
- Hot days now (above 90°F)
- 7 days/yr
- Hot days in 30 yrs
- 18 days/yr
Wind risk 4/10 · Minor
- Chance of severe wind over 30 yrs
- 9.0%
Air-quality risk 2/10 · Minimal
- Unhealthy air days now
- 1 days/yr
- Unhealthy air days in 30 yrs
- 1 days/yr
Risk factors via First Street. Map © Google.
Why this score? — see what drove the C+ grade
The composite is a weighted blend of 9 inputs, each scored 0–100. Each bar is that input's sub-score; the figure is the points it added to the 100-point composite (weight × sub-score).
- Cash flow +18.3/30.0
- ARV discount +15.0/15.0
- Appreciation +8.3/10.0
- DSCR +5.7/10.0
- 1% rule +4.8/10.0
- Livability +3.6/5.0
- Rent growth +2.5/5.0
- Condition / age +2.5/5.0
- Schools +2.0/10.0
$164,999
🖨 Deal sheet (PDF) 📄 Offer letter ✓ Due diligence
Listing remarks MLS
Fixer-upper with solid potential. 3-bedroom, 1.5-bath home offering 1,144 sq ft on a 2,614 sq ft lot. Built in 1910, this property is in need of updates and repairs but offers a great opportunity to add value.Roof was replaced approximately 4 years ago. Foundation is generally solid with some areas needing attention. Home will require updates to plumbing and electrical systems, and windows may need replacement. Features include gas heat with steam radiators and original plaster walls. No central air.Ideal for investors or buyers looking to renovate and customize. Being sold as-is.Images coming soon!
Key facts
- 2,614 sq ft lot
- 2 parking spots
- Built 1910
Neighborhood map
What this means for you Summary
Snapshot
- This is a 3-bed/2.0-bath single-family listed at $165k.
Deal economics
- At list price, monthly cash flow is $150 ($2k/yr) — positive.
- The deal already cash-flows at list — no discount required.
- To meet the 1% rule (rent ≥ 1% of price), the offer needs to be $162k (2.0% below list).
- Recommended offer: $155k (6.0% below list) — sets the bar for market timing.
- Cap rate 7.4% vs local median 3.7% in Adams — top-decile yield for the area; either an underpriced asset or a hidden risk that comps aren't pricing in. Stress-test before assuming the spread holds.
Location & tenants
- Location reads 71/100 on livability (#131 in MA) — a middle-class / working-renter tenant base. Strengths: health & safety A+, housing A, cost of living A-; Watch: amenities F, commute F, employment D-.
- Adams-Cheshire (rural): math 14% / reading 31% proficiency, ranked #285 of 302 in MA (top 94%) — low school quality limits family demand, transient renter base, plan for 1-2y turnover.
- Zoned schools: Hoosac Valley Elementary School (math 27% / reading 42%, grade F, #577 of 938 statewide, top 65%, 374 students, 0% FRL); Hoosac Valley Middle School (math 8% / reading 28%, grade F, #264 of 305 statewide, top 87%, 288 students, 0% FRL); Hoosac Valley High School (math 22% / reading 37%, grade F, #270 of 343 statewide, top 80%, 324 students, 0% FRL) — zoned schools average 0% FRL vs 36% district-wide (36 pts lower); this property's tenant base skews higher-income than the district average.
- Market conditions: 62 active listings in the ZIP; 2 comparable units currently listed for rent nearby; 130 units permitted in Berkshire County in 2024 (10 in 5+ unit buildings).
Forward outlook
- In year one you build about $12k of equity ($1k loan paydown + $11k appreciation (6.7% local appreciation)).
- Berkshire County population projected at -24% by 2050 — secular population decline; favor cash flow + early exit over multi-decade hold.
- At projected returns (6.7% appreciation + 3.0% rent growth), your $46k cash investment doubles in ~4 years — after that, you're playing with house money.
- By year 3, paydown + projected appreciation supports a ~$30k cash-out refi (75% LTV) — recoverable capital for the next deal without selling this one.
Negotiation context
- It's been on market 74 days — a 6% lower offer ($155k) is reasonable based on typical stale-listing flexibility.
- 2 sale attempts since 11y ago; this cycle's ask has dropped $10k (6%) from the opening price — seller is motivated, your offer sets the floor, not the list.
- Current owner paid $90k; list at $165k implies a 83% gain — meaningful room to come down on a strong offer.
Risks & watch-outs
- Watch-outs: built in 1910 — expect roof / HVAC / electrical / plumbing capex.
Questions for the listing agent
- It's been on market 74 days. Have you received any prior offers? Is the seller open to a 6% concession, seller financing, or rate buy-down credit?
- Built in 1910 — when were the roof, HVAC, electrical panel, plumbing, and water heater last replaced?
- Why hasn't it sold? Are there any deal-killer items the seller is aware of (foundation, flood, title, zoning, code violations)?
- Is there a deadline driving the sale (1031 exchange, divorce, estate, relocation)? That informs how much negotiation room exists.
- Schools are D-rated, which usually means shorter tenancies and higher turnover. Who's the typical renter profile here, and what's been the actual vacancy rate?
- What's the average days-on-market for RENTAL listings here right now (not sales)? A rising rental-DOM trend means longer vacancies and softer asking-rent achievability than the comps imply.
- What's the recent tenant-quality profile in this submarket — average credit score on applications, eviction rate, late-payment / NSF rate, and stable-employment percentage? A property-management company in the area should have these aggregated.
- How much new for-sale + rental construction is in the pipeline within 1–3 miles? Heavy new supply typically softens prices + rents 12–24 months out; constrained supply supports both.
Investment metrics
- 1% rule
- 0.98% ✗
- Cap rate
- 7.39%
- Cash-on-cash
- 3.91%
- DSCR
- 1.17
- GRM
- 8.5
CMA / ARV
- ARV (median comp)
- $212,530
- List price
- $164,999
- Delta
- -22.36%
- Verdict
- UNDERPRICED
- Comps
- 20 within 1.0 mi
Show comp detail 12 sales within ~0.75 mi
| Address | Dist | Beds/Ba | Sqft | Sold | Price | $/sf | Match |
|---|---|---|---|---|---|---|---|
| 2 Kittler Ave | 0.00mi | 3/1.5 | 1,144 (0%) | 0mo | $119,500 | $104 | 98 |
| 2 Crotteau St | 0.21mi | 3/1.0 | 1,144 (0%) | 4mo | $215,000 | $188 | 83 |
| 99 North Summer St | 0.18mi | 3/1.0 | 1,173 (+2%) | 0mo | $249,900 | $213 | 83 |
| 34 Anthony St | 0.29mi | 2/1.0 (-1) | 1,080 (-6%) | 2mo | $200,000 | $185 | 66 |
| 34 Upton St | 0.40mi | 3/2.0 | 1,274 (+11%) | 0mo | $310,000 | $243 | 62 |
| 40 Victory Ter | 0.50mi | 3/1.0 | 1,080 (-6%) | 3mo | $250,000 | $231 | 61 |
| 1 Richmond Ln | 0.30mi | 3/1.0 | 1,024 (-10%) | 6mo | $142,000 | $139 | 59 |
| 7 Hughes St | 0.59mi | 3/1.0 | 1,207 (+6%) | 3mo | $279,900 | $232 | 57 |
| 12 2nd St | 0.66mi | 3/1.5 | 1,225 (+7%) | 1mo | $282,000 | $230 | 54 |
| 6 Meadow Ln | 0.42mi | 3/1.0 | 1,312 (+15%) | 4mo | $227,900 | $174 | 49 |
| 8 School St | 0.68mi | 3/1.0 | 1,234 (+8%) | 3mo | $210,000 | $170 | 49 |
| 8 Frederick Ln | 0.56mi | 2/1.0 (-1) | 996 (-13%) | 2mo | $257,500 | $259 | 42 |
Match score weights: distance 35% · size 25% · config 20% · recency 20%. Top-matched comps best support the ARV.
Projected returns pro-forma
6.66% appreciation · 3.0% rent growth · sell at horizon
- IRR
- 20.1%
- Equity multiple
- 2.38×
- Total profit
- $63,811
- Equity at exit
- $110,721
- IRR
- 19.1%
- Equity multiple
- 4.87×
- Total profit
- $178,759
- Equity at exit
- $207,120
Cash invested: $46,200 (down + closing). Projections, not guarantees.
Landlord ↔ Tenant lean methodology
- Overall (STATE)
- 20 Strongly Tenant-Friendly
- State Massachusetts
- 20 Strongly Tenant-Friendly · D+15
- County
- — inherits STATE
- City
- — inherits STATE
ZIP-level market 01220
- Home prices YoY
- 2.3%
- Active inventory
- 62
- Price-to-rent
- 8.5×
Monthly cashflow live
- Estimated rent
- $1,616 medium interval (Pro) →
- Mortgage (P&I)
- −$865
- Tax from tax record
- −$192 /mo · $2,309/yr
- Insurance
- −$69
- HOA
- −$0
- Vacancy / Maint / Mgmt
- −$339
- Net cashflow
- $150
Break-even live
Sensitivity live
| Price | -10% $244 | -5% $197 | +0% $150 | +5% $104 | +10% $57 |
|---|---|---|---|---|---|
| Rent | -10% $23 | -5% $87 | +0% $150 | +5% $214 | +10% $278 |
| Rate | -1.0pp $234 | -0.5pp $192 | base $150 | +0.5pp $108 | +1.0pp $64 |
UW: 25.0% down · 7.5% · 30yr · 1.5% tax · 5.0% vac · 8.0% maint · 8.0% mgmt
Financing live
Cash to close
- Down payment
- $41,250
- Closing costs
- $4,950
- Reserves months
- —
- Total cash needed
- —
Loan-product check · same deal, 3 products live
Conventional
25% down · 7.5% · 30yr
- Down + closing
- —
- Monthly P&I
- —
- Monthly cashflow
- —
- DSCR
- —
- Eligible?
- —
Personal DTI + credit; lowest rate.
DSCR
20% down · 8.5% · 30yr
- Down + closing
- —
- Monthly P&I
- —
- Monthly cashflow
- —
- DSCR
- —
- Eligible?
- —
No personal income docs; deal must DSCR.
Hard money
10% down · 12.0% · 12mo
- Down + closing
- —
- Monthly P&I
- —
- Monthly cashflow
- —
- DSCR
- —
- Eligible?
- —
Short-term bridge; refi at stabilization.
Rent comps 2 comps
| Address | Beds | Baths | Sqft | Rent | $/sqft | DOM | Units | Dist |
|---|---|---|---|---|---|---|---|---|
| 98 Columbia St Adams, MA | 4.0 | 1.5 | 1300 | $1,800 | $1.38 | 45d | 1 | 0.27mi |
| 7 Allen St Adams, MA | 2.0 | 1.0 | 1000 | $1,350 | $1.35 | 23d | 1 | 0.39mi |
Listing history 15 events
-
2026-06-15days on market $164,999 Active 74 DOM
-
2026-06-13days on market $164,999 Active 72 DOM
-
2026-06-12days on market $164,999 Active 71 DOM
-
2026-06-09days on market $164,999 Active 68 DOM
-
2026-06-08days on market $164,999 Active 67 DOM
-
2026-06-07days on market $164,999 Active 66 DOM
-
2026-06-07days on market $164,999 Active 65 DOM
-
2026-06-04days on market $164,999 Active 62 DOM
-
2026-06-02days on market $164,999 Active 61 DOM
-
2026-06-01days on market $164,999 Active 60 DOM
-
2026-05-31days on market $164,999 Active 59 DOM
-
2026-05-31days on market $164,999 Active 58 DOM
-
2026-04-02$174,999 New 606-char remark
Show marketing remark (606 chars)
Fixer-upper with solid potential. 3-bedroom, 1.5-bath home offering 1,144 sq ft on a 2,614 sq ft lot. Built in 1910, this property is in need of updates and repairs but offers a great opportunity to add value.Roof was replaced approximately 4 years ago. Foundation is generally solid with some areas needing attention. Home will require updates to plumbing and electrical systems, and windows may need replacement. Features include gas heat with steam radiators and original plaster walls. No central air.Ideal for investors or buyers looking to renovate and customize. Being sold as-is.Images coming soon!
-
2015-09-30soldstatus $90,000 292-char remark
Show marketing remark (292 chars)
OPEN HOUSE SATURDAY AUGUST 8TH 1:00-2:30. Three bedroom One and a half bath home in Adams. This home has been very well maintained over the years with beautifully maintained hardwood floors. Spacious laundry room on the first floor and all vinyl replacement windows and a newer gas boiler.
-
2015-07-24$93,800 292-char remark
Show marketing remark (292 chars)
OPEN HOUSE SATURDAY AUGUST 8TH 1:00-2:30. Three bedroom One and a half bath home in Adams. This home has been very well maintained over the years with beautifully maintained hardwood floors. Spacious laundry room on the first floor and all vinyl replacement windows and a newer gas boiler.
ⓘ Source: listings_history table (triggers on properties + properties_extension) + one-shot
backfill from property_details.listing_events for pre-trigger history.
Tax reassessment forecast MA · Partial reset (capped growth)
- Current annual tax
- $2,309 · $192/mo
- Projected year-2 tax
- $2,309 · $192/mo
- Expected delta
- $0/yr ($0/mo · 0.0%)
ⓘ Screening estimate from a state-policy table — verify with the county assessor before closing.
Climate risk First Street
- Flood 1/10 Low FEMA zone X · 0% chance over 30 yrs
- Wildfire 3/10 Moderate
- Heat 3/10 Moderate 7 d/yr ≥90°F today · 18 d/yr by 30 yrs out
- Wind 4/10 Moderate 9% chance of damaging wind over 30 yrs
- Air quality 2/10 Low 1 unhealthy d/yr today · 1 by 30 yrs out
Nearby sold comps map
Loading sold comps map…
Walkable amenities ~0.75 mi
Loading nearby amenities…
Taxation est. · year 1
- Rental income
- $19,395
- − Mortgage interest
- −$9,243
- − Property taxes
- −$2,309
- − Insurance
- −$825
- − Repairs & maintenance
- −$1,552
- − Management
- −$1,552
- − Depreciation
- −$4,800
- Taxable loss
- −$884
- Est. tax savings @ 24.0%
- +$212
- After-tax cash flow
- $2,017/yr
For passive investors: Depreciation is non-cash, so a rental often shows a tax loss while cash-flowing — sheltering income. Rental losses are passive: they offset passive income freely, and up to $25,000/yr can offset ordinary (W-2) income if you actively participate and your MAGI is under $100k (phasing out to $0 by $150k); unused losses carry forward. On sale, claimed depreciation is recaptured at up to 25%, and gains may owe capital-gains tax (a 1031 exchange can defer both). Figures are a year-1 estimate at your 24.0% rate — not tax advice; consult a CPA.
Schools (NCES district)
- District
- Adams-Cheshire
- NCES district ID
- 2501780
- Math proficiency
- 14% ▼ -13.00%
- Reading proficiency
- 31% ▼ -4.00%
- Median HH income
- $45,956
- Composite
- 19.53/100
- National rank
- #8765
- State rank
- #285 of 302 in MA
Livability — Adams
- Score
- 71/100
- State rank
- #131
- US rank
- #7262
Category grades
Schools grade is shown separately in the Schools card above.
Census & demographics
- Census place
- Adams, MA
- City population
- 8,106
- Population (ZIP)
- 8,106
Population outlook (Berkshire County) Hauer SSP2
- Today (2025)
- 119,723 people
- By 2030
- 114,608 · -4.3%
- By 2040
- 102,806 · -14.1%
- By 2050
- 91,305 · -23.7%
- By 2075
- 71,517 · -40.3%
- By 2100
- 57,988 · -51.6%
Race, ethnicity, and origin ACS 2023
- Neighborhood character
- Predominantly White (94%)
- Race & ethnicity
- White 94% Two or more races 3% Hispanic / Latino 2%
- Common ancestry
- Romanian 18% Lithuanian 16% Slovak 1%
- Foreign-born
- 2% · Vietnam
- Languages at home
- 96% English-only · Spanish 2% Russian/Polish/Slavic 2% Vietnamese 1%
Political lean MEDSL · Berkshire
- 2024 margin
- Solid D (+39.9) · D 68.9% · R 29.0% · Other 2.1%
- 2008→2024 swing
- -12.5pp toward R · 2008: 52.4pp · 2024: 39.9pp
- All cycles
- 2024: D+39.9 2020: D+47.1 2016: D+41.5 2012: D+53.7 2008: D+52.4
Not yet ingested
- Civics
- —
Market trends
- HPI YoY
- ▲ 6.66%
- Current HPI
- 295.6616
- Rent YoY
- —
- Metro
- —
- State GDP YoY
- ▲ 2.28%
- F500 in state
- 38
Industry mix (Fortune 500 HQ in MA)
| Industry | F500 HQs | Revenue |
|---|---|---|
| Technology | 3 | $17B |
|
||
| Insurance | 2 | $84B |
|
||
| Retail | 2 | $76B |
|
||
| Life Sciences | 1 | $43B |
|
||
| Energy Technology | 1 | $31B |
|
||
| Aerospace / Defense | 1 | $18B |
|
||
Price history
+86.6% since first listed3 events — show timeline
- 2026-04-02 Listed $174,999 MLS PIN
- 2015-09-30 Sold (MLS) $90,000 BCMLS
- 2015-07-24 Listed $93,800 BCMLS
Property tax history
+3.9%/yrLatest (2023): $2,309 · +2.8% YoY. Source: county tax records.
Cash-flow waterfall
monthlySold comps — $/sqft
last 12 mo · ≤1 miLoading sold comps…