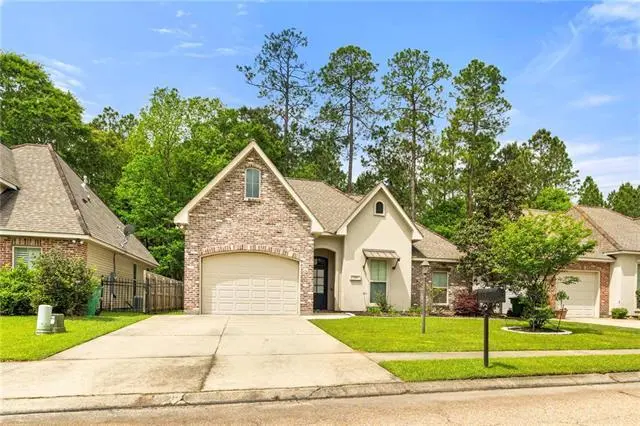
564 Bateleur Way · Covington, LA
Flood risk 1/10 · Minimal
- FEMA flood zone
- X
- Chance of flooding over 30 yrs
- 0.0%
- Est. flood insurance / yr
- $507 – $1,088
Fire risk 7/10 · Major
- Est. fire insurance / yr
- $1,269 – $2,357
Heat risk 9/10 · Severe
- Hot days now (above 109°F)
- 7 days/yr
- Hot days in 30 yrs
- 22 days/yr
Wind risk 9/10 · Severe
- Chance of severe wind over 30 yrs
- 99.0%
Air-quality risk 2/10 · Minimal
- Unhealthy air days now
- 0 days/yr
- Unhealthy air days in 30 yrs
- 1 days/yr
Risk factors via First Street. Map © Google.
Why this score? — see what drove the B+ grade
The composite is a weighted blend of 9 inputs, each scored 0–100. Each bar is that input's sub-score; the figure is the points it added to the 100-point composite (weight × sub-score).
- Cash flow +30.0/30.0
- ARV discount +12.7/15.0
- DSCR +10.0/10.0
- 1% rule +8.3/10.0
- Appreciation +5.0/10.0
- Schools +4.3/10.0
- Livability +3.8/5.0
- Rent growth +2.5/5.0
- Condition / age +2.5/5.0
$285,000
🖨 Deal sheet (PDF) 📄 Offer letter ✓ Due diligence
Listing remarks MLS
Don't miss out on this gorgeous Bateleur Way home featuring a spacious three bedroom, two bath layout with no carpet for a sleek and contemporary look. Relax or entertain on the covered A-frame vaulted patio, ideal for enjoying the tranquil surroundings. Inside, the open floor plan, pantry, and granite countertops create a stylish and functional space. Situated in Flood zone C, this home offers both style and safety for your family.
Key facts
- Pantry
- Open floor plan
- Granite countertops
Tags
Neighborhood map
What this means for you Summary
Snapshot
- This is a 3-bed/2.0-bath single-family listed at $285k.
Deal economics
- At list price, monthly cash flow is $1k ($14k/yr) — positive.
- The deal already cash-flows at list — no discount required.
- Meets the 1% rule at list price ($4k rent vs $285k).
- Recommended offer: $268k (6.0% below list) — sets the bar for market timing.
- Cap rate 11.1% vs local median 3.9% in Covington — top-decile yield for the area; either an underpriced asset or a hidden risk that comps aren't pricing in. Stress-test before assuming the spread holds.
Location & tenants
- Location reads 75/100 on livability (#17 in LA, #3,876 nationally) — a middle-class / working-renter tenant base. Strengths: employment A+, housing A+, health & safety A+; Watch: amenities F, commute F.
- St. Tammany Parish (suburban): math 43% / reading 55% proficiency, ranked #11 of 98 in LA (top 11%) — families likely to look elsewhere, expect single-tenant / working-renter base with shorter leases.
- Market conditions: 2 active listings in the ZIP; 2 comparable units currently listed for rent nearby; 1,064 units permitted in St. Tammany Parish in 2024 (0 in 5+ unit buildings).
Forward outlook
- In year one you build about $11k of equity ($2k loan paydown + $9k appreciation (3.0% local appreciation)).
- St. Tammany County population projected at +27% by 2050 — long-run rental-demand tailwind backs the buy-and-hold thesis.
- At projected returns (3.0% appreciation + 3.0% rent growth), your $80k cash investment doubles in ~4 years — after that, you're playing with house money.
- By year 4, paydown + projected appreciation supports a ~$36k cash-out refi (75% LTV) — recoverable capital for the next deal without selling this one.
Negotiation context
- It's been on market 62 days — a 6% lower offer ($268k) is reasonable based on typical stale-listing flexibility.
- 8 sale attempts since 13y ago with the ask held roughly flat each time — persistent listings suggest the price (not the market) is what's stuck; bring a comps-based counter.
Risks & watch-outs
- Climate carrying-cost: severe wind risk, 99% chance of damaging wind over 30y; major wildfire risk; extreme-heat days projected 7→22/yr by 2055 (HVAC capex compounding) — expect insurance premiums to compound above CPI over the hold.
Questions for the listing agent
- It's been on market 62 days. Have you received any prior offers? Is the seller open to a 6% concession, seller financing, or rate buy-down credit?
- What does the HOA fee cover, when was the last increase, and are there any pending special assessments or reserve-fund shortfalls?
- Why hasn't it sold? Are there any deal-killer items the seller is aware of (foundation, flood, title, zoning, code violations)?
- Is there a deadline driving the sale (1031 exchange, divorce, estate, relocation)? That informs how much negotiation room exists.
- Schools are B-rated — typically a magnet for longer-tenancy family renters. What's the average tenant stay here, and is there a school-zone premium baked into asking?
- What's the average days-on-market for RENTAL listings here right now (not sales)? A rising rental-DOM trend means longer vacancies and softer asking-rent achievability than the comps imply.
- What's the recent tenant-quality profile in this submarket — average credit score on applications, eviction rate, late-payment / NSF rate, and stable-employment percentage? A property-management company in the area should have these aggregated.
- How much new for-sale + rental construction is in the pipeline within 1–3 miles? Heavy new supply typically softens prices + rents 12–24 months out; constrained supply supports both.
Investment metrics
- 1% rule
- 1.33% ✓
- Cap rate
- 11.07%
- Cash-on-cash
- 17.05%
- DSCR
- 1.76
- GRM
- 6.2
CMA / ARV
- ARV (median comp)
- $322,575
- List price
- $285,000
- Delta
- -11.65%
- Verdict
- UNDERPRICED
- Comps
- 20 within 1.0 mi
Show comp detail 12 sales within ~0.75 mi
| Address | Dist | Beds/Ba | Sqft | Sold | Price | $/sf | Match |
|---|---|---|---|---|---|---|---|
| 509 Bateleur Way | 0.10mi | 3/2.0 | 1,439 (-1%) | 1mo | $265,000 | $184 | 94 |
| 552 Bateleur Way | 0.03mi | 3/2.0 | 1,498 (+4%) | 8mo | $277,000 | $185 | 86 |
| 579 Bateleur Way | 0.05mi | 3/2.0 | 1,545 (+7%) | 2mo | $298,000 | $193 | 85 |
| 208 Treetop Ct | 0.34mi | 3/2.0 | 1,479 (+2%) | 1mo | $260,000 | $176 | 80 |
| 181 Northridge Dr | 0.46mi | 3/2.0 | 1,429 (-1%) | 1mo | $280,000 | $196 | 76 |
| 437 Bateleur Way | 0.25mi | 3/2.0 | 1,400 (-3%) | 10mo | $280,000 | $200 | 75 |
| 425 Bateleur Way | 0.28mi | 3/2.0 | 1,430 (-1%) | 13mo | $277,500 | $194 | 74 |
| 132 Eagle Landing Dr | 0.29mi | 3/2.0 | 1,352 (-7%) | 9mo | $267,000 | $197 | 68 |
| 187 Northridge Dr | 0.45mi | 3/2.0 | 1,420 (-2%) | 11mo | $250,000 | $176 | 67 |
| 113 Eagle Landing Dr | 0.29mi | 3/2.0 | 1,334 (-8%) | 10mo | $273,000 | $205 | 65 |
| 134 Northridge Dr | 0.55mi | 3/2.0 | 1,543 (+7%) | 2mo | $250,000 | $162 | 62 |
| 175 Northridge Dr | 0.48mi | 3/2.0 | 1,517 (+5%) | 11mo | $240,000 | $158 | 60 |
Match score weights: distance 35% · size 25% · config 20% · recency 20%. Top-matched comps best support the ARV.
Projected returns pro-forma
3.0% appreciation · 3.0% rent growth · sell at horizon
- IRR
- 23.5%
- Equity multiple
- 2.34×
- Total profit
- $106,538
- Equity at exit
- $128,148
- IRR
- 24.4%
- Equity multiple
- 4.48×
- Total profit
- $278,102
- Equity at exit
- $197,492
Cash invested: $79,800 (down + closing). Projections, not guarantees.
Landlord ↔ Tenant lean methodology
- Overall (STATE)
- 90 Strongly Landlord-Friendly
- State Louisiana
- 90 Strongly Landlord-Friendly · R+12
- County
- — inherits STATE
- City
- — inherits STATE
ZIP-level market 70434
- Active inventory
- 2
- Price-to-rent
- 6.2×
Monthly cashflow live
- Estimated rent
- $3,800 medium interval (Pro) →
- Mortgage (P&I)
- −$1,495
- Tax from tax record
- −$226 /mo · $2,711/yr
- Insurance
- −$119
- HOA
- −$29
- Vacancy / Maint / Mgmt
- −$798
- Net cashflow
- $1,134
Break-even live
Sensitivity live
| Price | -10% $1,295 | -5% $1,214 | +0% $1,134 | +5% $1,053 | +10% $972 |
|---|---|---|---|---|---|
| Rent | -10% $834 | -5% $984 | +0% $1,134 | +5% $1,284 | +10% $1,434 |
| Rate | -1.0pp $1,277 | -0.5pp $1,206 | base $1,134 | +0.5pp $1,060 | +1.0pp $985 |
UW: 25.0% down · 7.5% · 30yr · 1.5% tax · 5.0% vac · 8.0% maint · 8.0% mgmt
Financing live
Cash to close
- Down payment
- $71,250
- Closing costs
- $8,550
- Reserves months
- —
- Total cash needed
- —
Loan-product check · same deal, 3 products live
Conventional
25% down · 7.5% · 30yr
- Down + closing
- —
- Monthly P&I
- —
- Monthly cashflow
- —
- DSCR
- —
- Eligible?
- —
Personal DTI + credit; lowest rate.
DSCR
20% down · 8.5% · 30yr
- Down + closing
- —
- Monthly P&I
- —
- Monthly cashflow
- —
- DSCR
- —
- Eligible?
- —
No personal income docs; deal must DSCR.
Hard money
10% down · 12.0% · 12mo
- Down + closing
- —
- Monthly P&I
- —
- Monthly cashflow
- —
- DSCR
- —
- Eligible?
- —
Short-term bridge; refi at stabilization.
Rent comps 2 comps
| Address | Beds | Baths | Sqft | Rent | $/sqft | DOM | Units | Dist |
|---|---|---|---|---|---|---|---|---|
| 12099 Jones Rd Covington, LA | 3.0 | 2.0 | 1700 | $3,950 | $2.32 | 4d | 1 | 1.18mi |
| 12099 Jones Rd Covington, LA | 3.0 | 2.0 | 1700 | $3,650 | $2.15 | 13d | 1 | 1.18mi |
HOA detail
- Monthly dues
- $29 · $348/yr
Listing history 32 events
-
2026-06-21days on market $285,000 Active 62 DOM
-
2026-06-18days on market $285,000 Active 59 DOM
-
2026-06-17days on market $285,000 Active 58 DOM
-
2026-06-16days on market $285,000 Active 57 DOM
-
2026-06-15days on market $285,000 Active 56 DOM
-
2026-06-13days on market $285,000 Active 54 DOM
-
2026-06-10days on market $285,000 Active 51 DOM
-
2026-06-09days on market $285,000 Active 50 DOM
-
2026-06-08days on market $285,000 Active 49 DOM
-
2026-06-07days on market $285,000 Active 48 DOM
-
2026-06-03days on market $285,000 Active 44 DOM
-
2026-06-02days on market $285,000 Active 43 DOM
-
2026-06-01days on market $285,000 Active 42 DOM
-
2026-05-31days on market $285,000 Active 41 DOM
-
2026-04-20$285,000 Active 436-char remark
Show marketing remark (436 chars)
Don't miss out on this gorgeous Bateleur Way home featuring a spacious three bedroom, two bath layout with no carpet for a sleek and contemporary look. Relax or entertain on the covered A-frame vaulted patio, ideal for enjoying the tranquil surroundings. Inside, the open floor plan, pantry, and granite countertops create a stylish and functional space. Situated in Flood zone C, this home offers both style and safety for your family.
-
2024-01-03soldstatus $290,000 Closed
-
2024-01-03soldstatus $290,000
-
2023-12-07historical Active Under Contract
-
2023-12-03price $300,000
-
2023-11-23$315,000 Active
-
2023-11-23$300,000
-
2022-04-04soldstatus $285,500
-
2018-08-01soldstatus $212,000
-
2018-07-27soldstatus $212,000 Sold
-
2018-06-14historical Pending Continue to Show
-
2018-05-31$216,000 Active
-
2018-05-31$216,000
-
2015-12-30soldstatus $100,000
-
2013-06-21soldstatus $184,000
-
2013-04-09$184,000
-
2013-04-09$184,000
ⓘ Source: listings_history table (triggers on properties + properties_extension) + one-shot
backfill from property_details.listing_events for pre-trigger history.
Tax reassessment forecast LA · Resets to sale price
- Current annual tax
- $2,711 · $226/mo
- Projected year-2 tax
- $2,711 · $226/mo
- Expected delta
- $0/yr ($0/mo · 0.0%)
ⓘ Screening estimate from a state-policy table — verify with the county assessor before closing.
Climate risk First Street
- Flood 1/10 Low FEMA zone X · 0% chance over 30 yrs
- Wildfire 7/10 Severe
- Heat 9/10 Extreme 7 d/yr ≥109°F today · 22 d/yr by 30 yrs out
- Wind 9/10 Extreme 99% chance of damaging wind over 30 yrs
- Air quality 2/10 Low 0 unhealthy d/yr today · 1 by 30 yrs out
Nearby sold comps map
Loading sold comps map…
Walkable amenities ~0.75 mi
Loading nearby amenities…
Taxation est. · year 1
- Rental income
- $45,600
- − Mortgage interest
- −$15,964
- − Property taxes
- −$2,711
- − Insurance
- −$1,425
- − Repairs & maintenance
- −$3,648
- − Management
- −$3,648
- − HOA
- −$348
- − Depreciation
- −$8,291
- Taxable income
- $9,565
- Est. tax owed @ 24.0%
- −$2,296
- After-tax cash flow
- $11,310/yr
For passive investors: Depreciation is non-cash, so a rental often shows a tax loss while cash-flowing — sheltering income. Rental losses are passive: they offset passive income freely, and up to $25,000/yr can offset ordinary (W-2) income if you actively participate and your MAGI is under $100k (phasing out to $0 by $150k); unused losses carry forward. On sale, claimed depreciation is recaptured at up to 25%, and gains may owe capital-gains tax (a 1031 exchange can defer both). Figures are a year-1 estimate at your 24.0% rate — not tax advice; consult a CPA.
Schools (NCES district)
- District
- St. Tammany Parish
- NCES district ID
- 2201650
- Math proficiency
- 43% ▼ -32.00%
- Reading proficiency
- 55% ▼ -26.00%
- Median HH income
- $61,752
- Composite
- 43.04/100
- National rank
- #3098
- State rank
- #11 of 98 in LA
Livability — Covington
- Score
- 75/100
- State rank
- #17
- US rank
- #3876
Category grades
Schools grade is shown separately in the Schools card above.
Census & demographics
No demographic data for this ZIP.
Market trends
- HPI YoY
- —
- Current HPI
- —
- Rent YoY
- —
- Metro
- —
- State GDP YoY
- ▲ 3.29%
- F500 in state
- 10
Industry mix (Fortune 500 HQ in LA)
| Industry | F500 HQs | Revenue |
|---|---|---|
| Telecommunications | 2 | $23B |
|
||
| Utilities | 1 | $12B |
|
||
| Wholesale / Distribution | 1 | $5B |
|
||
| Advertising | 1 | $2B |
|
||
Price history
+54.9% since first listed18 events — show timeline
- 2026-04-20 Listed $285,000 GSREIN
- 2026-04-20 Listed $285,000 AcadianaMLS
- 2024-01-03 Sold (Public Records) $290,000 Public Records
- 2024-01-03 Sold (MLS) $290,000 GSREIN
- 2023-12-07 Contingent — GSREIN
- 2023-12-03 Price Changed $300,000 GSREIN
- 2023-11-23 Listed $300,000 AcadianaMLS
- 2023-11-23 Listed $315,000 GSREIN
- 2022-04-04 Sold (Public Records) $285,500 Public Records
- 2018-08-01 Sold (Public Records) $212,000 Public Records
- 2018-07-27 Sold (MLS) $212,000 GSREIN
- 2018-06-14 Contingent — GSREIN
- 2018-05-31 Listed $216,000 AcadianaMLS
- 2018-05-31 Listed $216,000 GSREIN
- 2015-12-30 Sold (Public Records) $100,000 Public Records
- 2013-06-21 Sold (MLS) $184,000 GSREIN
- 2013-04-09 Listed $184,000 AcadianaMLS
- 2013-04-09 Listed $184,000 GSREIN
Property tax history
+1.3%/yrLatest (2025): $2,711 · -3.4% YoY. Source: county tax records.
Cash-flow waterfall
monthlySold comps — $/sqft
last 12 mo · ≤1 miLoading sold comps…