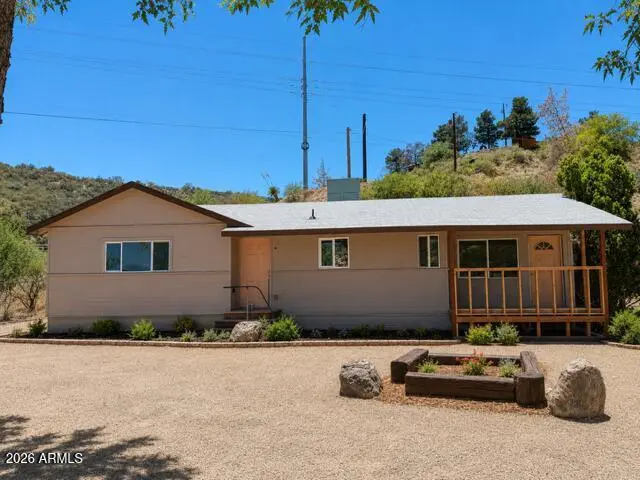
642 W Eagles Blf · Globe, AZ
Flood risk 8/10 · Major
- FEMA flood zone
- D
- Chance of flooding over 30 yrs
- 0.79%
- Est. flood insurance / yr
- $544 – $1,084
Fire risk 7/10 · Major
- Est. fire insurance / yr
- $610 – $1,132
Heat risk 6/10 · Moderate
- Hot days now (above 100°F)
- 7 days/yr
- Hot days in 30 yrs
- 20 days/yr
Wind risk 1/10 · Minimal
- Chance of severe wind over 30 yrs
- —
Air-quality risk 1/10 · Minimal
- Unhealthy air days now
- 0 days/yr
- Unhealthy air days in 30 yrs
- 0 days/yr
Risk factors via First Street. Map © Google.
Why this score? — see what drove the C- grade
The composite is a weighted blend of 9 inputs, each scored 0–100. Each bar is that input's sub-score; the figure is the points it added to the 100-point composite (weight × sub-score).
- Cash flow +24.0/30.0
- DSCR +7.7/10.0
- ARV discount +7.5/15.0
- 1% rule +5.0/10.0
- Livability +3.1/5.0
- Rent growth +2.5/5.0
- Condition / age +2.5/5.0
- Schools +1.4/10.0
- Appreciation +0.0/10.0
$199,999
🖨 Deal sheet 📄 Offer letter ✓ Due diligence
Listing remarks MLS
Private lot away from it all! Cozy front porch overlooking the fenced front yard with mature landscaping! Separate formal and living rooms! Formal dining or Eat-in kitchen! Home is 3 bed with one accessing back patio. Huge 20x18 workshop/storage area! Home does have newer Dual pane, Vinyl windows! 2 Carport! Home does need some work, please look at all pics for accurate representation
Key facts
- Renovated home
- Updated kitchen
- Conveniently located
Tags
Property features AI
Finance
- HOA & community: No association fees
Exterior
- Parking: Covered parking for 2 vehicles; Carport for 2 vehicles; RV access/parking
- Utilities: Private water company
- Home design: Single-family residence; Fee simple ownership; Property listed as fixer
- Construction: Wood frame construction with painted exterior; Composition roof; Building area per assessor
- Exterior features: Private yard; Outdoor storage; Chain link and open fencing options; Adjacent to wash; Natural desert front and back; Corner lot; Mountain view
Interior
- Kitchen: Dishwasher
- Bedrooms: Up to 3 bedrooms
- Flooring: Carpet; Linoleum
- Bathrooms: 2 full bathrooms
- Heating & cooling: Natural gas heating; Central air conditioning
- Interior features: Eat-in kitchen; Low-emissivity windows, dual-pane with vinyl frames
- Laundry & utility: Laundry details provided in remarks
Neighborhood map
What this means for you Summary
Snapshot
- This is a 3-bed/2.0-bath single-family listed at $200k.
Deal economics
- At list price, monthly cash flow is $324 ($4k/yr) — positive.
- The deal already cash-flows at list — no discount required.
- Meets the 1% rule at list price ($2k rent vs $200k).
- Cap rate 8.6% vs local median 5.8% in Globe — top-decile yield for the area; either an underpriced asset or a hidden risk that comps aren't pricing in. Stress-test before assuming the spread holds.
Location & tenants
- Location reads 62/100 on livability (#145 in AZ) — a middle-class / working-renter tenant base. Strengths: cost of living A+, housing A+; Watch: amenities D+, health & safety D+, crime F.
- Globe Unified District (4208) (town): math 11% / reading 21% proficiency, ranked #206 of 249 in AZ (top 83%) — low school quality limits family demand, transient renter base, plan for 1-2y turnover.
- Zoned schools: Copper Rim Elementary School (math 14% / reading 22%, grade F, #796 of 1,109 statewide, top 72%, 765 students, 56% FRL); High Desert Middle School (math 9% / reading 18%, grade F, #167 of 218 statewide, top 77%, 407 students, 55% FRL); Globe High School (math 12% / reading 22%, grade F, #252 of 381 statewide, top 67%, 498 students, 46% FRL) — zoned schools at 52% FRL track the district average.
- Market conditions: 63 active listings in the ZIP; 1 comparable units currently listed for rent nearby; 217 units permitted in Gila County in 2024 (0 in 5+ unit buildings).
Forward outlook
- Local home prices are declining (-3.0%/yr); year-one equity from $1k of loan paydown is wiped out by about $6k of value loss. Plan a longer hold.
- Gila County population projected at -18% by 2050 — secular population decline; favor cash flow + early exit over multi-decade hold.
Negotiation context
- Only 1 days on market — expect competitive offers; lowballing is unlikely to land.
- 3 sale attempts since 2y ago with the ask held roughly flat each time — persistent listings suggest the price (not the market) is what's stuck; bring a comps-based counter.
- Current owner paid $55k; list at $200k implies a 264% gain — meaningful room to come down on a strong offer.
Risks & watch-outs
- Watch-outs: flood insurance adds $68/mo.
- Climate carrying-cost: severe flood risk; major wildfire risk; extreme-heat days projected 7→20/yr by 2055 (HVAC capex compounding) — expect insurance premiums to compound above CPI over the hold.
Questions for the listing agent
- Built in 1965 — when were the roof, HVAC, electrical panel, plumbing, and water heater last replaced?
- What's the actual annual flood-insurance premium (NFIP or private), and is the property in a SFHA with mandatory coverage?
- Is there a deadline driving the sale (1031 exchange, divorce, estate, relocation)? That informs how much negotiation room exists.
- Schools are F-rated, which usually means shorter tenancies and higher turnover. Who's the typical renter profile here, and what's been the actual vacancy rate?
- Crime grade is F in this area — have there been break-ins, vandalism, or insurance claims at this property in the last 3 years? What carrier currently insures it and at what premium?
- What's the average days-on-market for RENTAL listings here right now (not sales)? A rising rental-DOM trend means longer vacancies and softer asking-rent achievability than the comps imply.
- What's the recent tenant-quality profile in this submarket — average credit score on applications, eviction rate, late-payment / NSF rate, and stable-employment percentage? A property-management company in the area should have these aggregated.
- How much new for-sale + rental construction is in the pipeline within 1–3 miles? Heavy new supply typically softens prices + rents 12–24 months out; constrained supply supports both.
Investment metrics
- 1% rule
- 1.00% ✓
- Cap rate
- 8.65%
- Cash-on-cash
- 8.40%
- DSCR
- 1.37
- GRM
- 8.3
CMA / ARV
- ARV (on-the-fly)
- $75,168
- Comps found
- 3
Show comp detail 3 sales within ~0.75 mi
| Address | Dist | Beds/Ba | Sqft | Sold | Price | $/sf | Match |
|---|---|---|---|---|---|---|---|
| 642 W Eagles Blf | 0.00mi | 3/1.0 | 1,296 (0%) | 3mo | $55,000 | $42 | 93 |
| 309 W Santee St | 0.61mi | 3/2.0 | 1,384 (+7%) | 21mo | $80,000 | $58 | 42 |
| 322 W Maple St | 0.69mi | 2/1.0 (-1) | 1,160 (-10%) | 22mo | $100,000 | $86 | 23 |
Match score weights: distance 35% · size 25% · config 20% · recency 20%. Top-matched comps best support the ARV.
Projected returns pro-forma
-3.0% appreciation · 3.0% rent growth · sell at horizon
- IRR
- -5.7%
- Equity multiple
- 0.79×
- Total profit
- $-11,805
- Equity at exit
- $29,821
- IRR
- 4.0%
- Equity multiple
- 1.29×
- Total profit
- $16,119
- Equity at exit
- $17,292
Cash invested: $56,000 (down + closing). Projections, not guarantees.
Landlord ↔ Tenant lean methodology
- Overall (STATE)
- 87 Strongly Landlord-Friendly
- State Arizona
- 87 Strongly Landlord-Friendly · R+3
- County
- — inherits STATE
- City
- — inherits STATE
ZIP-level market 85501
- Home prices YoY
- -12.1%
- Active inventory
- 63
- Price-to-rent
- 8.3×
Monthly cashflow live
- Estimated rent
- $2,000 medium interval (Pro) →
- Mortgage (P&I)
- −$1,049
- Tax from tax record
- −$56 /mo · $669/yr
- Insurance
- −$83
- Flood insurance flood zone
- −$68 /mo · $814/yr
- HOA
- −$0
- Vacancy / Maint / Mgmt
- −$420
- Net cashflow
- $324
Break-even live
UW: 25.0% down · 7.5% · 30yr · 1.5% tax · 5.0% vac · 8.0% maint · 8.0% mgmt
Financing live
Cash to close
- Down payment
- $50,000
- Closing costs
- $6,000
- Reserves months
- —
- Total cash needed
- —
Loan-product check · same deal, 3 products live
Conventional
25% down · 7.5% · 30yr
- Down + closing
- —
- Monthly P&I
- —
- Monthly cashflow
- —
- DSCR
- —
- Eligible?
- —
Personal DTI + credit; lowest rate.
DSCR
20% down · 8.5% · 30yr
- Down + closing
- —
- Monthly P&I
- —
- Monthly cashflow
- —
- DSCR
- —
- Eligible?
- —
No personal income docs; deal must DSCR.
Hard money
10% down · 12.0% · 12mo
- Down + closing
- —
- Monthly P&I
- —
- Monthly cashflow
- —
- DSCR
- —
- Eligible?
- —
Short-term bridge; refi at stabilization.
Rent comps 1 comps
| Address | Beds | Baths | Sqft | Rent | $/sqft | DOM | Units | Dist |
|---|---|---|---|---|---|---|---|---|
| 877 E Sycamore St Unit A Globe, AZ | 2.0 | 2.0 | 1500 | $2,000 | $1.33 | 24d | 1 | 1.25mi |
Listing history 2 events
-
2026-06-12remarks 699-char remark
-
2026-06-12$199,999 Active 1 DOM
ⓘ Source: listings_history table (triggers on properties + properties_extension) + one-shot
backfill from property_details.listing_events for pre-trigger history.
Tax reassessment forecast AZ · Resets to sale price
- Current annual tax
- $669 · $56/mo
- Projected year-2 tax
- $1,320 · $110/mo
- Expected delta
- +$651/yr (+$54/mo · 97.2%)
ⓘ Screening estimate from a state-policy table — verify with the county assessor before closing.
Climate risk First Street
- Flood 8/10 Severe FEMA zone D · 79% chance over 30 yrs
- Wildfire 7/10 Severe
- Heat 6/10 Major 7 d/yr ≥100°F today · 20 d/yr by 30 yrs out
- Wind 1/10 Low
- Air quality 1/10 Low 0 unhealthy d/yr today · 0 by 30 yrs out
Nearby sold comps map
Loading sold comps map…
Walkable amenities ~0.75 mi
Loading nearby amenities…
Taxation est. · year 1
- Rental income
- $24,000
- − Mortgage interest
- −$11,203
- − Property taxes
- −$669
- − Insurance
- −$1,814
- − Repairs & maintenance
- −$1,920
- − Management
- −$1,920
- − Depreciation
- −$5,818
- Taxable income
- $655
- Est. tax owed @ 24.0%
- −$157
- After-tax cash flow
- $3,734/yr
For passive investors: Depreciation is non-cash, so a rental often shows a tax loss while cash-flowing — sheltering income. Rental losses are passive: they offset passive income freely, and up to $25,000/yr can offset ordinary (W-2) income if you actively participate and your MAGI is under $100k (phasing out to $0 by $150k); unused losses carry forward. On sale, claimed depreciation is recaptured at up to 25%, and gains may owe capital-gains tax (a 1031 exchange can defer both). Figures are a year-1 estimate at your 24.0% rate — not tax advice; consult a CPA.
Schools (NCES district)
- District
- Globe Unified District (4208)
- NCES district ID
- 0403500
- Math proficiency
- 11% ▼ -11.00%
- Reading proficiency
- 21% ▼ -5.00%
- Median HH income
- $42,829
- Composite
- 13.87/100
- National rank
- #9485
- State rank
- #206 of 249 in AZ
Livability — Globe
- Score
- 62/100
- State rank
- #145
- US rank
- #17153
Category grades
Schools grade is shown separately in the Schools card above.
Census & demographics
- Population (ZIP)
- 12,353
Population outlook (Gila County) Hauer SSP2
- Today (2025)
- 50,229 people
- By 2030
- 48,202 · -4.0%
- By 2040
- 44,101 · -12.2%
- By 2050
- 41,041 · -18.3%
- By 2075
- 37,536 · -25.3%
- By 2100
- 32,485 · -35.3%
Race, ethnicity, and origin ACS 2023
- Neighborhood character
- Diverse neighborhood (Simpson 0.58)
- Race & ethnicity
- White 54% Hispanic / Latino 36% Two or more races 16% Native American 5% Asian 2% Black 2%
- Hispanic origin (detail)
- Mexican 30%
- Common ancestry
- Slovak 2% Italian 2% Serbian 1%
- Foreign-born
- 5% · Canada
- Languages at home
- 84% English-only · Spanish 12% Tagalog/Filipino 1%
Political lean MEDSL · Gila
- 2024 margin
- Solid R (+37.6) · D 30.8% · R 68.4%
- 2008→2024 swing
- -9.8pp toward R · 2008: -27.8pp · 2024: -37.6pp
- All cycles
- 2024: R+37.6 2020: R+34.1 2016: R+32.4 2012: R+26.4 2008: R+27.8
Not yet ingested
- Civics
- —
Market trends
- HPI YoY
- ▼ -40.96%
- Current HPI
- 296.458
- Rent YoY
- —
- Metro
- —
- State GDP YoY
- ▲ 4.54%
- F500 in state
- 20
Industry mix (Fortune 500 HQ in AZ)
| Industry | F500 HQs | Revenue |
|---|---|---|
| Technology | 2 | $13B |
|
||
| Mining / Metals | 1 | $23B |
|
||
| Environmental Services | 1 | $16B |
|
||
| Metals / Steel | 1 | $14B |
|
||
| Technology Distribution | 1 | $9B |
|
||
| Homebuilding | 1 | $8B |
|
||
Price history
+60.0% since first listed9 events — show timeline
- 2026-06-12 Listed $199,999 ARMLS
- 2026-03-16 Sold (MLS) $55,000 ARMLS
- 2026-02-02 Pending — ARMLS
- 2025-11-14 Price Changed $80,000 ARMLS
- 2025-08-08 Price Changed $95,000 ARMLS
- 2025-05-16 Price Changed $115,000 ARMLS
- 2025-01-15 Relisted — ARMLS
- 2025-01-09 Pending — ARMLS
- 2024-11-18 Listed $125,000 ARMLS
Property tax history
+24.1%/yrLatest (2025): $669 · +27.8% YoY. Source: county tax records.
Cash-flow waterfall
monthlySold comps — $/sqft
last 12 mo · ≤1 miLoading sold comps…