 🌊 Lakefront
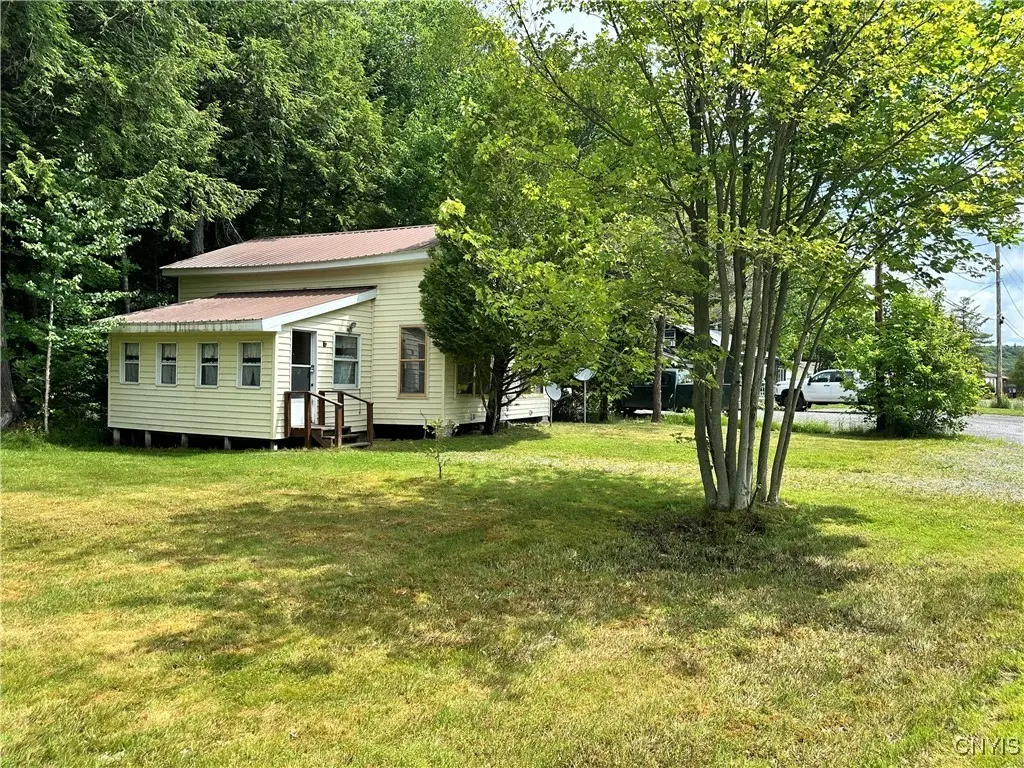
7109 Spruce · Natural Bridge, NY
Flood risk 6/10 · Moderate
- FEMA flood zone
- A
- Chance of flooding over 30 yrs
- 0.7%
- Est. flood insurance / yr
- $1,009 – $1,996
Fire risk 1/10 · Minimal
- Est. fire insurance / yr
- $691 – $1,283
Heat risk 1/10 · Minimal
- Hot days now (above 91°F)
- 7 days/yr
- Hot days in 30 yrs
- 16 days/yr
Wind risk 1/10 · Minimal
- Chance of severe wind over 30 yrs
- —
Air-quality risk 2/10 · Minimal
- Unhealthy air days now
- 0 days/yr
- Unhealthy air days in 30 yrs
- 1 days/yr
Risk factors via First Street. Map © Google.
Why this score? — see what drove the C- grade
The composite is a weighted blend of 9 inputs, each scored 0–100. Each bar is that input's sub-score; the figure is the points it added to the 100-point composite (weight × sub-score).
- Cash flow +16.3/30.0
- Appreciation +7.6/10.0
- ARV discount +7.5/15.0
- 1% rule +5.6/10.0
- DSCR +5.0/10.0
- Schools +3.4/10.0
- Livability +2.9/5.0
- Rent growth +2.5/5.0
- Condition / age +2.5/5.0
$129,900
🖨 Deal sheet 📄 Offer letter ✓ Due diligence
Listing remarks
Here’s your opportunity to be at Lake Bonaparte, this three bedroom one bath Camp has enclosed side porch. Great lake access without having to pay lakefront taxes. The property also has a stone driveway on a private road. There is lake access only to the water. There is no area for a dock. However, there is great swimming and you are less than a quarter mile from the public boat launch for easy access putting your boat in and out on those gorgeous days, you wish to be on the water. The property could easily be converted to possibly be a year round home in the future. This property is being sold as is due to the fact the sellers are not local and lives out of the area.
Key facts
- Stone driveway
- Private road
- Public boat launch
Tags
Property features AI
Exterior
- Parking: No garage
- Utilities: Well water; Septic tank; High-speed internet available; Phone service available
- Home design: Single-story; Vinyl-sided; Metal roof; Pillar/post/pier foundation
- Construction: Vinyl siding; Metal roof; Pillar/post/pier foundation; Built as a single-story structure
- Exterior features: Gravel driveway; Level, rectangular residential lot (approx. 50 x 93)
Interior
- Flooring: Hardwood; Vinyl; Varies
- Bathrooms: 1 full bathroom; 1 half bathroom; 1 main-level bathroom
- Interior features: Country kitchen
- Laundry & utility: Electric water heater
Neighborhood map
What this means for you Summary
Snapshot
- This is a 3-bed/1.5-bath single-family listed at $130k.
Deal economics
- At list price, monthly cash flow is $-54 ($-651/yr) — negative.
- To cash-flow at today's rent, offer at most $120k (7.4% below list).
- Meets the 1% rule at list price ($1k rent vs $130k).
- Recommended offer: $114k (12.0% below list) — sets the bar for market timing.
Location & tenants
- Location reads 58/100 on livability (#1,057 in NY) — a working-class tenant base; expect higher turnover. Strengths: cost of living A+; Watch: housing D+, schools D, health & safety D.
- Harrisville Central School District (rural): math 35% / reading 40% proficiency, ranked #673 of 755 in NY (top 89%) — families likely to look elsewhere, expect single-tenant / working-renter base with shorter leases.
- Market conditions: 26 active listings in the ZIP; 110 units permitted in Lewis County in 2024 (0 in 5+ unit buildings).
Forward outlook
- In year one you build about $8k of equity ($898 loan paydown + $7k appreciation (5.2% local appreciation)).
- Lewis County population projected at -20% by 2050 — secular population decline; favor cash flow + early exit over multi-decade hold.
- At projected returns (5.2% appreciation + 3.0% rent growth), your $36k cash investment doubles in ~5 years — after that, you're playing with house money.
- By year 5, paydown + projected appreciation supports a ~$33k cash-out refi (75% LTV) — recoverable capital for the next deal without selling this one.
Negotiation context
- It's been on market 362 days — a 12% lower offer ($114k) is reasonable based on typical stale-listing flexibility.
Risks & watch-outs
- Watch-outs: property tax is 2.6% of price; flood insurance adds $125/mo.
- Climate carrying-cost: in FEMA flood zone A (mandatory federal flood insurance) — expect insurance premiums to compound above CPI over the hold.
Questions for the listing agent
- What do current leases actually rent for vs. the listed asking? Can we see a recent rent roll and the last 12 months of T-12 income?
- It's been on market 362 days. Have you received any prior offers? Is the seller open to a 12% concession, seller financing, or rate buy-down credit?
- Built in 1970 — when were the roof, HVAC, electrical panel, plumbing, and water heater last replaced?
- Property tax is high relative to price — has the assessment been appealed recently, and will the sale trigger a re-assessment?
- What's the actual annual flood-insurance premium (NFIP or private), and is the property in a SFHA with mandatory coverage?
- Why hasn't it sold? Are there any deal-killer items the seller is aware of (foundation, flood, title, zoning, code violations)?
- Is there a deadline driving the sale (1031 exchange, divorce, estate, relocation)? That informs how much negotiation room exists.
- Schools are D-rated, which usually means shorter tenancies and higher turnover. Who's the typical renter profile here, and what's been the actual vacancy rate?
- Crime grade is F in this area — have there been break-ins, vandalism, or insurance claims at this property in the last 3 years? What carrier currently insures it and at what premium?
- This sits on a lake — are riparian / water-frontage rights deeded with the parcel? Any dock permits, shoreline easements, or HOA water-use restrictions?
- What's the documented flood / surge / shoreline-erosion history here (FEMA AND non-FEMA — e.g., storm surge, creek backup, septic-field saturation)?
- Any water-quality or seasonal algae-bloom issues that affect tenant satisfaction or short-term-rental demand?
- What's the average days-on-market for RENTAL listings here right now (not sales)? A rising rental-DOM trend means longer vacancies and softer asking-rent achievability than the comps imply.
- What's the recent tenant-quality profile in this submarket — average credit score on applications, eviction rate, late-payment / NSF rate, and stable-employment percentage? A property-management company in the area should have these aggregated.
- How much new for-sale + rental construction is in the pipeline within 1–3 miles? Heavy new supply typically softens prices + rents 12–24 months out; constrained supply supports both.
Investment metrics
- 1% rule
- 1.06% ✓
- Cap rate
- 6.95%
- Cash-on-cash
- 2.34%
- DSCR
- 1.10
- GRM
- 7.9
CMA / ARV
No comps found within radius.
Projected returns pro-forma
5.21% appreciation · 3.0% rent growth · sell at horizon
- IRR
- 12.0%
- Equity multiple
- 1.77×
- Total profit
- $28,187
- Equity at exit
- $75,244
- IRR
- 13.0%
- Equity multiple
- 3.42×
- Total profit
- $87,845
- Equity at exit
- $131,230
Cash invested: $36,372 (down + closing). Projections, not guarantees.
Landlord ↔ Tenant lean methodology
- Overall (STATE)
- 15 Strongly Tenant-Friendly
- State New York
- 15 Strongly Tenant-Friendly · D+10
- County
- — inherits STATE
- City
- — inherits STATE
ZIP-level market 13648
- Home prices YoY
- 1.6%
- Active inventory
- 26
- Price-to-rent
- 7.9×
Monthly cashflow live
- Estimated rent
- $1,373 medium interval (Pro) →
- Mortgage (P&I)
- −$681
- Tax from tax record
- −$279 /mo · $3,343/yr
- Insurance
- −$54
- Flood insurance flood zone
- −$125 /mo · $1,502/yr
- HOA
- −$0
- Vacancy / Maint / Mgmt
- −$288
- Net cashflow
- $-54
Break-even live
UW: 25.0% down · 7.5% · 30yr · 1.5% tax · 5.0% vac · 8.0% maint · 8.0% mgmt
Financing live
Cash to close
- Down payment
- $32,475
- Closing costs
- $3,897
- Reserves months
- —
- Total cash needed
- —
Loan-product check · same deal, 3 products live
Conventional
25% down · 7.5% · 30yr
- Down + closing
- —
- Monthly P&I
- —
- Monthly cashflow
- —
- DSCR
- —
- Eligible?
- —
Personal DTI + credit; lowest rate.
DSCR
20% down · 8.5% · 30yr
- Down + closing
- —
- Monthly P&I
- —
- Monthly cashflow
- —
- DSCR
- —
- Eligible?
- —
No personal income docs; deal must DSCR.
Hard money
10% down · 12.0% · 12mo
- Down + closing
- —
- Monthly P&I
- —
- Monthly cashflow
- —
- DSCR
- —
- Eligible?
- —
Short-term bridge; refi at stabilization.
Listing history 17 events
-
2026-06-18status $129,900 Pending 362 DOM
-
2026-06-17days on market $129,900 Active 362 DOM
-
2026-06-16days on market $129,900 Active 361 DOM
-
2026-06-15days on market $129,900 Active 360 DOM
-
2026-06-13days on market $129,900 Active 358 DOM
-
2026-06-12days on market $129,900 Active 357 DOM
-
2026-06-09days on market $129,900 Active 354 DOM
-
2026-06-08days on market $129,900 Active 353 DOM
-
2026-06-07days on market $129,900 Active 352 DOM
-
2026-06-05days on market $129,900 Active 350 DOM
-
2026-06-04days on market $129,900 Active 348 DOM
-
2026-06-02days on market $129,900 Active 347 DOM
-
2026-06-01days on market $129,900 Active 346 DOM
-
2026-05-31days on market $129,900 Active 345 DOM
-
2025-12-01price $129,900
-
2025-07-20price $139,900
-
2025-06-20$149,900 Active
ⓘ Source: listings_history table (triggers on properties + properties_extension) + one-shot
backfill from property_details.listing_events for pre-trigger history.
Tax reassessment forecast NY · Partial reset (capped growth)
- Current annual tax
- $3,343 · $279/mo
- Projected year-2 tax
- $3,343 · $279/mo
- Expected delta
- $0/yr ($0/mo · 0.0%)
ⓘ Screening estimate from a state-policy table — verify with the county assessor before closing.
Climate risk First Street
- Flood 6/10 Major FEMA zone A · 70% chance over 30 yrs
- Wildfire 1/10 Low
- Heat 1/10 Low 7 d/yr ≥91°F today · 16 d/yr by 30 yrs out
- Wind 1/10 Low
- Air quality 2/10 Low 0 unhealthy d/yr today · 1 by 30 yrs out
Nearby sold comps map
Loading sold comps map…
Walkable amenities ~0.75 mi
Loading nearby amenities…
Taxation est. · year 1
- Rental income
- $16,479
- − Mortgage interest
- −$7,276
- − Property taxes
- −$3,343
- − Insurance
- −$2,152
- − Repairs & maintenance
- −$1,318
- − Management
- −$1,318
- − Depreciation
- −$3,779
- Taxable loss
- −$2,708
- Est. tax savings @ 24.0%
- +$650
- After-tax cash flow
- $-1/yr
For passive investors: Depreciation is non-cash, so a rental often shows a tax loss while cash-flowing — sheltering income. Rental losses are passive: they offset passive income freely, and up to $25,000/yr can offset ordinary (W-2) income if you actively participate and your MAGI is under $100k (phasing out to $0 by $150k); unused losses carry forward. On sale, claimed depreciation is recaptured at up to 25%, and gains may owe capital-gains tax (a 1031 exchange can defer both). Figures are a year-1 estimate at your 24.0% rate — not tax advice; consult a CPA.
Schools (NCES district)
- District
- Harrisville Central School District
- NCES district ID
- 3613770
- Math proficiency
- 35% ▬ 0.00%
- Reading proficiency
- 40% ▲ 5.00%
- Median HH income
- $43,727
- Composite
- 34.34/100
- National rank
- #10205
- State rank
- #673 of 755 in NY
Livability — Natural Bridge
- Score
- 58/100
- State rank
- #1057
- US rank
- #21119
Category grades
Schools grade is shown separately in the Schools card above.
Census & demographics
- Population (ZIP)
- 2,236
Population outlook (Lewis County) Hauer SSP2
- Today (2025)
- 26,126 people
- By 2030
- 25,354 · -3.0%
- By 2040
- 23,359 · -10.6%
- By 2050
- 20,927 · -19.9%
- By 2075
- 15,533 · -40.5%
- By 2100
- 10,215 · -60.9%
Race, ethnicity, and origin ACS 2023
- Neighborhood character
- Predominantly White (92%)
- Race & ethnicity
- White 92% Two or more races 5% Hispanic / Latino 3%
- Common ancestry
- Lithuanian 11% Slovak 9% Iranian 1%
- Foreign-born
- 0%
- Languages at home
- 99% English-only · Spanish 1%
Political lean MEDSL · Lewis
- 2024 margin
- Solid R (+44.4) · D 27.8% · R 72.2%
- 2008→2024 swing
- -35.6pp toward R · 2008: -8.8pp · 2024: -44.4pp
- All cycles
- 2024: R+44.4 2020: R+39.2 2016: R+39.6 2012: R+8.7 2008: R+8.8
Not yet ingested
- Civics
- —
Market trends
- HPI YoY
- ▲ 5.21%
- Current HPI
- 333.5396
- Rent YoY
- —
- Metro
- —
- State GDP YoY
- ▲ 2.60%
- F500 in state
- 92
Industry mix (Fortune 500 HQ in NY)
| Industry | F500 HQs | Revenue |
|---|---|---|
| Financial Services | 10 | $950B |
|
||
| Consumer Goods | 9 | $162B |
|
||
| Insurance | 4 | $225B |
|
||
| Telecommunications | 2 | $144B |
|
||
| Pharmaceuticals | 2 | $112B |
|
||
| Media / Entertainment | 2 | $69B |
|
||
Price history
-13.3% since first listed3 events — show timeline
- 2025-12-01 Price Changed $129,900 CNYIS
- 2025-07-20 Price Changed $139,900 CNYIS
- 2025-06-20 Listed $149,900 CNYIS
Property tax history
-2.2%/yrLatest (2025): $3,343 · +1.2% YoY. Source: county tax records.
Cash-flow waterfall
monthlySold comps — $/sqft
last 12 mo · ≤1 miLoading sold comps…