 🏗️ New Construction
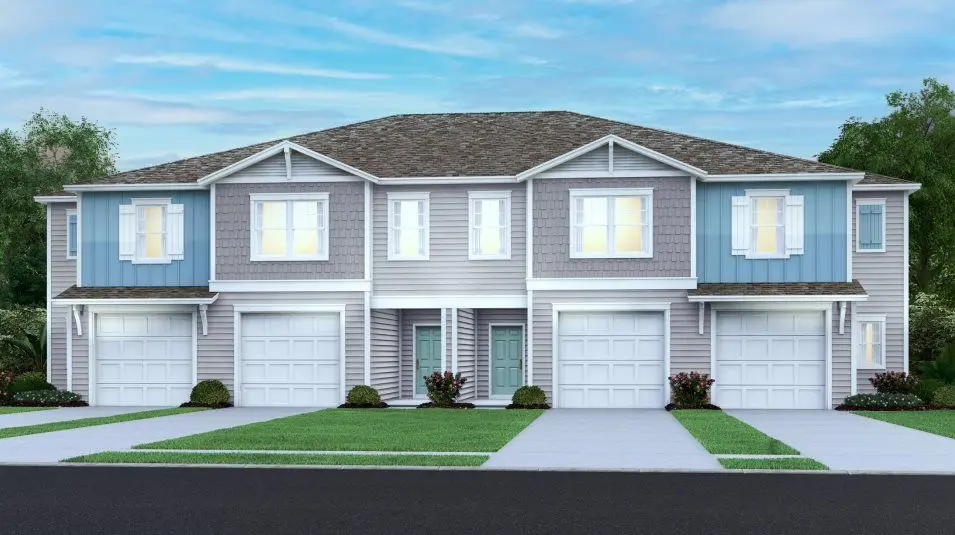
Lincoln Plan · Fruit Cove, FL
Flood risk No data
- FEMA flood zone
- —
- Chance of flooding over 30 yrs
- —
- Est. flood insurance / yr
- —
Fire risk No data
- Est. fire insurance / yr
- —
Heat risk No data
- Hot days now (above threshold)
- —
- Hot days in 30 yrs
- —
Wind risk No data
- Chance of severe wind over 30 yrs
- —
Air-quality risk No data
- Unhealthy air days now
- —
- Unhealthy air days in 30 yrs
- —
Risk factors via First Street. Map © Google.
Why this score? — see what drove the F grade
The composite is a weighted blend of 9 inputs, each scored 0–100. Each bar is that input's sub-score; the figure is the points it added to the 100-point composite (weight × sub-score).
- ARV discount +7.5/15.0
- Cash flow +7.4/30.0
- Schools +6.4/10.0
- Livability +3.5/5.0
- Rent growth +2.5/5.0
- Condition / age +2.5/5.0
- 1% rule +2.1/10.0
- DSCR +1.5/10.0
- Appreciation +0.0/10.0
$332,990
🖨 Deal sheet (PDF) 📄 Offer letter ✓ Due diligence
Listing remarks MLS
The first level of this two-story townhome features an open-concept design, allowing seamless transition between the gathering room, kitchen and nook. A covered lanai offers convenient indoor-outdoor dining and entertaining, while three bedrooms and a loft occupy the second floor.
Key facts
- Open-concept design
- Gathering room
- Kitchen
Tags
Neighborhood map
What this means for you Summary
Snapshot
- This is a 3-bed/2.5-bath townhouse listed at $333k.
Deal economics
- At list price, monthly cash flow is $-483 ($-6k/yr) — negative.
- To cash-flow at today's rent, offer at most $302k (9.4% below list).
- To meet the 1% rule (rent ≥ 1% of price), the offer needs to be $264k (20.7% below list).
- Recommended offer: $264k (20.7% below list) — sets the bar for 1% rule.
- Cap rate 4.7% vs local median 2.9% in Fruit Cove — top-decile yield for the area; either an underpriced asset or a hidden risk that comps aren't pricing in. Stress-test before assuming the spread holds.
Location & tenants
- Location reads 69/100 on livability (#469 in FL) — a middle-class / working-renter tenant base. Strengths: crime A+, employment A+, housing A+; Watch: amenities F, commute F, cost of living F.
- St. Johns (rural): math 75% / reading 73% proficiency, ranked #2 of 73 in FL (top 3%) — strong family-tenant draw, lease renewals of 3-5y typical; only 20% free/reduced lunch — higher-income household profile.
- Zoned schools: Timberlin Creek Elementary School (math 81% / reading 85%, grade A+, #65 of 2,144 statewide, top 3%, 1,311 students, 9% FRL); Switzerland Point Middle School (math 80% / reading 72%, grade A, #34 of 571 statewide, top 6%, 1,430 students, 5% FRL); Bartram Trail High School (math 68% / reading 75%, grade B+, #49 of 667 statewide, top 8%, 2,493 students, 4% FRL).
- Market conditions: Rents flat; 1335 active listings in the ZIP; 5 comparable units currently listed for rent nearby; rentals at typical pace (median 26d on market — plan ~3-4 weeks tenant-placement turnaround); high-income renter base; 5,575 units permitted in St. Johns County in 2024 (584 in 5+ unit buildings).
Forward outlook
- Local home prices are declining (-3.0%/yr); year-one equity from $3k of loan paydown is wiped out by about $11k of value loss. Plan a longer hold.
- St. Johns County population projected at +60% by 2050 — long-run rental-demand tailwind backs the buy-and-hold thesis.
Negotiation context
- It's been on market 361 days — a 12% lower offer ($293k) is reasonable based on typical stale-listing flexibility.
Questions for the listing agent
- What do current leases actually rent for vs. the listed asking? Can we see a recent rent roll and the last 12 months of T-12 income?
- It's been on market 361 days. Have you received any prior offers? Is the seller open to a 21% concession, seller financing, or rate buy-down credit?
- Why hasn't it sold? Are there any deal-killer items the seller is aware of (foundation, flood, title, zoning, code violations)?
- Is there a deadline driving the sale (1031 exchange, divorce, estate, relocation)? That informs how much negotiation room exists.
- Schools are A-rated — typically a magnet for longer-tenancy family renters. What's the average tenant stay here, and is there a school-zone premium baked into asking?
- The area grade is low — what's the realistic commute time and amenity access for the typical tenant pool here? Any planned neighborhood developments (good or bad) we should know about?
- What's the average days-on-market for RENTAL listings here right now (not sales)? A rising rental-DOM trend means longer vacancies and softer asking-rent achievability than the comps imply.
- What's the recent tenant-quality profile in this submarket — average credit score on applications, eviction rate, late-payment / NSF rate, and stable-employment percentage? A property-management company in the area should have these aggregated.
- How much new for-sale + rental construction is in the pipeline within 1–3 miles? Heavy new supply typically softens prices + rents 12–24 months out; constrained supply supports both.
Investment metrics
- 1% rule
- 0.71% ✗
- Cap rate
- 4.73%
- Cash-on-cash
- -5.57%
- DSCR
- 0.75
- GRM
- 11.7
CMA / ARV
- ARV (median comp)
- $371,729
- List price
- $332,990
- Delta
- -10.42%
- Verdict
- UNDERPRICED
- Comps
- 20 within 1.0 mi
Show comp detail 12 sales within ~0.75 mi
| Address | Dist | Beds/Ba | Sqft | Sold | Price | $/sf | Match |
|---|---|---|---|---|---|---|---|
| 90 Carmella Ct | 0.47mi | 3/2.5 | 1,707 (0%) | 2mo | $297,500 | $174 | 76 |
| 162 Yellowstone Dr | 0.28mi | 3/2.5 | 1,813 (+6%) | 1mo | $364,990 | $201 | 76 |
| 170 Yellowstone Dr | 0.29mi | 3/2.5 | 1,813 (+6%) | 1mo | $369,990 | $204 | 76 |
| 29 Craig Ct | 0.54mi | 3/2.5 | 1,707 (0%) | 0mo | $285,000 | $167 | 75 |
| 31 Craig Ct | 0.54mi | 3/2.5 | 1,707 (0%) | 1mo | $278,500 | $163 | 74 |
| 225 Yellowstone Dr | 0.34mi | 3/2.5 | 1,813 (+6%) | 1mo | $367,990 | $203 | 73 |
| 185 Appleton Ct | 0.45mi | 3/2.5 | 1,631 (-4%) | 2mo | $298,000 | $183 | 70 |
| 80 Belfort Ct | 0.50mi | 3/2.5 | 1,799 (+5%) | 1mo | $322,500 | $179 | 67 |
| 76 Belfort Ct | 0.49mi | 3/2.5 | 1,799 (+5%) | 1mo | $347,500 | $193 | 67 |
| 109 Belfort Ct | 0.53mi | 3/2.5 | 1,799 (+5%) | 2mo | $317,500 | $176 | 65 |
| 113 Belfort Ct | 0.53mi | 3/2.5 | 1,799 (+5%) | 2mo | $317,500 | $176 | 65 |
| 119 Hogan Ct | 0.56mi | 3/2.5 | 1,799 (+5%) | 1mo | $322,595 | $179 | 64 |
Match score weights: distance 35% · size 25% · config 20% · recency 20%. Top-matched comps best support the ARV.
Projected returns pro-forma
-3.0% appreciation · 0.08% rent growth · sell at horizon
- IRR
- -29.1%
- Equity multiple
- 0.05×
- Total profit
- $-98,491
- Equity at exit
- $55,426
- IRR
- -46.6%
- Equity multiple
- -0.48×
- Total profit
- $-154,384
- Equity at exit
- $32,140
Cash invested: $104,084 (down + closing). Projections, not guarantees.
Landlord ↔ Tenant lean methodology
- Overall (STATE)
- 87 Strongly Landlord-Friendly
- State Florida
- 87 Strongly Landlord-Friendly · R+3
- County
- — inherits STATE
- City
- — inherits STATE
ZIP-level market 32092
- Home prices YoY
- -32.2%
- Rents YoY
- 0.1%
- Active inventory
- 1335
- Price-to-rent
- 10.5×
Monthly cashflow live
- Estimated rent
- $2,641 high interval (Pro) →
- Mortgage (P&I)
- −$1,949
- Tax est. 1.5%
- −$465 /mo · $5,576/yr
- Insurance
- −$155
- HOA
- −$0
- Vacancy / Maint / Mgmt
- −$555
- Net cashflow
- $-483
Break-even live
Sensitivity live
| Price | -10% $-226 | -5% $-354 | +0% $-483 | +5% $-611 | +10% $-740 |
|---|---|---|---|---|---|
| Rent | -10% $-692 | -5% $-587 | +0% $-483 | +5% $-379 | +10% $-274 |
| Rate | -1.0pp $-296 | -0.5pp $-388 | base $-483 | +0.5pp $-579 | +1.0pp $-677 |
UW: 25.0% down · 7.5% · 30yr · 1.5% tax · 5.0% vac · 8.0% maint · 8.0% mgmt
Financing live
Cash to close
- Down payment
- $92,932
- Closing costs
- $11,152
- Reserves months
- —
- Total cash needed
- —
Loan-product check · same deal, 3 products live
Conventional
25% down · 7.5% · 30yr
- Down + closing
- —
- Monthly P&I
- —
- Monthly cashflow
- —
- DSCR
- —
- Eligible?
- —
Personal DTI + credit; lowest rate.
DSCR
20% down · 8.5% · 30yr
- Down + closing
- —
- Monthly P&I
- —
- Monthly cashflow
- —
- DSCR
- —
- Eligible?
- —
No personal income docs; deal must DSCR.
Hard money
10% down · 12.0% · 12mo
- Down + closing
- —
- Monthly P&I
- —
- Monthly cashflow
- —
- DSCR
- —
- Eligible?
- —
Short-term bridge; refi at stabilization.
Rent comps 5 comps
| Address | Beds | Baths | Sqft | Rent | $/sqft | DOM | Units | Dist |
|---|---|---|---|---|---|---|---|---|
| 78 Gaston Ct Saint Augustine, FL | 3.0 | 2.5 | 1635 | $2,250 | $1.38 | 25d | 1 | 0.29mi |
| 36 Viceroy Ct Saint Augustine, FL | 3.0 | 2.5 | 1631 | $2,850 | $1.75 | 19d | 1 | 0.47mi |
| 413 Rosemont Dr Saint Augustine, FL | 3.0 | 2.5 | 1782 | $2,125 | $1.19 | 25d | 1 | 0.53mi |
| 380 Belfort Ct Saint Augustine, FL | 3.0 | 2.5 | 1782 | $2,500 | $1.40 | 25d | 1 | 0.56mi |
| 18 Longtail Dr Saint Augustine, FL | 2.0–3.0 | 2.0–2.5 | 1714 | $3,142 | $1.83 | 3d | 9 | 0.62mi |
Listing history 16 events
-
2026-06-21days on market $332,990 Active 361 DOM
-
2026-06-18days on market $332,990 Active 358 DOM
-
2026-06-17days on market $332,990 Active 357 DOM
-
2026-06-16days on market $332,990 Active 356 DOM
-
2026-06-15days on market $332,990 Active 355 DOM
-
2026-06-13days on market $332,990 Active 353 DOM
-
2026-06-13days on market $332,990 Active 352 DOM
-
2026-06-10days on market $332,990 Active 349 DOM
-
2026-06-08days on market $332,990 Active 348 DOM
-
2026-06-07days on market $332,990 Active 347 DOM
-
2026-06-03days on market $332,990 Active 343 DOM
-
2026-06-02days on market $332,990 Active 342 DOM
-
2026-06-01days on market $332,990 Active 341 DOM
-
2026-05-31days on market $332,990 Active 340 DOM
-
2025-07-02price $332,990 281-char remark
Show marketing remark (281 chars)
The first level of this two-story townhome features an open-concept design, allowing seamless transition between the gathering room, kitchen and nook. A covered lanai offers convenient indoor-outdoor dining and entertaining, while three bedrooms and a loft occupy the second floor.
-
2025-06-25$332,490 Active 281-char remark
Show marketing remark (281 chars)
The first level of this two-story townhome features an open-concept design, allowing seamless transition between the gathering room, kitchen and nook. A covered lanai offers convenient indoor-outdoor dining and entertaining, while three bedrooms and a loft occupy the second floor.
ⓘ Source: listings_history table (triggers on properties + properties_extension) + one-shot
backfill from property_details.listing_events for pre-trigger history.
Nearby sold comps map
Loading sold comps map…
Walkable amenities ~0.75 mi
Loading nearby amenities…
Taxation est. · year 1
- Rental income
- $31,686
- − Mortgage interest
- −$20,823
- − Property taxes
- −$5,576
- − Insurance
- −$1,859
- − Repairs & maintenance
- −$2,535
- − Management
- −$2,535
- − Depreciation
- −$10,814
- Taxable loss
- −$12,455
- Est. tax savings @ 24.0%
- +$2,989
- After-tax cash flow
- $-2,806/yr
For passive investors: Depreciation is non-cash, so a rental often shows a tax loss while cash-flowing — sheltering income. Rental losses are passive: they offset passive income freely, and up to $25,000/yr can offset ordinary (W-2) income if you actively participate and your MAGI is under $100k (phasing out to $0 by $150k); unused losses carry forward. On sale, claimed depreciation is recaptured at up to 25%, and gains may owe capital-gains tax (a 1031 exchange can defer both). Figures are a year-1 estimate at your 24.0% rate — not tax advice; consult a CPA.
Schools (NCES district)
- District
- St. Johns
- NCES district ID
- 1201740
- Math proficiency
- 75% ▼ -5.00%
- Reading proficiency
- 73% ▼ -2.00%
- Median HH income
- $66,842
- Composite
- 64.31/100
- National rank
- #556
- State rank
- #2 of 73 in FL
Livability — Fruit Cove
- Score
- 69/100
- State rank
- #469
- US rank
- #8490
Category grades
Schools grade is shown separately in the Schools card above.
Census & demographics
- County
- Saint Johns County · 301,599 people
- Metro
- Jacksonville, FL
- Population (ZIP)
- 53,071
- Household income
- $131,020
- Rent vs Own
- Severe rent burden
- 706.0
Population outlook (St. Johns County) Hauer SSP2
- Today (2025)
- 303,941 people
- By 2030
- 342,590 · +12.7%
- By 2040
- 417,328 · +37.3%
- By 2050
- 487,011 · +60.2%
- By 2075
- 635,395 · +109.1%
- By 2100
- 717,469 · +136.1%
Race, ethnicity, and origin ACS 2023
- Neighborhood character
- Predominantly White (75%)
- Race & ethnicity
- White 75% Two or more races 11% Hispanic / Latino 9% Black 6% Asian 3%
- Hispanic origin (detail)
- Mexican 1% Puerto Rican 2% Cuban 2%
- Common ancestry
- Lithuanian 3% Scotch-Irish 3% Slovak 3%
- Foreign-born
- 10% · Canada, Vietnam
- Languages at home
- 87% English-only · Spanish 6% Russian/Polish/Slavic 2% Other Indo-European 2%
Political lean MEDSL · St. Johns
- 2024 margin
- Solid R (+31.4) · D 33.9% · R 65.2%
- 2008→2024 swing
- +0.2pp no change · 2008: -31.6pp · 2024: -31.4pp
- All cycles
- 2024: R+31.4 2020: R+26.7 2016: R+33.4 2012: R+37.8 2008: R+31.6
Not yet ingested
- Civics
- —
Market trends
- HPI YoY
- ▼ -123.26%
- Current HPI
- 259.732
- Rent YoY
- ▲ 0.08%
- Metro
- Jacksonville, FL
- State GDP YoY
- ▲ 3.28%
- F500 in state
- 36
Industry mix (Fortune 500 HQ in FL)
| Industry | F500 HQs | Revenue |
|---|---|---|
| Industrial Technology | 2 | $29B |
|
||
| Insurance | 2 | $17B |
|
||
| Retail | 1 | $60B |
|
||
| Technology Distribution | 1 | $58B |
|
||
| Homebuilding | 1 | $35B |
|
||
| Technology Manufacturing | 1 | $35B |
|
||
Price history
+0.2% since first listed2 events — show timeline
- 2025-07-02 Price Changed $332,990 Zillow
- 2025-06-25 Listed $332,490 Zillow
Cash-flow waterfall
monthlySold comps — $/sqft
last 12 mo · ≤1 miLoading sold comps…