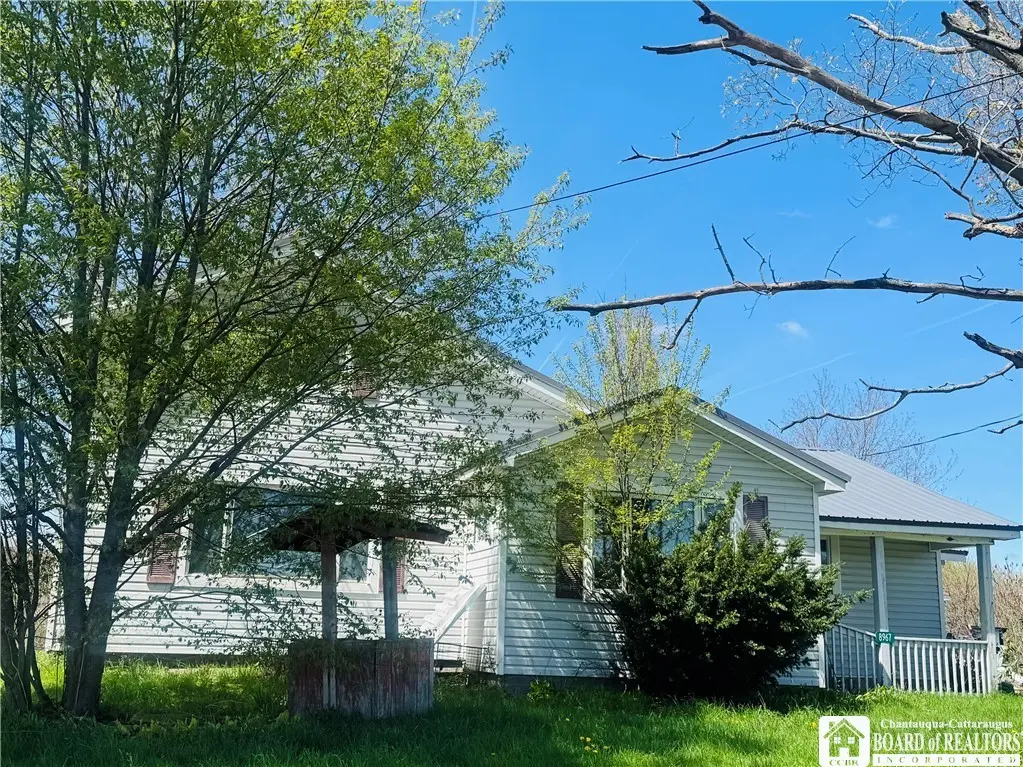
8967 Buttermilk Rd · South Dayton, NY
Flood risk 1/10 · Minimal
- FEMA flood zone
- X
- Chance of flooding over 30 yrs
- 0.0%
- Est. flood insurance / yr
- $473 – $860
Fire risk 3/10 · Minor
- Est. fire insurance / yr
- $691 – $1,283
Heat risk 1/10 · Minimal
- Hot days now (above 91°F)
- 7 days/yr
- Hot days in 30 yrs
- 16 days/yr
Wind risk 1/10 · Minimal
- Chance of severe wind over 30 yrs
- —
Air-quality risk 2/10 · Minimal
- Unhealthy air days now
- 1 days/yr
- Unhealthy air days in 30 yrs
- 2 days/yr
Risk factors via First Street. Map © Google.
Why this score? — see what drove the B+ grade
The composite is a weighted blend of 9 inputs, each scored 0–100. Each bar is that input's sub-score; the figure is the points it added to the 100-point composite (weight × sub-score).
- Cash flow +30.0/30.0
- 1% rule +10.0/10.0
- DSCR +10.0/10.0
- Appreciation +8.2/10.0
- ARV discount +7.5/15.0
- Schools +3.5/10.0
- Livability +2.8/5.0
- Rent growth +2.5/5.0
- Condition / age +2.5/5.0
$70,000
🖨 Deal sheet 📄 Offer letter ✓ Due diligence
Listing remarks MLS
Enjoy quiet and serene living on this 5 acre parcel with 4 bdrm vinyl sided farmhouse. Covered front porch, rear deck and enclosed mudroom. 2 bedrooms up and 2 bedrooms on the 1st floor. 1st floor bath. PROPERTY NEEDS A FULL ROOF, FURNACE, ELECTRIC REPAIR AND INTERIOR REHAB. CASH SALE ONLY!
Key facts
- Metal roof
- Gutted kitchen
- Back deck
Tags
Property features AI
Exterior
- Parking: Detached garage; One garage space
- Utilities: Private well water; Septic tank
- Home design: Single-story home; Resale property
- Construction: Vinyl siding; Attic/crawl hatchway(s) insulated; Stone foundation; Existing (previously built)
- Exterior features: Dirt driveway; Circular driveway; Rural, agricultural and irregular lot
Interior
- Bedrooms: Two main-level bedrooms
- Bathrooms: One full bathroom; One half bathroom
- Heating & cooling: Propane heating; Wall furnace
- Interior features: Bedroom on main level; Partial basement; Basement present; Fireplace (1)
- Laundry & utility: Electric water heater
Neighborhood map
What this means for you Summary
Snapshot
- This is a 3-bed/1.5-bath single-family listed at $70k.
Deal economics
- At list price, monthly cash flow is $285 ($3k/yr) — positive.
- The deal already cash-flows at list — no discount required.
- Meets the 1% rule at list price ($1k rent vs $70k).
- Recommended offer: $68k (3.0% below list) — sets the bar for market timing.
Location & tenants
- Location reads 56/100 on livability (#1,102 in NY) — a working-class tenant base; expect higher turnover. Strengths: cost of living A+, housing A+; Watch: schools F, crime F, amenities F.
- Pine Valley Central School District (South Dayton) (rural): math 33% / reading 49% proficiency, ranked #512 of 590 in NY (top 87%) — families likely to look elsewhere, expect single-tenant / working-renter base with shorter leases.
- Market conditions: 16 active listings in the ZIP; 127 units permitted in Chautauqua County in 2024 (0 in 5+ unit buildings).
Forward outlook
- In year one you build about $5k of equity ($484 loan paydown + $4k appreciation (6.3% local appreciation)).
- Chautauqua County population projected at -22% by 2050 — secular population decline; favor cash flow + early exit over multi-decade hold.
- At projected returns (6.3% appreciation + 3.0% rent growth), your $20k cash investment doubles in ~3 years — after that, you're playing with house money.
- By year 7, paydown + projected appreciation supports a ~$32k cash-out refi (75% LTV) — recoverable capital for the next deal without selling this one.
Negotiation context
- It's been on market 51 days — a 3% lower offer ($68k) is reasonable based on typical stale-listing flexibility.
- 4 sale attempts since 10y ago; this cycle's ask has dropped $10k (12%) from the opening price — seller is motivated, your offer sets the floor, not the list.
- Current owner paid $22k; list at $70k implies a 211% gain — meaningful room to come down on a strong offer.
Risks & watch-outs
- Watch-outs: property tax is 4.7% of price; built in 1910 — expect roof / HVAC / electrical / plumbing capex.
Questions for the listing agent
- It's been on market 51 days. Have you received any prior offers? Is the seller open to a 3% concession, seller financing, or rate buy-down credit?
- Built in 1910 — when were the roof, HVAC, electrical panel, plumbing, and water heater last replaced?
- Property tax is high relative to price — has the assessment been appealed recently, and will the sale trigger a re-assessment?
- Is there a deadline driving the sale (1031 exchange, divorce, estate, relocation)? That informs how much negotiation room exists.
- Schools are F-rated, which usually means shorter tenancies and higher turnover. Who's the typical renter profile here, and what's been the actual vacancy rate?
- Crime grade is F in this area — have there been break-ins, vandalism, or insurance claims at this property in the last 3 years? What carrier currently insures it and at what premium?
- What's the average days-on-market for RENTAL listings here right now (not sales)? A rising rental-DOM trend means longer vacancies and softer asking-rent achievability than the comps imply.
- What's the recent tenant-quality profile in this submarket — average credit score on applications, eviction rate, late-payment / NSF rate, and stable-employment percentage? A property-management company in the area should have these aggregated.
- How much new for-sale + rental construction is in the pipeline within 1–3 miles? Heavy new supply typically softens prices + rents 12–24 months out; constrained supply supports both.
Investment metrics
- 1% rule
- 1.73% ✓
- Cap rate
- 11.18%
- Cash-on-cash
- 17.47%
- DSCR
- 1.78
- GRM
- 4.8
CMA / ARV
- ARV (median comp)
- $233,236
- List price
- $70,000
- Delta
- -69.99%
- Verdict
- UNDERPRICED
- Comps
- 5 within 2.0 mi
Projected returns pro-forma
6.33% appreciation · 3.0% rent growth · sell at horizon
- IRR
- 30.7%
- Equity multiple
- 3.04×
- Total profit
- $39,909
- Equity at exit
- $45,489
- IRR
- 28.4%
- Equity multiple
- 6.26×
- Total profit
- $103,084
- Equity at exit
- $83,806
Cash invested: $19,600 (down + closing). Projections, not guarantees.
Landlord ↔ Tenant lean methodology
- Overall (STATE)
- 15 Strongly Tenant-Friendly
- State New York
- 15 Strongly Tenant-Friendly · D+10
- County
- — inherits STATE
- City
- — inherits STATE
ZIP-level market 14138
- Home prices YoY
- 1.7%
- Active inventory
- 16
- Price-to-rent
- 4.8×
Monthly cashflow live
- Estimated rent
- $1,208 medium interval (Pro) →
- Mortgage (P&I)
- −$367
- Tax from tax record
- −$273 /mo · $3,274/yr
- Insurance
- −$29
- HOA
- −$0
- Vacancy / Maint / Mgmt
- −$254
- Net cashflow
- $285
Break-even live
UW: 25.0% down · 7.5% · 30yr · 1.5% tax · 5.0% vac · 8.0% maint · 8.0% mgmt
Financing live
Cash to close
- Down payment
- $17,500
- Closing costs
- $2,100
- Reserves months
- —
- Total cash needed
- —
Loan-product check · same deal, 3 products live
Conventional
25% down · 7.5% · 30yr
- Down + closing
- —
- Monthly P&I
- —
- Monthly cashflow
- —
- DSCR
- —
- Eligible?
- —
Personal DTI + credit; lowest rate.
DSCR
20% down · 8.5% · 30yr
- Down + closing
- —
- Monthly P&I
- —
- Monthly cashflow
- —
- DSCR
- —
- Eligible?
- —
No personal income docs; deal must DSCR.
Hard money
10% down · 12.0% · 12mo
- Down + closing
- —
- Monthly P&I
- —
- Monthly cashflow
- —
- DSCR
- —
- Eligible?
- —
Short-term bridge; refi at stabilization.
Listing history 21 events
-
2026-06-18days on market $70,000 Active 51 DOM
-
2026-06-17days on market $70,000 Active 50 DOM
-
2026-06-16days on market $70,000 Active 49 DOM
-
2026-06-15days on market $70,000 Active 48 DOM
-
2026-06-13days on market $70,000 Active 46 DOM
-
2026-06-12days on market $70,000 Active 45 DOM
-
2026-06-09days on market $70,000 Active 42 DOM
-
2026-06-08days on market $70,000 Active 41 DOM
-
2026-06-07days on market $70,000 Active 40 DOM
-
2026-06-05days on market $70,000 Active 38 DOM
-
2026-06-04pricedays on market $70,000 Active 36 DOM
-
2026-06-02days on market $75,000 Active 35 DOM
-
2026-06-01days on market $75,000 Active 34 DOM
-
2026-05-31days on market $75,000 Active 33 DOM
-
2026-04-28$80,000 Active 810-char remark
-
2017-05-26soldstatus $22,500 291-char remark
Show marketing remark (291 chars)
Enjoy quiet and serene living on this 5 acre parcel with 4 bdrm vinyl sided farmhouse. Covered front porch, rear deck and enclosed mudroom. 2 bedrooms up and 2 bedrooms on the 1st floor. 1st floor bath. PROPERTY NEEDS A FULL ROOF, FURNACE, ELECTRIC REPAIR AND INTERIOR REHAB. CASH SALE ONLY!
-
2017-04-24historical 291-char remark
Show marketing remark (291 chars)
Enjoy quiet and serene living on this 5 acre parcel with 4 bdrm vinyl sided farmhouse. Covered front porch, rear deck and enclosed mudroom. 2 bedrooms up and 2 bedrooms on the 1st floor. 1st floor bath. PROPERTY NEEDS A FULL ROOF, FURNACE, ELECTRIC REPAIR AND INTERIOR REHAB. CASH SALE ONLY!
-
2017-03-01$22,500 291-char remark
Show marketing remark (291 chars)
Enjoy quiet and serene living on this 5 acre parcel with 4 bdrm vinyl sided farmhouse. Covered front porch, rear deck and enclosed mudroom. 2 bedrooms up and 2 bedrooms on the 1st floor. 1st floor bath. PROPERTY NEEDS A FULL ROOF, FURNACE, ELECTRIC REPAIR AND INTERIOR REHAB. CASH SALE ONLY!
-
2017-01-27historical
-
2017-01-19$24,900
-
2016-08-11$24,900
ⓘ Source: listings_history table (triggers on properties + properties_extension) + one-shot
backfill from property_details.listing_events for pre-trigger history.
Tax reassessment forecast NY · Partial reset (capped growth)
- Current annual tax
- $3,274 · $273/mo
- Projected year-2 tax
- $3,274 · $273/mo
- Expected delta
- $0/yr ($0/mo · 0.0%)
ⓘ Screening estimate from a state-policy table — verify with the county assessor before closing.
Climate risk First Street
- Flood 1/10 Low FEMA zone X · 0% chance over 30 yrs
- Wildfire 3/10 Moderate
- Heat 1/10 Low 7 d/yr ≥91°F today · 16 d/yr by 30 yrs out
- Wind 1/10 Low
- Air quality 2/10 Low 1 unhealthy d/yr today · 2 by 30 yrs out
Nearby sold comps map
Loading sold comps map…
Walkable amenities ~0.75 mi
Loading nearby amenities…
Taxation est. · year 1
- Rental income
- $14,497
- − Mortgage interest
- −$3,921
- − Property taxes
- −$3,274
- − Insurance
- −$350
- − Repairs & maintenance
- −$1,160
- − Management
- −$1,160
- − Depreciation
- −$2,036
- Taxable income
- $2,596
- Est. tax owed @ 24.0%
- −$623
- After-tax cash flow
- $2,801/yr
For passive investors: Depreciation is non-cash, so a rental often shows a tax loss while cash-flowing — sheltering income. Rental losses are passive: they offset passive income freely, and up to $25,000/yr can offset ordinary (W-2) income if you actively participate and your MAGI is under $100k (phasing out to $0 by $150k); unused losses carry forward. On sale, claimed depreciation is recaptured at up to 25%, and gains may owe capital-gains tax (a 1031 exchange can defer both). Figures are a year-1 estimate at your 24.0% rate — not tax advice; consult a CPA.
Schools (NCES district)
- District
- Pine Valley Central School District (South Dayton)
- NCES district ID
- 3623070
- Math proficiency
- 33% ▼ -1.00%
- Reading proficiency
- 49% ▲ 21.00%
- Median HH income
- $44,734
- Composite
- 34.76/100
- National rank
- #5129
- State rank
- #512 of 590 in NY
Livability — South Dayton
- Score
- 56/100
- State rank
- #1102
- US rank
- #22525
Category grades
Schools grade is shown separately in the Schools card above.
Census & demographics
- Population (ZIP)
- 2,019
Population outlook (Chautauqua County) Hauer SSP2
- Today (2025)
- 123,454 people
- By 2030
- 118,509 · -4.0%
- By 2040
- 107,311 · -13.1%
- By 2050
- 96,703 · -21.7%
- By 2075
- 76,757 · -37.8%
- By 2100
- 60,984 · -50.6%
Race, ethnicity, and origin ACS 2023
- Neighborhood character
- Predominantly White (87%)
- Race & ethnicity
- White 87% Hispanic / Latino 11% Two or more races 2%
- Hispanic origin (detail)
- Mexican 3%
- Common ancestry
- Romanian 9% Lithuanian 2% Italian 1%
- Foreign-born
- 9% · Canada
- Languages at home
- 84% English-only · Spanish 10% German/W. Germanic 5%
Political lean MEDSL · Chautauqua
- 2024 margin
- Strong R (+22.0) · D 39.0% · R 61.0%
- 2008→2024 swing
- -22.9pp toward R · 2008: 0.9pp · 2024: -22.0pp
- All cycles
- 2024: R+22.0 2020: R+19.8 2016: R+24.6 2012: R+8.2 2008: D+0.9
Not yet ingested
- Civics
- —
Market trends
- HPI YoY
- ▲ 6.33%
- Current HPI
- 374.5823
- Rent YoY
- —
- Metro
- —
- State GDP YoY
- ▲ 2.60%
- F500 in state
- 92
Industry mix (Fortune 500 HQ in NY)
| Industry | F500 HQs | Revenue |
|---|---|---|
| Financial Services | 10 | $950B |
|
||
| Consumer Goods | 9 | $162B |
|
||
| Insurance | 4 | $225B |
|
||
| Telecommunications | 2 | $144B |
|
||
| Pharmaceuticals | 2 | $112B |
|
||
| Media / Entertainment | 2 | $69B |
|
||
Price history
+181.1% since first listed9 events — show timeline
- 2026-06-03 Price Changed $70,000 UNYREIS
- 2026-05-19 Price Changed $75,000 UNYREIS
- 2026-04-28 Listed $80,000 UNYREIS
- 2017-05-26 Sold (MLS) $22,500 WNYREIS
- 2017-04-24 Listing Removed — WNYREIS
- 2017-03-01 Listed $22,500 WNYREIS
- 2017-01-27 Listing Removed — WNYREIS
- 2017-01-19 Listed $24,900 WNYREIS
- 2016-08-11 Listed $24,900 UNYREIS
Property tax history
-5.1%/yrLatest (2025): $3,274 · +0.3% YoY. Source: county tax records.
Cash-flow waterfall
monthlySold comps — $/sqft
last 12 mo · ≤1 miLoading sold comps…