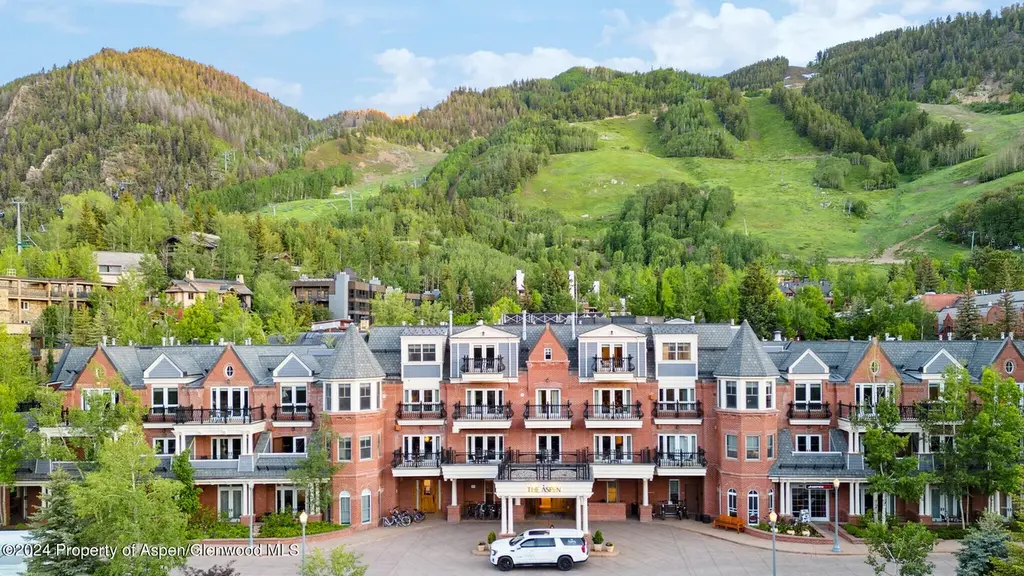
415 E Dean St., Unit 50, Week 8 · Aspen, CO
Flood risk 6/10 · Moderate
- FEMA flood zone
- X (unshaded)
- Chance of flooding over 30 yrs
- 0.69%
- Est. flood insurance / yr
- $473 – $860
Fire risk 4/10 · Minor
- Est. fire insurance / yr
- $939 – $1,743
Heat risk 1/10 · Minimal
- Hot days now (above 76°F)
- 9 days/yr
- Hot days in 30 yrs
- 24 days/yr
Wind risk 1/10 · Minimal
- Chance of severe wind over 30 yrs
- —
Air-quality risk 3/10 · Minor
- Unhealthy air days now
- 2 days/yr
- Unhealthy air days in 30 yrs
- 3 days/yr
Risk factors via First Street. Map © Google.
Why this score? — see what drove the A- grade
The composite is a weighted blend of 9 inputs, each scored 0–100. Each bar is that input's sub-score; the figure is the points it added to the 100-point composite (weight × sub-score).
- Cash flow +30.0/30.0
- 1% rule +10.0/10.0
- DSCR +10.0/10.0
- Appreciation +10.0/10.0
- ARV discount +7.5/15.0
- Rent growth +5.0/5.0
- Condition / age +4.8/5.0
- Schools +4.1/10.0
- Livability +3.3/5.0
$210,000
🖨 Deal sheet 📄 Offer letter ✓ Due diligence
Listing remarks MLS
2024 renovations completed (including new decor, furniture, lighting, paint and carpets). The Aspen Mountain Residences is nestled at the base of the mountain between the St. Regis and Little Nell properties. Bars, restaurants, shopping and nightlife are literally a few steps from The Aspen. The multitude of amenities and services include daily maid service, concierge, valet, heated outdoor pool along with 2 hot tubs, gym, fire pit, ski shop, e-bikes for owners use and daily breakfast service. Unit 50 is a 4th-floor 2-bedroom luxury penthouse condominium overlooking the pool. Enjoy outstanding views from roof-top deck featuring private hot tub. Enjoy prime ski week 8 (End of Feb) every year. 2026 dates - Fixed Week: Sun, February 22 - Sun, March 1. Float Weeks: Sun, November 15 to Sun, November 22 and Sun, November 22 to Sun, November 29 .2027 dates - Fixed Week: Sun, February 21 - Sun, February 28. Float Week: Sun, June 13 to Sun, June 20. 1/20th interest - includes fixed week and float week every year and additional float week every other year.
Key facts
- Concierge
- Heated outdoor pool
- Valet
Tags
Neighborhood map
What this means for you Summary
Snapshot
- This is a 2-bed/2.5-bath single-family listed at $210k. Condition is rated excellent.
Deal economics
- At list price, monthly cash flow is $4k ($50k/yr) — positive.
- The deal already cash-flows at list — no discount required.
- Meets the 1% rule at list price ($8k rent vs $210k).
- Recommended offer: $185k (12.0% below list) — sets the bar for market timing.
Location & tenants
- Location reads 66/100 on livability (#142 in CO) — a middle-class / working-renter tenant base. Strengths: commute A+, employment A+, schools B+; Watch: amenities F, cost of living F, health & safety F.
- Aspen School District No. 1 In The County Of Pitkin And Sta (rural): math 36% / reading 56% proficiency, ranked #18 of 86 in CO (top 21%) — families likely to look elsewhere, expect single-tenant / working-renter base with shorter leases; only 4% free/reduced lunch — higher-income household profile.
- Market conditions: Rents rising fast (+22.1%/yr); 324 active listings in the ZIP; solid renter incomes; 145 units permitted in Pitkin County in 2024 (89 in 5+ unit buildings).
- At $7,967/mo this rent would consume 116% of the median local household income ($83k/yr) (locally 566% of renters already pay >50% of income on rent) — very limited rent-growth headroom before tenants either downsize or default.
Forward outlook
- In year one you build about $22k of equity ($1k loan paydown + $21k appreciation (10.0% local appreciation)).
- Pitkin County population projected at +20% by 2050 — long-run rental-demand tailwind backs the buy-and-hold thesis.
- At projected returns (10.0% appreciation + 8.0% rent growth), your $59k cash investment doubles in ~1 year — after that, you're playing with house money.
- By year 2, paydown + projected appreciation supports a ~$36k cash-out refi (75% LTV) — recoverable capital for the next deal without selling this one.
Negotiation context
- It's been on market 178 days — a 12% lower offer ($185k) is reasonable based on typical stale-listing flexibility.
- Current owner paid $122k; list at $210k implies a 72% gain — meaningful room to come down on a strong offer.
Risks & watch-outs
- Climate carrying-cost: major flood risk — expect insurance premiums to compound above CPI over the hold.
Questions for the listing agent
- It's been on market 178 days. Have you received any prior offers? Is the seller open to a 12% concession, seller financing, or rate buy-down credit?
- What does the HOA fee cover, when was the last increase, and are there any pending special assessments or reserve-fund shortfalls?
- Why hasn't it sold? Are there any deal-killer items the seller is aware of (foundation, flood, title, zoning, code violations)?
- Is there a deadline driving the sale (1031 exchange, divorce, estate, relocation)? That informs how much negotiation room exists.
- Schools are B-rated — typically a magnet for longer-tenancy family renters. What's the average tenant stay here, and is there a school-zone premium baked into asking?
- What's the average days-on-market for RENTAL listings here right now (not sales)? A rising rental-DOM trend means longer vacancies and softer asking-rent achievability than the comps imply.
- What's the recent tenant-quality profile in this submarket — average credit score on applications, eviction rate, late-payment / NSF rate, and stable-employment percentage? A property-management company in the area should have these aggregated.
- How much new for-sale + rental construction is in the pipeline within 1–3 miles? Heavy new supply typically softens prices + rents 12–24 months out; constrained supply supports both.
Investment metrics
- 1% rule
- 3.79% ✓
- Cap rate
- 30.09%
- Cash-on-cash
- 84.99%
- DSCR
- 4.78
- GRM
- 2.2
CMA / ARV
- ARV (median comp)
- $4,333,336
- List price
- $210,000
- Delta
- -95.15%
- Verdict
- UNDERPRICED
- Comps
- 15 within 1.0 mi
Show comp detail 5 sales within ~0.75 mi
| Address | Dist | Beds/Ba | Sqft | Sold | Price | $/sf | Match |
|---|---|---|---|---|---|---|---|
| 140 Maple Ln | 0.58mi | 3/2.5 (+1) | 1,818 (+4%) | 1mo | $2,185,000 | $1,202 | 61 |
| 979 Queen St | 0.46mi | 3/3.0 (+1) | 1,888 (+8%) | 5mo | $9,250,000 | $4,899 | 54 |
| 310 Oak Ln | 0.60mi | 3/2.0 (+1) | 1,803 (+3%) | 10mo | $2,176,000 | $1,207 | 52 |
| 111 S Sixth St | 0.68mi | 3/3.0 (+1) | 1,960 (+12%) | 11mo | $6,325,000 | $3,227 | 32 |
| 1412 Crystal Lake Rd | 0.59mi | 2/0.5 | 2,000 (+14%) | 23mo | $24,500,000 | $12,250 | 22 |
Match score weights: distance 35% · size 25% · config 20% · recency 20%. Top-matched comps best support the ARV.
Projected returns pro-forma
10.0% appreciation · 8.0% rent growth · sell at horizon
- IRR
- 99.7%
- Equity multiple
- 8.18×
- Total profit
- $422,263
- Equity at exit
- $189,185
- IRR
- 96.5%
- Equity multiple
- 20.39×
- Total profit
- $1,140,278
- Equity at exit
- $407,984
Cash invested: $58,800 (down + closing). Projections, not guarantees.
Landlord ↔ Tenant lean methodology
- Overall (STATE)
- 38 Tenant-Leaning
- State Colorado
- 38 Tenant-Leaning · D+4
- County
- — inherits STATE
- City
- — inherits STATE
ZIP-level market 81611
- Home prices YoY
- 3.6%
- Rents YoY
- 22.1%
- Active inventory
- 324
- Price-to-rent
- 2.2×
Monthly cashflow live
- Estimated rent
- $7,967 medium interval (Pro) →
- Mortgage (P&I)
- −$1,101
- Tax est. 1.5%
- −$262 /mo · $3,150/yr
- Insurance
- −$88
- HOA
- −$678
- Vacancy / Maint / Mgmt
- −$1,673
- Net cashflow
- $4,165
Break-even live
UW: 25.0% down · 7.5% · 30yr · 1.5% tax · 5.0% vac · 8.0% maint · 8.0% mgmt
Financing live
Cash to close
- Down payment
- $52,500
- Closing costs
- $6,300
- Reserves months
- —
- Total cash needed
- —
Loan-product check · same deal, 3 products live
Conventional
25% down · 7.5% · 30yr
- Down + closing
- —
- Monthly P&I
- —
- Monthly cashflow
- —
- DSCR
- —
- Eligible?
- —
Personal DTI + credit; lowest rate.
DSCR
20% down · 8.5% · 30yr
- Down + closing
- —
- Monthly P&I
- —
- Monthly cashflow
- —
- DSCR
- —
- Eligible?
- —
No personal income docs; deal must DSCR.
Hard money
10% down · 12.0% · 12mo
- Down + closing
- —
- Monthly P&I
- —
- Monthly cashflow
- —
- DSCR
- —
- Eligible?
- —
Short-term bridge; refi at stabilization.
HOA detail
- Monthly dues
- $678 · $8,136/yr
- Likely covers
- poolgymdoorman
Listing history 13 events
-
2026-06-05days on market $210,000 Active 178 DOM
-
2026-06-02days on market $210,000 Active 176 DOM
-
2026-06-01days on market $210,000 Active 175 DOM
-
2026-05-31days on market $210,000 Active 174 DOM
-
2026-05-30days on market $210,000 Active 173 DOM
-
2025-12-08$210,000 Active 1078-char remark
Show marketing remark (1078 chars)
2024 renovations completed (including new decor, furniture, lighting, paint and carpets). The Aspen Mountain Residences is nestled at the base of the mountain between the St. Regis and Little Nell properties. Bars, restaurants, shopping and nightlife are literally a few steps from The Aspen. The multitude of amenities and services include daily maid service, concierge, valet, heated outdoor pool along with 2 hot tubs, gym, fire pit, ski shop, e-bikes for owners use and daily breakfast service. Unit 50 is a 4th-floor 2-bedroom luxury penthouse condominium overlooking the pool. Enjoy outstanding views from roof-top deck featuring private hot tub. Enjoy prime ski week 8 (End of Feb) every year. 2026 dates - Fixed Week: Sun, February 22 - Sun, March 1. Float Weeks: Sun, November 15 to Sun, November 22 and Sun, November 22 to Sun, November 29 .2027 dates - Fixed Week: Sun, February 21 - Sun, February 28. Float Week: Sun, June 13 to Sun, June 20. 1/20th interest - includes fixed week and float week every year and additional float week every other year.
-
2021-08-19soldstatus $122,000 431-char remark
Show marketing remark (431 chars)
Top floor (4th floor penthouse) luxury two bedroom condominium overlooking pool with private hot tub on deck. Largest two bedroom in the building. Great views. Hyatt Grand Aspen offers outstanding service and amenities. Walk to parks, restaurants and shopping. Enjoy week 11 every year along with use of approximately 10 floating days. 2022 dates: Sun, March 20th to Sun, March 27th. 2023 dates: Sun, March 19th to Sun, March 26th.
-
2018-09-04soldstatus $120,000
-
2017-02-02soldstatus $90,000
-
2016-01-13soldstatus $88,900
-
2013-07-08soldstatus $50,000
-
2010-12-21soldstatus $100,000
-
2010-10-11soldstatus $110,000
ⓘ Source: listings_history table (triggers on properties + properties_extension) + one-shot
backfill from property_details.listing_events for pre-trigger history.
Climate risk First Street
- Flood 6/10 Major FEMA zone X (unshaded) · 69% chance over 30 yrs
- Wildfire 4/10 Moderate
- Heat 1/10 Low 9 d/yr ≥76°F today · 24 d/yr by 30 yrs out
- Wind 1/10 Low
- Air quality 3/10 Moderate 2 unhealthy d/yr today · 3 by 30 yrs out
Nearby sold comps map
Loading sold comps map…
Walkable amenities ~0.75 mi
Loading nearby amenities…
Taxation est. · year 1
- Rental income
- $95,604
- − Mortgage interest
- −$11,763
- − Property taxes
- −$3,150
- − Insurance
- −$1,050
- − Repairs & maintenance
- −$7,648
- − Management
- −$7,648
- − HOA
- −$8,136
- − Depreciation
- −$6,109
- Taxable income
- $50,099
- Est. tax owed @ 24.0%
- −$12,024
- After-tax cash flow
- $37,952/yr
For passive investors: Depreciation is non-cash, so a rental often shows a tax loss while cash-flowing — sheltering income. Rental losses are passive: they offset passive income freely, and up to $25,000/yr can offset ordinary (W-2) income if you actively participate and your MAGI is under $100k (phasing out to $0 by $150k); unused losses carry forward. On sale, claimed depreciation is recaptured at up to 25%, and gains may owe capital-gains tax (a 1031 exchange can defer both). Figures are a year-1 estimate at your 24.0% rate — not tax advice; consult a CPA.
Condition & rehab AI · 12 photos
This luxury penthouse condominium is in excellent condition with modern amenities and stunning mountain views. It is move-in ready and offers a high ROI for both resale and rental markets.
Value-add opportunities
- Both landscaping and curb appeal improvements — enhances curb appeal and adds value
- Both smart home integration — improves convenience and adds modern appeal
- Both smart thermostat and lighting system — enhances comfort and energy efficiency
Renovation cost estimate screening
Value-add ROI direction
- Both landscaping and curb appeal improvements — enhances curb appeal and adds value ↑
- Both smart home integration — improves convenience and adds modern appeal ↑
- Both smart thermostat and lighting system — enhances comfort and energy efficiency ↑
ⓘ Cost ranges are severity-bucket heuristics (US national rule-of-thumb). Get contractor quotes + a written scope before underwriting a rehab budget.
Schools (NCES district)
- District
- Aspen School District No. 1 In The County Of Pitkin And Sta
- NCES district ID
- 0802280
- Math proficiency
- 36% ▼ -5.00%
- Reading proficiency
- 56% ▼ -3.00%
- Median HH income
- $66,694
- Composite
- 40.98/100
- National rank
- #3595
- State rank
- #18 of 86 in CO
Livability — Aspen
- Score
- 66/100
- State rank
- #142
- US rank
- #11780
Category grades
Schools grade is shown separately in the Schools card above.
Census & demographics
- Census place
- Aspen, CO
- County
- Pitkin County · 9,068 people
- City population
- 9,068
- Metro
- Glenwood Springs, CO
- Population (ZIP)
- 9,068
- Household income
- $82,664
- Rent vs Own
- Severe rent burden
- 566.0
Population outlook (Pitkin County) Hauer SSP2
- Today (2025)
- 20,121 people
- By 2030
- 21,110 · +4.9%
- By 2040
- 22,707 · +12.9%
- By 2050
- 24,105 · +19.8%
- By 2075
- 27,933 · +38.8%
- By 2100
- 30,018 · +49.2%
Race, ethnicity, and origin ACS 2023
- Neighborhood character
- Predominantly White (81%)
- Race & ethnicity
- White 81% Hispanic / Latino 10% Two or more races 7% Asian 4%
- Hispanic origin (detail)
- Mexican 4% Salvadoran 4%
- Common ancestry
- Slovak 3% Iranian 3% Romanian 3%
- Foreign-born
- 15% · Canada, Dominican Republic, China
- Languages at home
- 82% English-only · Spanish 9% Other Indo-European 2% Chinese 2%
Political lean MEDSL · Pitkin
- 2024 margin
- Solid D (+44.2) · D 71.0% · R 26.8% · Other 2.2%
- 2008→2024 swing
- -4.6pp toward R · 2008: 48.8pp · 2024: 44.2pp
- All cycles
- 2024: D+44.2 2020: D+51.9 2016: D+45.4 2012: D+37.9 2008: D+48.8
Not yet ingested
- Civics
- —
Market trends
- HPI YoY
- ▲ 12.97%
- Current HPI
- 370.9593
- Rent YoY
- ▲ 22.07%
- Metro
- Glenwood Springs, CO
- State GDP YoY
- ▲ 1.95%
- F500 in state
- 14
Industry mix (Fortune 500 HQ in CO)
| Industry | F500 HQs | Revenue |
|---|---|---|
| Technology Distribution | 1 | $31B |
|
||
| Food / Agriculture | 1 | $18B |
|
||
| Packaging | 1 | $14B |
|
||
| Healthcare | 1 | $13B |
|
||
| Energy | 1 | $10B |
|
||
| Technology | 1 | $4B |
|
||
Price history
+90.9% since first listed8 events — show timeline
- 2025-12-08 Listed $210,000 AGMLS
- 2021-08-19 Sold (MLS) $122,000 AGMLS
- 2018-09-04 Sold (MLS) $120,000 AGMLS
- 2017-02-02 Sold (MLS) $90,000 AGMLS
- 2016-01-13 Sold (MLS) $88,900 AGMLS
- 2013-07-08 Sold (MLS) $50,000 AGMLS
- 2010-12-21 Sold (MLS) $100,000 AGMLS
- 2010-10-11 Sold (MLS) $110,000 AGMLS
Cash-flow waterfall
monthlySold comps — $/sqft
last 12 mo · ≤1 miLoading sold comps…