 Multi-family
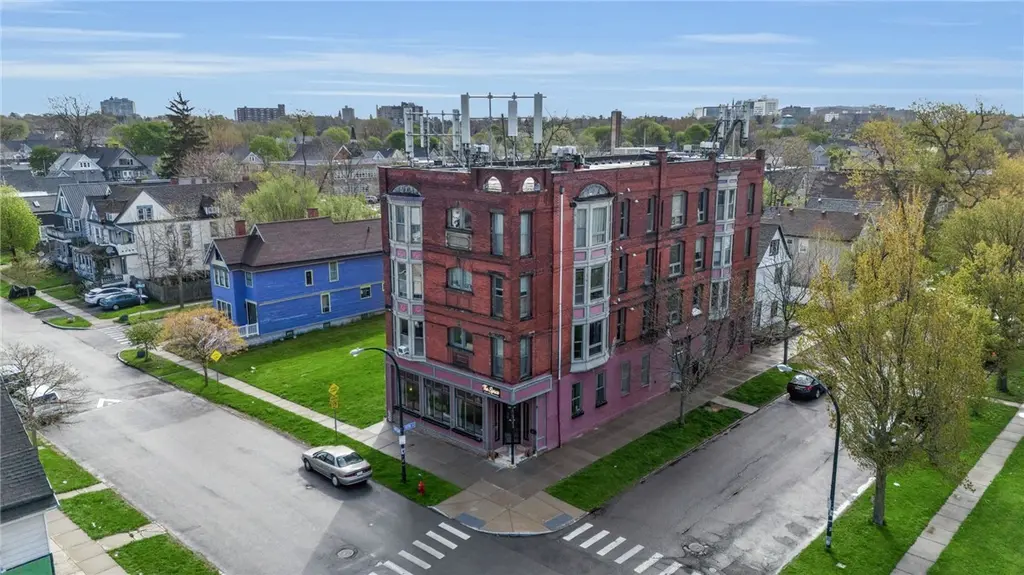
339 Rhode Island St · Buffalo, NY
Flood risk 6/10 · Moderate
- FEMA flood zone
- X (unshaded)
- Chance of flooding over 30 yrs
- 0.75%
- Est. flood insurance / yr
- $473 – $860
Fire risk 1/10 · Minimal
- Est. fire insurance / yr
- $691 – $1,283
Heat risk 3/10 · Minor
- Hot days now (above 91°F)
- 7 days/yr
- Hot days in 30 yrs
- 15 days/yr
Wind risk 1/10 · Minimal
- Chance of severe wind over 30 yrs
- —
Air-quality risk 4/10 · Minor
- Unhealthy air days now
- 4 days/yr
- Unhealthy air days in 30 yrs
- 9 days/yr
Risk factors via First Street. Map © Google.
Why this score? — see what drove the B+ grade
The composite is a weighted blend of 9 inputs, each scored 0–100. Each bar is that input's sub-score; the figure is the points it added to the 100-point composite (weight × sub-score).
- Cash flow +25.6/30.0
- ARV discount +15.0/15.0
- Appreciation +8.8/10.0
- DSCR +8.5/10.0
- 1% rule +5.4/10.0
- Livability +3.9/5.0
- Schools +3.3/10.0
- Condition / age +2.5/5.0
- Rent growth +2.4/5.0
$1,750,000
🖨 Deal sheet 📄 Offer letter ✓ Due diligence
Multi-family units
County records classify this as Multi-Family (5+ Unit). Listing-text estimate: 1 unit. estimate disagrees with records
5+ unit building — per-unit beds/baths from public records are typically unavailable; the breakdown below (if shown) is an estimate from the listing text.
Listing remarks MLS
INCREDIBLE OPPORTUNITY TO OWN A FULLY RENOVATED BUILDING IN THE DEMAND FIVE POINTS NEIGHBORHOOD. THE PROPERTY WAS PURCHASED BY THE CURRENT OWNERS IN 2013 AFTER HAVING BEEN VACANT FOR OVER A DECADE. AT THAT POINT THE BUILDING HAD NO FUNCTIONING MECHANICAL SYSTEMS. THE PROPERTY WENT THROUGH A 2 YEAR RENOVATION THAT REQUIRED A FULL GUT AND ALL NEW MECHANICAL SYSTEMS, PLUMBING, ELECTRICAL, HEATING, FIRE SPRINKLER, EVERYTHING. THE PROPERTY HAS BEEN FULLY LEASED SINCE. THERE ARE 7 ONE BEDROOM APARTMENTS, 4 TWO BEDROOM APARTMENTS, 1 COMMERCIAL SPACE AS WELL AS AN AT & T CELL TOWER LEASE. THERE IS SOME LAND INCLUDED ON RHODE ISLAND. THE BUILDING IS 2 SHORT BLOCKS TO THE FIVE POINTS INTERSECTION THAT IS BUSTLING WITH CAFES, RETAIL AND RESTAURANTS.
Key facts
- New plumbing
- Fire sprinkler
- New electrical
Tags
Neighborhood map
What this means for you Summary
Snapshot
- This is a 11-bed/?-bath multifamily listed at $1.75M.
Deal economics
- At list price, monthly cash flow is $4k ($50k/yr) — positive.
- The deal already cash-flows at list — no discount required.
- Meets the 1% rule at list price ($18k rent vs $1.75M).
- Recommended offer: $1.70M (3.0% below list) — sets the bar for market timing.
Location & tenants
- Location reads 77/100 on livability (#195 in NY, #3,011 nationally) — a middle-class / working-renter tenant base. Strengths: commute A+, housing A+, health & safety A+; Watch: crime F, employment D-.
- Buffalo City School District (urban): math 41% / reading 40% proficiency, ranked #535 of 590 in NY (top 91%) — families likely to look elsewhere, expect single-tenant / working-renter base with shorter leases; 75% free/reduced lunch — lower-income household profile, screen leases tightly.
- Market conditions: Rents soft (-0.5%/yr); 137 active listings in the ZIP; 1,244 units permitted in Erie County in 2024 (563 in 5+ unit buildings).
- At $18,254/mo this rent would consume 407% of the median local household income ($54k/yr) (locally 1501% of renters already pay >50% of income on rent) — very limited rent-growth headroom before tenants either downsize or default.
Forward outlook
- In year one you build about $144k of equity ($12k loan paydown + $131k appreciation (7.5% local appreciation)).
- At projected returns (7.5% appreciation + 0.0% rent growth), your $490k cash investment doubles in ~3 years — after that, you're playing with house money.
- By year 2, paydown + projected appreciation supports a ~$230k cash-out refi (75% LTV) — recoverable capital for the next deal without selling this one.
Negotiation context
- It's been on market 38 days — a 3% lower offer ($1.70M) is reasonable based on typical stale-listing flexibility.
- 2 sale attempts since 13y ago with the ask held roughly flat each time — persistent listings suggest the price (not the market) is what's stuck; bring a comps-based counter.
- Current owner paid $130k; list at $1.75M implies a 1246% gain — meaningful room to come down on a strong offer.
Risks & watch-outs
- Watch-outs: built in 1900 — expect roof / HVAC / electrical / plumbing capex.
- Climate carrying-cost: major flood risk — expect insurance premiums to compound above CPI over the hold.
Questions for the listing agent
- It's been on market 38 days. Have you received any prior offers? Is the seller open to a 3% concession, seller financing, or rate buy-down credit?
- Built in 1900 — when were the roof, HVAC, electrical panel, plumbing, and water heater last replaced?
- Is there a deadline driving the sale (1031 exchange, divorce, estate, relocation)? That informs how much negotiation room exists.
- Crime grade is F in this area — have there been break-ins, vandalism, or insurance claims at this property in the last 3 years? What carrier currently insures it and at what premium?
- What's the average days-on-market for RENTAL listings here right now (not sales)? A rising rental-DOM trend means longer vacancies and softer asking-rent achievability than the comps imply.
- What's the recent tenant-quality profile in this submarket — average credit score on applications, eviction rate, late-payment / NSF rate, and stable-employment percentage? A property-management company in the area should have these aggregated.
- How much new apartment / multifamily construction is in the pipeline within 1–3 miles? Heavy new supply (>2% of stock underway) typically softens rents 12–24 months out; light construction supports rent growth.
Investment metrics
- 1% rule
- 1.04% ✓
- Cap rate
- 9.15%
- Cash-on-cash
- 10.20%
- DSCR
- 1.45
- GRM
- 8.0
CMA / ARV
- ARV (median comp)
- $3,322,850
- List price
- $1,750,000
- Delta
- -47.33%
- Verdict
- UNDERPRICED
- Comps
- 3 within 1.0 mi
Projected returns pro-forma
7.51% appreciation · 0.0% rent growth · sell at horizon
- IRR
- 25.6%
- Equity multiple
- 2.79×
- Total profit
- $877,552
- Equity at exit
- $1,271,853
- IRR
- 22.3%
- Equity multiple
- 5.59×
- Total profit
- $2,248,967
- Equity at exit
- $2,471,515
Cash invested: $490,000 (down + closing). Projections, not guarantees.
Landlord ↔ Tenant lean methodology
- Overall (STATE)
- 15 Strongly Tenant-Friendly
- State New York
- 15 Strongly Tenant-Friendly · D+10
- County
- — inherits STATE
- City
- — inherits STATE
ZIP-level market 14213
- Home prices YoY
- 1.7%
- Rents YoY
- -0.5%
- Active inventory
- 137
- Price-to-rent
- 96.7×
Monthly cashflow live
- Estimated rent
- $18,254 high interval (Pro) →
- Mortgage (P&I)
- −$9,177
- Tax from tax record
- −$350 /mo · $4,203/yr
- Insurance
- −$729
- HOA
- −$0
- Vacancy / Maint / Mgmt
- −$3,833
- Net cashflow
- $4,164
Break-even live
12-unit breakdown (identical units grouped — click to expand)
| Units | Beds | Baths | Est. rent |
|---|---|---|---|
| 7× units | 1 | 1 | $10,556 |
| #1 | 1 | 1 | $1,508 |
| #2 | 1 | 1 | $1,508 |
| #3 | 1 | 1 | $1,508 |
| #4 | 1 | 1 | $1,508 |
| #5 | 1 | 1 | $1,508 |
| #6 | 1 | 1 | $1,508 |
| #7 | 1 | 1 | $1,508 |
| 4× units | 2 | 1 | $6,224 |
| #8 | 2 | 1 | $1,556 |
| #9 | 2 | 1 | $1,556 |
| #10 | 2 | 1 | $1,556 |
| #11 | 2 | 1 | $1,556 |
| 1× unit | 0 | 0 | $1,475 |
| Total (12 units) | $18,254 | ||
UW: 25.0% down · 7.5% · 30yr · 1.5% tax · 5.0% vac · 8.0% maint · 8.0% mgmt
Financing live
Cash to close
- Down payment
- $437,500
- Closing costs
- $52,500
- Reserves months
- —
- Total cash needed
- —
Loan-product check · same deal, 3 products live
Conventional
25% down · 7.5% · 30yr
- Down + closing
- —
- Monthly P&I
- —
- Monthly cashflow
- —
- DSCR
- —
- Eligible?
- —
Personal DTI + credit; lowest rate.
DSCR
20% down · 8.5% · 30yr
- Down + closing
- —
- Monthly P&I
- —
- Monthly cashflow
- —
- DSCR
- —
- Eligible?
- —
No personal income docs; deal must DSCR.
Hard money
10% down · 12.0% · 12mo
- Down + closing
- —
- Monthly P&I
- —
- Monthly cashflow
- —
- DSCR
- —
- Eligible?
- —
Short-term bridge; refi at stabilization.
Listing history 18 events
-
2026-06-18days on market $1,750,000 Active 38 DOM
-
2026-06-17days on market $1,750,000 Active 37 DOM
-
2026-06-16days on market $1,750,000 Active 36 DOM
-
2026-06-15days on market $1,750,000 Active 35 DOM
-
2026-06-13days on market $1,750,000 Active 33 DOM
-
2026-06-13days on market $1,750,000 Active 32 DOM
-
2026-06-10days on market $1,750,000 Active 30 DOM
-
2026-06-09days on market $1,750,000 Active 29 DOM
-
2026-06-08days on market $1,750,000 Active 28 DOM
-
2026-06-07days on market $1,750,000 Active 27 DOM
-
2026-06-03days on market $1,750,000 Active 23 DOM
-
2026-06-02days on market $1,750,000 Active 22 DOM
-
2026-06-01days on market $1,750,000 Active 21 DOM
-
2026-05-31days on market $1,750,000 Active 20 DOM
-
2026-05-11$1,750,000 Active 752-char remark
Show marketing remark (752 chars)
INCREDIBLE OPPORTUNITY TO OWN A FULLY RENOVATED BUILDING IN THE DEMAND FIVE POINTS NEIGHBORHOOD. THE PROPERTY WAS PURCHASED BY THE CURRENT OWNERS IN 2013 AFTER HAVING BEEN VACANT FOR OVER A DECADE. AT THAT POINT THE BUILDING HAD NO FUNCTIONING MECHANICAL SYSTEMS. THE PROPERTY WENT THROUGH A 2 YEAR RENOVATION THAT REQUIRED A FULL GUT AND ALL NEW MECHANICAL SYSTEMS, PLUMBING, ELECTRICAL, HEATING, FIRE SPRINKLER, EVERYTHING. THE PROPERTY HAS BEEN FULLY LEASED SINCE. THERE ARE 7 ONE BEDROOM APARTMENTS, 4 TWO BEDROOM APARTMENTS, 1 COMMERCIAL SPACE AS WELL AS AN AT & T CELL TOWER LEASE. THERE IS SOME LAND INCLUDED ON RHODE ISLAND. THE BUILDING IS 2 SHORT BLOCKS TO THE FIVE POINTS INTERSECTION THAT IS BUSTLING WITH CAFES, RETAIL AND RESTAURANTS.
-
2014-01-10soldstatus $130,000
-
2014-01-06soldstatus $130,000 420-char remark
Show marketing remark (420 chars)
Historic corner brick apartment building in Buffalo's West Side that needs complete and total renovation. Serious developers only. Building originally has storefronts on the first floor which could be opened back up. Tax record indicates 12 units, but this is a shell and is a ground up renovation. Sold "AS IS". Terrific opportunity for development on a street that is experiencing significant revitalization.
-
2013-08-27$149,900 420-char remark
Show marketing remark (420 chars)
Historic corner brick apartment building in Buffalo's West Side that needs complete and total renovation. Serious developers only. Building originally has storefronts on the first floor which could be opened back up. Tax record indicates 12 units, but this is a shell and is a ground up renovation. Sold "AS IS". Terrific opportunity for development on a street that is experiencing significant revitalization.
ⓘ Source: listings_history table (triggers on properties + properties_extension) + one-shot
backfill from property_details.listing_events for pre-trigger history.
Tax reassessment forecast NY · Partial reset (capped growth)
- Current annual tax
- $4,203 · $350/mo
- Projected year-2 tax
- $16,889 · $1,407/mo
- Expected delta
- +$12,686/yr (+$1,057/mo · 301.8%)
ⓘ Screening estimate from a state-policy table — verify with the county assessor before closing.
Climate risk First Street
- Flood 6/10 Major FEMA zone X (unshaded) · 75% chance over 30 yrs
- Wildfire 1/10 Low
- Heat 3/10 Moderate 7 d/yr ≥91°F today · 15 d/yr by 30 yrs out
- Wind 1/10 Low
- Air quality 4/10 Moderate 4 unhealthy d/yr today · 9 by 30 yrs out
Nearby sold comps map
Loading sold comps map…
Walkable amenities ~0.75 mi
Loading nearby amenities…
Taxation est. · year 1
- Rental income
- $219,048
- − Mortgage interest
- −$98,027
- − Property taxes
- −$4,203
- − Insurance
- −$8,750
- − Repairs & maintenance
- −$17,524
- − Management
- −$17,524
- − Depreciation
- −$50,909
- Taxable income
- $22,111
- Est. tax owed @ 24.0%
- −$5,307
- After-tax cash flow
- $44,662/yr
For passive investors: Depreciation is non-cash, so a rental often shows a tax loss while cash-flowing — sheltering income. Rental losses are passive: they offset passive income freely, and up to $25,000/yr can offset ordinary (W-2) income if you actively participate and your MAGI is under $100k (phasing out to $0 by $150k); unused losses carry forward. On sale, claimed depreciation is recaptured at up to 25%, and gains may owe capital-gains tax (a 1031 exchange can defer both). Figures are a year-1 estimate at your 24.0% rate — not tax advice; consult a CPA.
Schools (NCES district)
- District
- Buffalo City School District
- NCES district ID
- 3605850
- Math proficiency
- 41% ▲ 11.00%
- Reading proficiency
- 40% ▲ 7.00%
- Median HH income
- $31,665
- Composite
- 33.17/100
- National rank
- #5544
- State rank
- #535 of 590 in NY
Livability — Buffalo
- Score
- 77/100
- State rank
- #195
- US rank
- #3011
Category grades
Schools grade is shown separately in the Schools card above.
Census & demographics
- Census place
- Buffalo, NY
- County
- Erie County · 714,559 people
- City population
- 440,021
- Metro
- Buffalo-Cheektowaga, NY
- Population (ZIP)
- 24,107
- Household income
- $53,870
- Rent vs Own
- Severe rent burden
- 1501.0
Population outlook (Erie County) Hauer SSP2
- Today (2025)
- 933,037 people
- By 2030
- 935,181 · +0.2%
- By 2040
- 928,531 · -0.5%
- By 2050
- 905,725 · -2.9%
- By 2075
- 834,037 · -10.6%
- By 2100
- 708,033 · -24.1%
Race, ethnicity, and origin ACS 2023
- Neighborhood character
- Highly diverse neighborhood (Simpson 0.70)
- Race & ethnicity
- White 46% Hispanic / Latino 20% Black 18% Asian 12% Two or more races 10%
- Hispanic origin (detail)
- Mexican 1% Puerto Rican 16% Dominican 1%
- Common ancestry
- Romanian 6% Slovak 3% Lithuanian 3%
- Foreign-born
- 16% · Philippines, Canada, India
- Languages at home
- 68% English-only · Spanish 12% Other Asian/Pacific 7% Arabic 3%
Political lean MEDSL · Erie
- 2024 margin
- Lean D (+9.7) · D 54.8% · R 45.2%
- 2008→2024 swing
- -7.9pp toward R · 2008: 17.5pp · 2024: 9.7pp
- All cycles
- 2024: D+9.7 2020: D+14.7 2016: D+4.8 2012: D+15.6 2008: D+17.5
Not yet ingested
- Civics
- —
Market trends
- HPI YoY
- ▲ 7.51%
- Current HPI
- 448.4879
- Rent YoY
- ▼ -0.49%
- Metro
- Buffalo-Cheektowaga, NY
- State GDP YoY
- ▲ 2.60%
- F500 in state
- 92
Industry mix (Fortune 500 HQ in NY)
| Industry | F500 HQs | Revenue |
|---|---|---|
| Financial Services | 10 | $950B |
|
||
| Consumer Goods | 9 | $162B |
|
||
| Insurance | 4 | $225B |
|
||
| Telecommunications | 2 | $144B |
|
||
| Pharmaceuticals | 2 | $112B |
|
||
| Media / Entertainment | 2 | $69B |
|
||
Price history
+1067.4% since first listed4 events — show timeline
- 2026-05-11 Listed $1,750,000 UNYREIS
- 2014-01-10 Sold (Public Records) $130,000 Public Records
- 2014-01-06 Sold (MLS) $130,000 WNYREIS
- 2013-08-27 Listed $149,900 WNYREIS
Property tax history
+24.4%/yrLatest (2025): $4,203 · +0.0% YoY. Source: county tax records.
Cash-flow waterfall
monthlySold comps — $/sqft
last 12 mo · ≤1 miLoading sold comps…