7021 W Bucking Horse Rd · Sahuarita, AZ
Flood risk 1/10 · Minimal
- FEMA flood zone
- X (unshaded)
- Chance of flooding over 30 yrs
- 0.0%
- Est. flood insurance / yr
- $507 – $1,088
Fire risk 7/10 · Major
- Est. fire insurance / yr
- $610 – $1,132
Heat risk 7/10 · Major
- Hot days now (above 101°F)
- 8 days/yr
- Hot days in 30 yrs
- 21 days/yr
Wind risk 1/10 · Minimal
- Chance of severe wind over 30 yrs
- —
Air-quality risk 1/10 · Minimal
- Unhealthy air days now
- 0 days/yr
- Unhealthy air days in 30 yrs
- 0 days/yr
Risk factors via First Street. Map © Google.
Why this score? — see what drove the B- grade
The composite is a weighted blend of 9 inputs, each scored 0–100. Each bar is that input's sub-score; the figure is the points it added to the 100-point composite (weight × sub-score).
- Cash flow +30.0/30.0
- 1% rule +10.0/10.0
- DSCR +10.0/10.0
- ARV discount +7.5/15.0
- Schools +3.5/10.0
- Livability +3.5/5.0
- Rent growth +2.6/5.0
- Condition / age +2.5/5.0
- Appreciation +0.0/10.0
$109,900
🖨 Deal sheet 📄 Offer letter ✓ Due diligence
Listing remarks
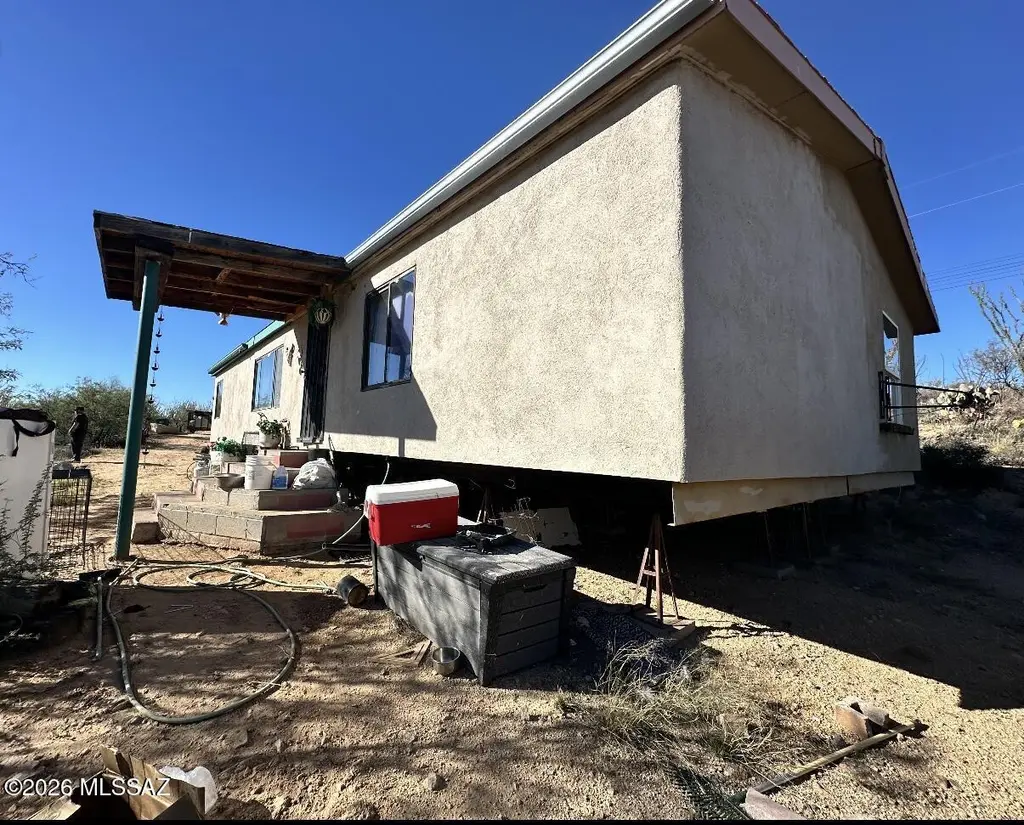
Deeply Discounted Investor Opportunity on 4.94 Acres in Sahuarita! Rare chance to secure a discounted property with major upside. 3 bed, 2 bath manufactured home (1,492 sqft) with existing utilities, septic, and hauled water. Features include mini-split system and tankless water heater. Home needs full renovation- ideal for fix & flip, rental, or land hold strategy. Private setting with wide-open desert views and no HOA. Cash or private financing only. Sold as-is. Strong value-add potential with room to expand, improve, or reposition. Don't miss this high-equity opportunity in a growing area. Significant upside with rehab.
Key facts
- Mini-split system
- Private setting
- 4.94 acres
Tags
Property features AI
Finance
- Other: Zoned Pima County - RH
Exterior
- Utilities: Septic tank
- Home design: Single-family residence; One story
- Construction: Wood frame construction
- Exterior features: Previously developed lot; Dirt roads with county maintenance
Interior
- Kitchen: Includes dishwasher, refrigerator, electric range
- Flooring: Vinyl; Laminate
- Bathrooms: 2 full bathrooms
- Heating & cooling: Mini-split heating
- Interior features: Dishwasher; Refrigerator; Electric range
- Laundry & utility: Washer
Neighborhood map
What this means for you Summary
Snapshot
- This is a 3-bed/2.0-bath manufactured listed at $110k.
Deal economics
- At list price, monthly cash flow is $991 ($12k/yr) — positive.
- The deal already cash-flows at list — no discount required.
- Meets the 1% rule at list price ($2k rent vs $110k).
- Recommended offer: $107k (3.0% below list) — sets the bar for market timing.
- Cap rate 17.1% vs local median 3.8% in Sahuarita — top-decile yield for the area; either an underpriced asset or a hidden risk that comps aren't pricing in. Stress-test before assuming the spread holds.
Location & tenants
- Location reads 69/100 on livability (#43 in AZ) — a middle-class / working-renter tenant base. Strengths: crime A+, employment A+, housing A+; Watch: amenities F, commute F, health & safety F.
- Sahuarita Unified District (4411) (town): math 32% / reading 46% proficiency, ranked #63 of 249 in AZ (top 25%) — families likely to look elsewhere, expect single-tenant / working-renter base with shorter leases.
- Zoned schools: Sopori Elementary School (math 15% / reading 15%, grade F, #871 of 1,109 statewide, top 80%, 109 students, 77% FRL); Sahuarita Middle School (math 26% / reading 43%, grade F, #65 of 218 statewide, top 30%, 579 students, 40% FRL); Walden Grove High School (math 32% / reading 32%, grade F, #104 of 381 statewide, top 28%, 1,139 students, 25% FRL) — zoned schools average 47% FRL vs 27% district-wide (20 pts higher); higher-poverty schools than district average — tighter screening recommended.
- Market conditions: Rents flat; 444 active listings in the ZIP; solid renter incomes; 5,268 units permitted in Pima County in 2024 (996 in 5+ unit buildings).
Forward outlook
- Local home prices are declining (-3.0%/yr); year-one equity from $760 of loan paydown is wiped out by about $3k of value loss. Plan a longer hold.
- Pima County population projected at +8% by 2050 — modest demand growth; plan on rents tracking national, not racing it.
- At projected returns (-3.0% appreciation + 0.3% rent growth), your $31k cash investment doubles in ~4 years — after that, you're playing with house money.
Negotiation context
- It's been on market 53 days — a 3% lower offer ($107k) is reasonable based on typical stale-listing flexibility.
- Current owner paid $65k; list at $110k implies a 69% gain — meaningful room to come down on a strong offer.
Risks & watch-outs
- Climate carrying-cost: major wildfire risk; extreme-heat days projected 8→21/yr by 2055 (HVAC capex compounding) — expect insurance premiums to compound above CPI over the hold.
Questions for the listing agent
- It's been on market 53 days. Have you received any prior offers? Is the seller open to a 3% concession, seller financing, or rate buy-down credit?
- Is there a deadline driving the sale (1031 exchange, divorce, estate, relocation)? That informs how much negotiation room exists.
- What's the average days-on-market for RENTAL listings here right now (not sales)? A rising rental-DOM trend means longer vacancies and softer asking-rent achievability than the comps imply.
- What's the recent tenant-quality profile in this submarket — average credit score on applications, eviction rate, late-payment / NSF rate, and stable-employment percentage? A property-management company in the area should have these aggregated.
- How much new for-sale + rental construction is in the pipeline within 1–3 miles? Heavy new supply typically softens prices + rents 12–24 months out; constrained supply supports both.
Investment metrics
- 1% rule
- 1.89% ✓
- Cap rate
- 17.11%
- Cash-on-cash
- 38.65%
- DSCR
- 2.72
- GRM
- 4.4
CMA / ARV
- ARV (median comp)
- $343,499
- List price
- $109,900
- Delta
- -68.01%
- Verdict
- UNDERPRICED
- Comps
- 1 within 2.0 mi
Show comp detail 3 sales within ~0.75 mi
| Address | Dist | Beds/Ba | Sqft | Sold | Price | $/sf | Match |
|---|---|---|---|---|---|---|---|
| 14894 S Avenida Red Roan Rd | 0.35mi | 3/2.0 | 1,344 (-10%) | 8mo | $318,000 | $237 | 61 |
| 14224 S Avenida Haley | 0.47mi | 3/2.0 | 1,680 (+13%) | 2mo | $185,000 | $110 | 56 |
| 6405 W Bucking Horse Rd | 0.74mi | 3/2.0 | 1,372 (-8%) | 16mo | $254,000 | $185 | 38 |
Match score weights: distance 35% · size 25% · config 20% · recency 20%. Top-matched comps best support the ARV.
Projected returns pro-forma
-3.0% appreciation · 0.31% rent growth · sell at horizon
- IRR
- 31.9%
- Equity multiple
- 2.29×
- Total profit
- $39,792
- Equity at exit
- $16,386
- IRR
- 37.5%
- Equity multiple
- 4.07×
- Total profit
- $94,470
- Equity at exit
- $9,502
Cash invested: $30,772 (down + closing). Projections, not guarantees.
Landlord ↔ Tenant lean methodology
- Overall (STATE)
- 87 Strongly Landlord-Friendly
- State Arizona
- 87 Strongly Landlord-Friendly · R+3
- County
- — inherits STATE
- City
- — inherits STATE
ZIP-level market 85629
- Home prices YoY
- -20.7%
- Rents YoY
- 0.3%
- Active inventory
- 444
- Price-to-rent
- 4.4×
Monthly cashflow live
- Estimated rent
- $2,079 medium interval (Pro) →
- Mortgage (P&I)
- −$576
- Tax from tax record
- −$30 /mo · $356/yr
- Insurance
- −$46
- HOA
- −$0
- Vacancy / Maint / Mgmt
- −$437
- Net cashflow
- $991
Break-even live
UW: 25.0% down · 7.5% · 30yr · 1.5% tax · 5.0% vac · 8.0% maint · 8.0% mgmt
Financing live
Cash to close
- Down payment
- $27,475
- Closing costs
- $3,297
- Reserves months
- —
- Total cash needed
- —
Loan-product check · same deal, 3 products live
Conventional
25% down · 7.5% · 30yr
- Down + closing
- —
- Monthly P&I
- —
- Monthly cashflow
- —
- DSCR
- —
- Eligible?
- —
Personal DTI + credit; lowest rate.
DSCR
20% down · 8.5% · 30yr
- Down + closing
- —
- Monthly P&I
- —
- Monthly cashflow
- —
- DSCR
- —
- Eligible?
- —
No personal income docs; deal must DSCR.
Hard money
10% down · 12.0% · 12mo
- Down + closing
- —
- Monthly P&I
- —
- Monthly cashflow
- —
- DSCR
- —
- Eligible?
- —
Short-term bridge; refi at stabilization.
Listing history 19 events
-
2026-06-18price $109,900 Active 53 DOM
-
2026-06-18days on market $119,900 Active 53 DOM
-
2026-06-17days on market $119,900 Active 52 DOM
-
2026-06-16days on market $119,900 Active 51 DOM
-
2026-06-15days on market $119,900 Active 50 DOM
-
2026-06-13days on market $119,900 Active 48 DOM
-
2026-06-13days on market $119,900 Active 47 DOM
-
2026-06-10days on market $119,900 Active 45 DOM
-
2026-06-09days on market $119,900 Active 44 DOM
-
2026-06-08days on market $119,900 Active 43 DOM
-
2026-06-07days on market $119,900 Active 42 DOM
-
2026-06-05days on market $119,900 Active 39 DOM
-
2026-06-03days on market $119,900 Active 38 DOM
-
2026-06-02pricedays on market $119,900 Active 37 DOM
-
2026-06-01days on market $128,900 Active 36 DOM
-
2026-05-31days on market $128,900 Active 35 DOM
-
2026-05-09price $128,900 635-char remark
-
2026-04-26$134,900 Active 635-char remark
-
2004-02-03soldstatus $65,000
ⓘ Source: listings_history table (triggers on properties + properties_extension) + one-shot
backfill from property_details.listing_events for pre-trigger history.
Tax reassessment forecast AZ · Resets to sale price
- Current annual tax
- $356 · $30/mo
- Projected year-2 tax
- $725 · $60/mo
- Expected delta
- +$370/yr (+$31/mo · 104.0%)
ⓘ Screening estimate from a state-policy table — verify with the county assessor before closing.
Climate risk First Street
- Flood 1/10 Low FEMA zone X (unshaded) · 0% chance over 30 yrs
- Wildfire 7/10 Severe
- Heat 7/10 Severe 8 d/yr ≥101°F today · 21 d/yr by 30 yrs out
- Wind 1/10 Low
- Air quality 1/10 Low 0 unhealthy d/yr today · 0 by 30 yrs out
Nearby sold comps map
Loading sold comps map…
Walkable amenities ~0.75 mi
Loading nearby amenities…
Taxation est. · year 1
- Rental income
- $24,953
- − Mortgage interest
- −$6,156
- − Property taxes
- −$356
- − Insurance
- −$550
- − Repairs & maintenance
- −$1,996
- − Management
- −$1,996
- − Depreciation
- −$3,197
- Taxable income
- $10,702
- Est. tax owed @ 24.0%
- −$2,569
- After-tax cash flow
- $9,323/yr
For passive investors: Depreciation is non-cash, so a rental often shows a tax loss while cash-flowing — sheltering income. Rental losses are passive: they offset passive income freely, and up to $25,000/yr can offset ordinary (W-2) income if you actively participate and your MAGI is under $100k (phasing out to $0 by $150k); unused losses carry forward. On sale, claimed depreciation is recaptured at up to 25%, and gains may owe capital-gains tax (a 1031 exchange can defer both). Figures are a year-1 estimate at your 24.0% rate — not tax advice; consult a CPA.
Schools (NCES district)
- District
- Sahuarita Unified District (4411)
- NCES district ID
- 0407300
- Math proficiency
- 32% ▼ -14.00%
- Reading proficiency
- 46% ▼ -7.00%
- Median HH income
- $63,564
- Composite
- 34.91/100
- National rank
- #5072
- State rank
- #63 of 249 in AZ
Livability — Sahuarita
- Score
- 69/100
- State rank
- #43
- US rank
- #8414
Category grades
Schools grade is shown separately in the Schools card above.
Census & demographics
- County
- Pima County · 1,012,107 people
- City population
- 31,668
- Metro
- Tucson, AZ
- Population (ZIP)
- 31,668
- Household income
- $109,253
- Rent vs Own
- Severe rent burden
- 220.0
Population outlook (Pima County) Hauer SSP2
- Today (2025)
- 1,066,056 people
- By 2030
- 1,086,684 · +1.9%
- By 2040
- 1,117,160 · +4.8%
- By 2050
- 1,149,778 · +7.9%
- By 2075
- 1,271,480 · +19.3%
- By 2100
- 1,321,160 · +23.9%
Race, ethnicity, and origin ACS 2023
- Neighborhood character
- Diverse neighborhood (Simpson 0.58)
- Race & ethnicity
- White 54% Hispanic / Latino 37% Two or more races 17% Black 2% Native American 2% Asian 1%
- Hispanic origin (detail)
- Mexican 33% Puerto Rican 1%
- Common ancestry
- Slovak 3% Romanian 2% Lithuanian 2%
- Foreign-born
- 9% · Canada, China
- Languages at home
- 76% English-only · Spanish 21% Other Indo-European 1% Chinese 1%
Political lean MEDSL · Pima
- 2024 margin
- D (+15.2) · D 57.0% · R 41.8% · Other 1.2%
- 2008→2024 swing
- +9.1pp toward D · 2008: 6.1pp · 2024: 15.2pp
- All cycles
- 2024: D+15.2 2020: D+18.7 2016: D+13.5 2012: D+5.8 2008: D+6.1
Not yet ingested
- Civics
- —
Market trends
- HPI YoY
- ▼ -61.38%
- Current HPI
- 234.6422
- Rent YoY
- ▲ 0.31%
- Metro
- Tucson, AZ
- State GDP YoY
- ▲ 4.54%
- F500 in state
- 20
Industry mix (Fortune 500 HQ in AZ)
| Industry | F500 HQs | Revenue |
|---|---|---|
| Technology | 2 | $13B |
|
||
| Mining / Metals | 1 | $23B |
|
||
| Environmental Services | 1 | $16B |
|
||
| Metals / Steel | 1 | $14B |
|
||
| Technology Distribution | 1 | $9B |
|
||
| Homebuilding | 1 | $8B |
|
||
Price history
+69.1% since first listed5 events — show timeline
- 2026-06-18 Price Changed $109,900 MLSSAZ
- 2026-06-02 Price Changed $119,900 MLSSAZ
- 2026-05-09 Price Changed $128,900 MLSSAZ
- 2026-04-26 Listed $134,900 MLSSAZ
- 2004-02-03 Sold (Public Records) $65,000 Public Records
Property tax history
-3.5%/yrLatest (2025): $356 · +5.2% YoY. Source: county tax records.
Cash-flow waterfall
monthlySold comps — $/sqft
last 12 mo · ≤1 miLoading sold comps…