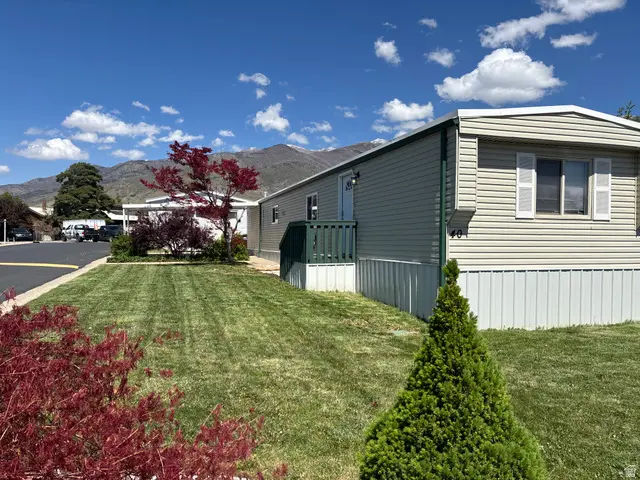
975 E 1175 S #40 · Fruit Heights, UT
Flood risk 1/10 · Minimal
- FEMA flood zone
- X (unshaded)
- Chance of flooding over 30 yrs
- 0.0%
- Est. flood insurance / yr
- $507 – $1,088
Fire risk 6/10 · Moderate
- Est. fire insurance / yr
- $453 – $841
Heat risk 4/10 · Minor
- Hot days now (above 95°F)
- 7 days/yr
- Hot days in 30 yrs
- 19 days/yr
Wind risk 1/10 · Minimal
- Chance of severe wind over 30 yrs
- —
Air-quality risk 3/10 · Minor
- Unhealthy air days now
- 3 days/yr
- Unhealthy air days in 30 yrs
- 4 days/yr
Risk factors via First Street. Map © Google.
Why this score? — see what drove the B grade
The composite is a weighted blend of 9 inputs, each scored 0–100. Each bar is that input's sub-score; the figure is the points it added to the 100-point composite (weight × sub-score).
- Cash flow +30.0/30.0
- 1% rule +10.0/10.0
- DSCR +10.0/10.0
- ARV discount +7.5/15.0
- Schools +4.1/10.0
- Livability +3.8/5.0
- Rent growth +2.5/5.0
- Condition / age +2.5/5.0
- Appreciation +0.0/10.0
$48,000
🖨 Deal sheet (PDF) 📄 Offer letter ✓ Due diligence
Listing remarks MLS
There are no remarks available.
Key facts
- Outdoor recreation
- Covered carport
- Covered patio
Tags
Property features AI
Finance
- HOA & community: Association pays sewer, trash and water; Association provides management and allows pets
Exterior
- Parking: Covered, secured parking; Two total parking spaces; Two covered/carport spaces; Has carport
- Security: Secured parking
- Utilities: Natural gas connected; Electricity connected; Sewer connected; Culinary water and pressurized irrigation connected
- Home design: Manufactured home; Faces west; Residential use
- Construction: Aluminum construction materials; Membrane roof; Built/standing condition
- Exterior features: Awning(s); Double-pane windows; Foyer entry; Outbuildings; Covered patio; Open porch; Partially fenced yard; Paved road access; Manual full sprinkler system; Mountain view; Landscaping; Vegetable garden; Secured parking
Interior
- Kitchen: Updated kitchen; Free-standing range/oven; Garbage disposal
- Bedrooms: Two main-level bedrooms; Primary bedroom on the first floor
- Flooring: Carpet; Linoleum; Tile
- Bathrooms: One full bathroom; One three-quarter bathroom
- Heating & cooling: Electric forced-air heating; Evaporative cooling
- Interior features: Dry bar; Walk-in closet; Garbage disposal; Updated kitchen; Free-standing range/oven
Neighborhood map
What this means for you Summary
Snapshot
- This is a 2-bed/2.0-bath manufactured listed at $48k.
Deal economics
- At list price, monthly cash flow is $1k ($14k/yr) — positive.
- The deal already cash-flows at list — no discount required.
- Meets the 1% rule at list price ($2k rent vs $48k).
- Recommended offer: $47k (1.5% below list) — sets the bar for market timing.
Location & tenants
- Location reads 76/100 on livability (#54 in UT, #3,272 nationally) — a middle-class / working-renter tenant base. Strengths: crime A+, commute A+, employment A+; Watch: amenities F, cost of living F, health & safety F.
- Davis District (suburban): math 43% / reading 47% proficiency, ranked #28 of 80 in UT (top 35%) — families likely to look elsewhere, expect single-tenant / working-renter base with shorter leases; only 19% free/reduced lunch — higher-income household profile.
- Zoned schools: H C Burton School (math 61% / reading 60%, grade B-, #49 of 585 statewide, top 9%, 671 students, 10% FRL); Kaysville Jr High (math 76% / reading 52%, grade B+, #3 of 138 statewide, top 1%, 965 students, 11% FRL); Davis High (math 51% / reading 60%, grade C, #17 of 171 statewide, top 9%, 2,175 students, 8% FRL).
- Zoned-school proficiency averages 60% at this address vs 45% district-wide (+15 pts) — the actual schools serving this property are materially stronger than the Davis District average implies; a family-tenant draw the district grade alone would hide.
- Market conditions: 194 active listings in the ZIP; 4 comparable units currently listed for rent nearby; rentals at typical pace (median 25d on market — plan ~3-4 weeks tenant-placement turnaround); high-income renter base; 1,461 units permitted in Davis County in 2024 (508 in 5+ unit buildings).
- This rent is only 17% of the median local income ($134k/yr) — well below the 30% rent-burden line; pricing power to push rent on renewal without tenant pushback.
Forward outlook
- Local home prices are declining (-3.0%/yr); year-one equity from $332 of loan paydown is wiped out by about $1k of value loss. Plan a longer hold.
- Davis County population projected at +39% by 2050 — long-run rental-demand tailwind backs the buy-and-hold thesis.
- At projected returns (-3.0% appreciation + 3.0% rent growth), your $13k cash investment doubles in ~2 years — after that, you're playing with house money.
Negotiation context
- It's been on market 19 days — a 2% lower offer ($47k) is reasonable based on typical stale-listing flexibility.
- 4 sale attempts since 27y ago; this cycle's ask has dropped $12k (20%) from the opening price — seller is motivated, your offer sets the floor, not the list.
Risks & watch-outs
- Climate carrying-cost: major wildfire risk — expect insurance premiums to compound above CPI over the hold.
Questions for the listing agent
- Is there a deadline driving the sale (1031 exchange, divorce, estate, relocation)? That informs how much negotiation room exists.
- Schools are B-rated — typically a magnet for longer-tenancy family renters. What's the average tenant stay here, and is there a school-zone premium baked into asking?
- What's the average days-on-market for RENTAL listings here right now (not sales)? A rising rental-DOM trend means longer vacancies and softer asking-rent achievability than the comps imply.
- What's the recent tenant-quality profile in this submarket — average credit score on applications, eviction rate, late-payment / NSF rate, and stable-employment percentage? A property-management company in the area should have these aggregated.
- How much new for-sale + rental construction is in the pipeline within 1–3 miles? Heavy new supply typically softens prices + rents 12–24 months out; constrained supply supports both.
Investment metrics
- 1% rule
- 3.98% ✓
- Cap rate
- 35.70%
- Cash-on-cash
- 105.02%
- DSCR
- 5.67
- GRM
- 2.1
CMA / ARV
No comps found within radius.
Projected returns pro-forma
-3.0% appreciation · 3.0% rent growth · sell at horizon
- IRR
- —
- Equity multiple
- 6.00×
- Total profit
- $67,167
- Equity at exit
- $7,157
- IRR
- —
- Equity multiple
- 12.54×
- Total profit
- $155,072
- Equity at exit
- $4,150
Cash invested: $13,440 (down + closing). Projections, not guarantees.
Landlord ↔ Tenant lean methodology
- Overall (STATE)
- 86 Strongly Landlord-Friendly
- State Utah
- 86 Strongly Landlord-Friendly · R+15
- County
- — inherits STATE
- City
- — inherits STATE
ZIP-level market 84037
- Active inventory
- 194
- Price-to-rent
- 2.1×
Monthly cashflow live
- Estimated rent
- $1,909 medium interval (Pro) →
- Mortgage (P&I)
- −$252
- Tax est. 1.5%
- −$60 /mo · $720/yr
- Insurance
- −$20
- HOA
- −$0
- Vacancy / Maint / Mgmt
- −$401
- Net cashflow
- $1,176
Break-even live
Sensitivity live
| Price | -10% $1,209 | -5% $1,193 | +0% $1,176 | +5% $1,160 | +10% $1,143 |
|---|---|---|---|---|---|
| Rent | -10% $1,025 | -5% $1,101 | +0% $1,176 | +5% $1,252 | +10% $1,327 |
| Rate | -1.0pp $1,200 | -0.5pp $1,188 | base $1,176 | +0.5pp $1,164 | +1.0pp $1,151 |
UW: 25.0% down · 7.5% · 30yr · 1.5% tax · 5.0% vac · 8.0% maint · 8.0% mgmt
Financing live
Cash to close
- Down payment
- $12,000
- Closing costs
- $1,440
- Reserves months
- —
- Total cash needed
- —
Loan-product check · same deal, 3 products live
Conventional
25% down · 7.5% · 30yr
- Down + closing
- —
- Monthly P&I
- —
- Monthly cashflow
- —
- DSCR
- —
- Eligible?
- —
Personal DTI + credit; lowest rate.
DSCR
20% down · 8.5% · 30yr
- Down + closing
- —
- Monthly P&I
- —
- Monthly cashflow
- —
- DSCR
- —
- Eligible?
- —
No personal income docs; deal must DSCR.
Hard money
10% down · 12.0% · 12mo
- Down + closing
- —
- Monthly P&I
- —
- Monthly cashflow
- —
- DSCR
- —
- Eligible?
- —
Short-term bridge; refi at stabilization.
Rent comps 4 comps
| Address | Beds | Baths | Sqft | Rent | $/sqft | DOM | Units | Dist |
|---|---|---|---|---|---|---|---|---|
| 1099 Shepard Ln Farmington, UT | 3.0 | 2.0 | 1500 | $2,250 | $1.50 | 24d | 1 | 1.08mi |
| 1091 Shepard Ln #1099 Farmington, UT | 3.0 | 2.0 | 1500 | $2,250 | $1.50 | 24d | 1 | 1.09mi |
| 719 E 100 S Kaysville, UT | 3.0 | 1.0 | 1275 | $1,350 | $1.06 | 24d | 1 | 1.26mi |
| 311 Flour Mill Dr Kaysville, UT | 2.0 | 1.0 | 1200 | $1,500 | $1.25 | 24d | 1 | 1.45mi |
Listing history 14 events
-
2026-06-21days on market $48,000 Active 19 DOM
-
2026-06-18days on market $48,000 Active 16 DOM
-
2026-06-17days on market $48,000 Active 15 DOM
-
2026-06-16days on market $48,000 Active 14 DOM
-
2026-06-15days on market $48,000 Active 13 DOM
-
2026-06-14days on market $48,000 Active 11 DOM
-
2026-06-13pricedays on market $48,000 Active 10 DOM
-
2026-06-10days on market $59,900 Active 8 DOM
-
2026-06-09days on market $59,900 Active 7 DOM
-
2026-06-08days on market $59,900 Active 6 DOM
-
2026-06-07days on market $59,900 Active 5 DOM
-
2026-06-05days on market $59,900 Active 2 DOM
-
2026-06-03remarks 699-char remark
-
2026-06-03$59,900 Active 1 DOM
ⓘ Source: listings_history table (triggers on properties + properties_extension) + one-shot
backfill from property_details.listing_events for pre-trigger history.
Climate risk First Street
- Flood 1/10 Low FEMA zone X (unshaded) · 0% chance over 30 yrs
- Wildfire 6/10 Major
- Heat 4/10 Moderate 7 d/yr ≥95°F today · 19 d/yr by 30 yrs out
- Wind 1/10 Low
- Air quality 3/10 Moderate 3 unhealthy d/yr today · 4 by 30 yrs out
Nearby sold comps map
Loading sold comps map…
Walkable amenities ~0.75 mi
Loading nearby amenities…
Taxation est. · year 1
- Rental income
- $22,906
- − Mortgage interest
- −$2,689
- − Property taxes
- −$720
- − Insurance
- −$240
- − Repairs & maintenance
- −$1,832
- − Management
- −$1,832
- − Depreciation
- −$1,396
- Taxable income
- $14,196
- Est. tax owed @ 24.0%
- −$3,407
- After-tax cash flow
- $10,708/yr
For passive investors: Depreciation is non-cash, so a rental often shows a tax loss while cash-flowing — sheltering income. Rental losses are passive: they offset passive income freely, and up to $25,000/yr can offset ordinary (W-2) income if you actively participate and your MAGI is under $100k (phasing out to $0 by $150k); unused losses carry forward. On sale, claimed depreciation is recaptured at up to 25%, and gains may owe capital-gains tax (a 1031 exchange can defer both). Figures are a year-1 estimate at your 24.0% rate — not tax advice; consult a CPA.
Schools (NCES district)
- District
- Davis District
- NCES district ID
- 4900210
- Math proficiency
- 43% ▼ -9.00%
- Reading proficiency
- 47% ▼ -5.00%
- Median HH income
- $70,511
- Composite
- 40.59/100
- National rank
- #3698
- State rank
- #28 of 80 in UT
Livability — Fruit Heights
- Score
- 76/100
- State rank
- #54
- US rank
- #3272
Category grades
Schools grade is shown separately in the Schools card above.
Census & demographics
- Census place
- Fruit Heights, UT
- County
- Davis County · 341,755 people
- Metro
- Ogden-Clearfield, UT
- Population (ZIP)
- 39,415
- Household income
- $134,375
- Rent vs Own
- Severe rent burden
- 67.0
Population outlook (Davis County) Hauer SSP2
- Today (2025)
- 399,271 people
- By 2030
- 430,528 · +7.8%
- By 2040
- 493,485 · +23.6%
- By 2050
- 555,187 · +39.1%
- By 2075
- 688,589 · +72.5%
- By 2100
- 769,646 · +92.8%
Race, ethnicity, and origin ACS 2023
- Neighborhood character
- Predominantly White (89%)
- Race & ethnicity
- White 89% Two or more races 7% Hispanic / Latino 5% Asian 1%
- Hispanic origin (detail)
- Mexican 3%
- Common ancestry
- Italian 5% Slovak 4% Iranian 2%
- Foreign-born
- 3% · Canada, China
- Languages at home
- 93% English-only · Spanish 4% Chinese 1%
Political lean MEDSL · Davis
- 2024 margin
- Strong R (+24.9) · D 36.0% · R 60.8% · Other 3.2%
- 2008→2024 swing
- +17.4pp toward D · 2008: -42.3pp · 2024: -24.9pp
- All cycles
- 2024: R+24.9 2020: R+27.5 2016: R+23.3 2012: R+61.8 2008: R+42.3
Not yet ingested
- Civics
- —
Market trends
- HPI YoY
- ▼ -326.72%
- Current HPI
- 307.5433
- Rent YoY
- —
- Metro
- Ogden-Clearfield, UT
- State GDP YoY
- ▲ 3.54%
- F500 in state
- 2
Industry mix (Fortune 500 HQ in UT)
| Industry | F500 HQs | Revenue |
|---|---|---|
| Financial Services | 1 | $3B |
|
||
Price history
+8.9% since first listed20 events — show timeline
- 2026-06-02 Listed $59,900 WFRMLS
- 2025-06-13 Sold (MLS) — WFRMLS
- 2025-04-22 Pending — WFRMLS
- 2025-04-15 Price Changed $39,900 WFRMLS
- 2025-03-29 Price Changed $49,900 WFRMLS
- 2025-02-10 Price Changed $54,900 WFRMLS
- 2025-01-25 Price Changed $59,900 WFRMLS
- 2024-12-14 Price Changed $64,900 WFRMLS
- 2024-11-04 Listed $69,900 WFRMLS
- 2024-10-18 Listing Removed — WFRMLS
- 2024-10-02 Price Changed $74,500 WFRMLS
- 2024-09-09 Price Changed $79,500 WFRMLS
- 2024-08-19 Price Changed $84,900 WFRMLS
- 2024-08-12 Price Changed $87,500 WFRMLS
- 2024-08-06 Price Changed $92,500 WFRMLS
- 2024-07-31 Price Changed $95,900 WFRMLS
- 2024-07-20 Price Changed $98,900 WFRMLS
- 2024-07-09 Listed $105,000 WFRMLS
- 1999-09-14 Sold (MLS) — WFRMLS
- 1999-05-28 Listed $55,000 WFRMLS
Cash-flow waterfall
monthlySold comps — $/sqft
last 12 mo · ≤1 miLoading sold comps…