11473 Holiday Shores Dr · Bismarck, MO
Flood risk 1/10 · Minimal
- FEMA flood zone
- X (unshaded)
- Chance of flooding over 30 yrs
- 0.0%
- Est. flood insurance / yr
- $507 – $1,088
Fire risk 3/10 · Minor
- Est. fire insurance / yr
- $1,054 – $1,958
Heat risk 4/10 · Minor
- Hot days now (above 104°F)
- 7 days/yr
- Hot days in 30 yrs
- 20 days/yr
Wind risk 2/10 · Minimal
- Chance of severe wind over 30 yrs
- 1.0%
Air-quality risk 2/10 · Minimal
- Unhealthy air days now
- 0 days/yr
- Unhealthy air days in 30 yrs
- 1 days/yr
Risk factors via First Street. Map © Google.
Why this score? — see what drove the B+ grade
The composite is a weighted blend of 9 inputs, each scored 0–100. Each bar is that input's sub-score; the figure is the points it added to the 100-point composite (weight × sub-score).
- Cash flow +30.0/30.0
- 1% rule +10.0/10.0
- DSCR +10.0/10.0
- Appreciation +10.0/10.0
- ARV discount +7.5/15.0
- Schools +2.9/10.0
- Livability +2.9/5.0
- Rent growth +2.5/5.0
- Condition / age +2.5/5.0
$52,500
🖨 Deal sheet 📄 Offer letter ✓ Due diligence
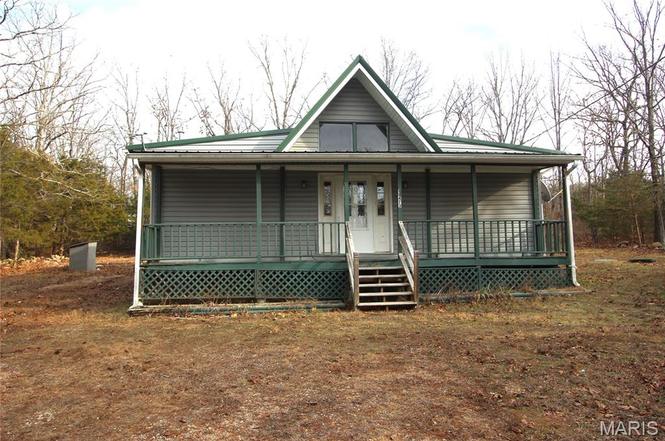
Listing remarks
Charming 2 bed, 1 bath home located in a lake community. Features a detached garage and multiple sheds for extra storage. Perfect as a full-time residence or weekend getaway—schedule your showing today!
Key facts
- Multiple sheds
- Lake community
- Extra storage
Tags
Neighborhood map
What this means for you Summary
Snapshot
- This is a 2-bed/1.0-bath other listed at $52k.
Deal economics
- At list price, monthly cash flow is $344 ($4k/yr) — positive.
- The deal already cash-flows at list — no discount required.
- Meets the 1% rule at list price ($874 rent vs $52k).
- Recommended offer: $48k (9.0% below list) — sets the bar for market timing.
Location & tenants
- Location reads 58/100 on livability (#583 in MO) — a working-class tenant base; expect higher turnover. Strengths: cost of living A+, housing A+, crime B+; Watch: amenities F, commute F, employment D-.
- Valley R-VI (rural): math 28% / reading 41% proficiency, ranked #230 of 324 in MO (top 71%) — families likely to look elsewhere, expect single-tenant / working-renter base with shorter leases.
- Zoned schools: Caledonia Elem. (math 37% / reading 42%, grade F, #537 of 1,115 statewide, top 53%, 165 students, 52% FRL); Valley High (math 22% / reading 37%, grade F, #382 of 521 statewide, top 78%, 183 students, 41% FRL) — zoned schools at 47% FRL track the district average.
- Market conditions: 23 active listings in the ZIP.
Forward outlook
- In year one you build about $6k of equity ($363 loan paydown + $5k appreciation (10.0% local appreciation)).
- Washington County population projected at -21% by 2050 — secular population decline; favor cash flow + early exit over multi-decade hold.
- At projected returns (10.0% appreciation + 3.0% rent growth), your $15k cash investment doubles in ~2 years — after that, you're playing with house money.
- By year 6, paydown + projected appreciation supports a ~$33k cash-out refi (75% LTV) — recoverable capital for the next deal without selling this one.
Negotiation context
- It's been on market 117 days — a 9% lower offer ($48k) is reasonable based on typical stale-listing flexibility.
Questions for the listing agent
- It's been on market 117 days. Have you received any prior offers? Is the seller open to a 9% concession, seller financing, or rate buy-down credit?
- Built in 1972 — when were the roof, HVAC, electrical panel, plumbing, and water heater last replaced?
- What does the HOA fee cover, when was the last increase, and are there any pending special assessments or reserve-fund shortfalls?
- Why hasn't it sold? Are there any deal-killer items the seller is aware of (foundation, flood, title, zoning, code violations)?
- Is there a deadline driving the sale (1031 exchange, divorce, estate, relocation)? That informs how much negotiation room exists.
- Schools are F-rated, which usually means shorter tenancies and higher turnover. Who's the typical renter profile here, and what's been the actual vacancy rate?
- What's the average days-on-market for RENTAL listings here right now (not sales)? A rising rental-DOM trend means longer vacancies and softer asking-rent achievability than the comps imply.
- What's the recent tenant-quality profile in this submarket — average credit score on applications, eviction rate, late-payment / NSF rate, and stable-employment percentage? A property-management company in the area should have these aggregated.
- How much new for-sale + rental construction is in the pipeline within 1–3 miles? Heavy new supply typically softens prices + rents 12–24 months out; constrained supply supports both.
Investment metrics
- 1% rule
- 1.66% ✓
- Cap rate
- 14.17%
- Cash-on-cash
- 28.12%
- DSCR
- 2.25
- GRM
- 5.0
CMA / ARV
No comps found within radius.
Projected returns pro-forma
10.0% appreciation · 3.0% rent growth · sell at horizon
- IRR
- 45.6%
- Equity multiple
- 4.44×
- Total profit
- $50,536
- Equity at exit
- $47,296
- IRR
- 39.5%
- Equity multiple
- 9.95×
- Total profit
- $131,572
- Equity at exit
- $101,996
Cash invested: $14,700 (down + closing). Projections, not guarantees.
Landlord ↔ Tenant lean methodology
- Overall (STATE)
- 81 Strongly Landlord-Friendly
- State Missouri
- 81 Strongly Landlord-Friendly · R+10
- County
- — inherits STATE
- City
- — inherits STATE
ZIP-level market 63624
- Home prices YoY
- 23.8%
- Active inventory
- 23
- Price-to-rent
- 5.0×
Monthly cashflow live
- Estimated rent
- $874 medium interval (Pro) →
- Mortgage (P&I)
- −$275
- Tax from tax record
- −$32 /mo · $381/yr
- Insurance
- −$22
- HOA
- −$17
- Vacancy / Maint / Mgmt
- −$184
- Net cashflow
- $344
Break-even live
UW: 25.0% down · 7.5% · 30yr · 1.5% tax · 5.0% vac · 8.0% maint · 8.0% mgmt
Financing live
Cash to close
- Down payment
- $13,125
- Closing costs
- $1,575
- Reserves months
- —
- Total cash needed
- —
Loan-product check · same deal, 3 products live
Conventional
25% down · 7.5% · 30yr
- Down + closing
- —
- Monthly P&I
- —
- Monthly cashflow
- —
- DSCR
- —
- Eligible?
- —
Personal DTI + credit; lowest rate.
DSCR
20% down · 8.5% · 30yr
- Down + closing
- —
- Monthly P&I
- —
- Monthly cashflow
- —
- DSCR
- —
- Eligible?
- —
No personal income docs; deal must DSCR.
Hard money
10% down · 12.0% · 12mo
- Down + closing
- —
- Monthly P&I
- —
- Monthly cashflow
- —
- DSCR
- —
- Eligible?
- —
Short-term bridge; refi at stabilization.
HOA detail
- Monthly dues
- $17 · $204/yr
Listing history 6 events
-
2026-04-21status Pending
-
2026-03-18price $52,500
-
2026-02-15price $63,100
-
2026-01-24price $67,000
-
2025-12-25$74,900 Active
-
2022-05-27soldstatus $50,000
ⓘ Source: listings_history table (triggers on properties + properties_extension) + one-shot
backfill from property_details.listing_events for pre-trigger history.
Tax reassessment forecast MO · Resets to sale price
- Current annual tax
- $381 · $32/mo
- Projected year-2 tax
- $509 · $42/mo
- Expected delta
- +$129/yr (+$11/mo · 33.8%)
ⓘ Screening estimate from a state-policy table — verify with the county assessor before closing.
Climate risk First Street
- Flood 1/10 Low FEMA zone X (unshaded) · 0% chance over 30 yrs
- Wildfire 3/10 Moderate
- Heat 4/10 Moderate 7 d/yr ≥104°F today · 20 d/yr by 30 yrs out
- Wind 2/10 Low 100% chance of damaging wind over 30 yrs
- Air quality 2/10 Low 0 unhealthy d/yr today · 1 by 30 yrs out
Nearby sold comps map
Loading sold comps map…
Walkable amenities ~0.75 mi
Loading nearby amenities…
Taxation est. · year 1
- Rental income
- $10,487
- − Mortgage interest
- −$2,941
- − Property taxes
- −$381
- − Insurance
- −$262
- − Repairs & maintenance
- −$839
- − Management
- −$839
- − HOA
- −$204
- − Depreciation
- −$1,527
- Taxable income
- $3,494
- Est. tax owed @ 24.0%
- −$839
- After-tax cash flow
- $3,295/yr
For passive investors: Depreciation is non-cash, so a rental often shows a tax loss while cash-flowing — sheltering income. Rental losses are passive: they offset passive income freely, and up to $25,000/yr can offset ordinary (W-2) income if you actively participate and your MAGI is under $100k (phasing out to $0 by $150k); unused losses carry forward. On sale, claimed depreciation is recaptured at up to 25%, and gains may owe capital-gains tax (a 1031 exchange can defer both). Figures are a year-1 estimate at your 24.0% rate — not tax advice; consult a CPA.
Schools (NCES district)
- District
- Valley R-VI
- NCES district ID
- 2930720
- Math proficiency
- 28% ▼ -2.00%
- Reading proficiency
- 41% ▼ -8.00%
- Median HH income
- $40,678
- Composite
- 29.0/100
- National rank
- #6616
- State rank
- #230 of 324 in MO
Livability — Bismarck
- Score
- 58/100
- State rank
- #583
- US rank
- #20759
Category grades
Schools grade is shown separately in the Schools card above.
Census & demographics
- Population (ZIP)
- 3,507
Population outlook (Washington County) Hauer SSP2
- Today (2025)
- 23,761 people
- By 2030
- 22,923 · -3.5%
- By 2040
- 20,992 · -11.7%
- By 2050
- 18,849 · -20.7%
- By 2075
- 13,749 · -42.1%
- By 2100
- 9,016 · -62.1%
Race, ethnicity, and origin ACS 2023
- Neighborhood character
- Predominantly White (90%)
- Race & ethnicity
- White 90% Two or more races 5% Native American 3% Hispanic / Latino 2%
- Common ancestry
- Slovak 5% Lithuanian 4% Italian 2%
- Foreign-born
- 2% · Canada, Jamaica
- Languages at home
- 99% English-only · German/W. Germanic 1%
Political lean MEDSL · Washington
- 2024 margin
- Solid R (+65.2) · D 17.1% · R 82.3%
- 2008→2024 swing
- -65.3pp toward R · 2008: 0.1pp · 2024: -65.2pp
- All cycles
- 2024: R+65.2 2020: R+62.6 2016: R+55.2 2012: R+18.6 2008: D+0.1
Not yet ingested
- Civics
- —
Market trends
- HPI YoY
- ▲ 61.65%
- Current HPI
- 320.8335
- Rent YoY
- —
- Metro
- —
- State GDP YoY
- ▲ 1.84%
- F500 in state
- 20
Industry mix (Fortune 500 HQ in MO)
| Industry | F500 HQs | Revenue |
|---|---|---|
| Healthcare | 1 | $163B |
|
||
| Insurance | 1 | $21B |
|
||
| Industrial Technology | 1 | $17B |
|
||
| Retail | 1 | $16B |
|
||
| Industrial Distribution | 1 | $10B |
|
||
| Utilities | 1 | $9B |
|
||
Price history
+5.0% since first listed6 events — show timeline
- 2026-04-21 Pending — MARIS as Distributed by MLS Grid
- 2026-03-18 Price Changed $52,500 MARIS as Distributed by MLS Grid
- 2026-02-15 Price Changed $63,100 MARIS as Distributed by MLS Grid
- 2026-01-24 Price Changed $67,000 MARIS as Distributed by MLS Grid
- 2025-12-25 Listed $74,900 MARIS as Distributed by MLS Grid
- 2022-05-27 Sold (Public Records) $50,000 Public Records
Property tax history
+3.7%/yrLatest (2025): $381 · +10.0% YoY. Source: county tax records.
Cash-flow waterfall
monthlySold comps — $/sqft
last 12 mo · ≤1 miLoading sold comps…