17775 Machs Way · Cottonwood, CA
Flood risk 1/10 · Minimal
- FEMA flood zone
- X (unshaded)
- Chance of flooding over 30 yrs
- 0.0%
- Est. flood insurance / yr
- $507 – $1,088
Fire risk 10/10 · Severe
- Est. fire insurance / yr
- $659 – $1,223
Heat risk 8/10 · Major
- Hot days now (above 104°F)
- 7 days/yr
- Hot days in 30 yrs
- 14 days/yr
Wind risk 1/10 · Minimal
- Chance of severe wind over 30 yrs
- —
Air-quality risk 10/10 · Severe
- Unhealthy air days now
- 34 days/yr
- Unhealthy air days in 30 yrs
- 37 days/yr
Risk factors via First Street. Map © Google.
Why this score? — see what drove the B- grade
The composite is a weighted blend of 9 inputs, each scored 0–100. Each bar is that input's sub-score; the figure is the points it added to the 100-point composite (weight × sub-score).
- Cash flow +30.0/30.0
- 1% rule +10.0/10.0
- DSCR +10.0/10.0
- ARV discount +7.5/15.0
- Schools +3.5/10.0
- Livability +3.1/5.0
- Rent growth +2.5/5.0
- Condition / age +2.5/5.0
- Appreciation +0.0/10.0
$70,000
🖨 Deal sheet 📄 Offer letter ✓ Due diligence
Listing remarks MLS
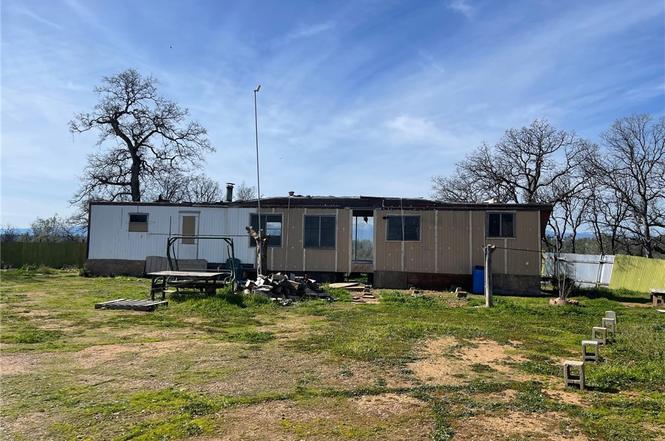
Views that you have to come see. 11 Acres of property. for you to enjoy. Privacy at the end of the road. Mobile Home on property will need work, not livable in its current condition.
Key facts
- Over 11 acres
- Great view
- 11.12 acre lot
Tags
Property features AI
Finance
- Other: No accessory dwelling unit (ADU) on the property; No common walls (detached); Zoning: R1-A-MH-B:435
- Financial info: Assessments: Unknown; Total units: 1
- HOA & community: Rural community
Exterior
- Utilities: Well water; Septic (type unknown)
- Home design: Manufactured house; Single-story
- Construction: Year built sourced from assessor
- Exterior features: Patio; Down slope from street; Has a view
Interior
- Bedrooms: 2 bedrooms on the main level
- Bathrooms: 1 full bathroom
- Interior features: One-level layout; Gate entry; Has a wood-burning fireplace; Main floor bedroom(s)
- Laundry & utility: No laundry hookups listed
Neighborhood map
What this means for you Summary
Snapshot
- This is a 2-bed/1.0-bath manufactured listed at $70k.
Deal economics
- At list price, monthly cash flow is $863 ($10k/yr) — positive.
- The deal already cash-flows at list — no discount required.
- Meets the 1% rule at list price ($2k rent vs $70k).
- Recommended offer: $62k (12.0% below list) — sets the bar for market timing.
- Cap rate 21.1% vs local median 3.0% in Cottonwood — top-decile yield for the area; either an underpriced asset or a hidden risk that comps aren't pricing in. Stress-test before assuming the spread holds.
Location & tenants
- Location reads 62/100 on livability (#476 in CA) — a middle-class / working-renter tenant base. Strengths: housing A+, employment B+; Watch: schools D+, crime D, amenities F.
- Evergreen Union (rural): math 33% / reading 49% proficiency, ranked #226 of 517 in CA (top 44%) — families likely to look elsewhere, expect single-tenant / working-renter base with shorter leases.
- Market conditions: 272 active listings in the ZIP; 186 units permitted in Tehama County in 2024 (0 in 5+ unit buildings).
Forward outlook
- Local home prices are declining (-3.0%/yr); year-one equity from $484 of loan paydown is wiped out by about $2k of value loss. Plan a longer hold.
- Tehama County population projected at -14% by 2050 — secular population decline; favor cash flow + early exit over multi-decade hold.
- At projected returns (-3.0% appreciation + 3.0% rent growth), your $20k cash investment doubles in ~3 years — after that, you're playing with house money.
Negotiation context
- It's been on market 738 days — a 12% lower offer ($62k) is reasonable based on typical stale-listing flexibility.
- 5 sale attempts since 7y ago; this cycle's ask has dropped $29k (29%) from the opening price — seller is motivated, your offer sets the floor, not the list.
Risks & watch-outs
- Climate carrying-cost: severe wildfire risk; extreme-heat days projected 7→14/yr by 2055 (HVAC capex compounding) — expect insurance premiums to compound above CPI over the hold.
Questions for the listing agent
- It's been on market 738 days. Have you received any prior offers? Is the seller open to a 12% concession, seller financing, or rate buy-down credit?
- Built in 1969 — when were the roof, HVAC, electrical panel, plumbing, and water heater last replaced?
- Why hasn't it sold? Are there any deal-killer items the seller is aware of (foundation, flood, title, zoning, code violations)?
- Is there a deadline driving the sale (1031 exchange, divorce, estate, relocation)? That informs how much negotiation room exists.
- Schools are D-rated, which usually means shorter tenancies and higher turnover. Who's the typical renter profile here, and what's been the actual vacancy rate?
- Crime grade is D in this area — have there been break-ins, vandalism, or insurance claims at this property in the last 3 years? What carrier currently insures it and at what premium?
- What's the average days-on-market for RENTAL listings here right now (not sales)? A rising rental-DOM trend means longer vacancies and softer asking-rent achievability than the comps imply.
- What's the recent tenant-quality profile in this submarket — average credit score on applications, eviction rate, late-payment / NSF rate, and stable-employment percentage? A property-management company in the area should have these aggregated.
- How much new for-sale + rental construction is in the pipeline within 1–3 miles? Heavy new supply typically softens prices + rents 12–24 months out; constrained supply supports both.
Investment metrics
- 1% rule
- 2.30% ✓
- Cap rate
- 21.09%
- Cash-on-cash
- 52.83%
- DSCR
- 3.35
- GRM
- 3.6
CMA / ARV
No comps found within radius.
Projected returns pro-forma
-3.0% appreciation · 3.0% rent growth · sell at horizon
- IRR
- 50.8%
- Equity multiple
- 3.22×
- Total profit
- $43,593
- Equity at exit
- $10,437
- IRR
- 56.2%
- Equity multiple
- 6.54×
- Total profit
- $108,636
- Equity at exit
- $6,052
Cash invested: $19,600 (down + closing). Projections, not guarantees.
Landlord ↔ Tenant lean methodology
- Overall (STATE)
- 18 Strongly Tenant-Friendly
- State California
- 18 Strongly Tenant-Friendly · D+13
- County
- — inherits STATE
- City
- — inherits STATE
ZIP-level market 96022
- Home prices YoY
- -12.9%
- Active inventory
- 272
- Price-to-rent
- 3.6×
Monthly cashflow live
- Estimated rent
- $1,609 medium interval (Pro) →
- Mortgage (P&I)
- −$367
- Tax from tax record
- −$12 /mo · $141/yr
- Insurance
- −$29
- HOA
- −$0
- Vacancy / Maint / Mgmt
- −$338
- Net cashflow
- $863
Break-even live
UW: 25.0% down · 7.5% · 30yr · 1.5% tax · 5.0% vac · 8.0% maint · 8.0% mgmt
Financing live
Cash to close
- Down payment
- $17,500
- Closing costs
- $2,100
- Reserves months
- —
- Total cash needed
- —
Loan-product check · same deal, 3 products live
Conventional
25% down · 7.5% · 30yr
- Down + closing
- —
- Monthly P&I
- —
- Monthly cashflow
- —
- DSCR
- —
- Eligible?
- —
Personal DTI + credit; lowest rate.
DSCR
20% down · 8.5% · 30yr
- Down + closing
- —
- Monthly P&I
- —
- Monthly cashflow
- —
- DSCR
- —
- Eligible?
- —
No personal income docs; deal must DSCR.
Hard money
10% down · 12.0% · 12mo
- Down + closing
- —
- Monthly P&I
- —
- Monthly cashflow
- —
- DSCR
- —
- Eligible?
- —
Short-term bridge; refi at stabilization.
Listing history 27 events
-
2026-06-19days on market $70,000 Active 738 DOM
-
2026-06-18days on market $70,000 Active 737 DOM
-
2026-06-17days on market $70,000 Active 736 DOM
-
2026-06-16days on market $70,000 Active 735 DOM
-
2026-06-15days on market $70,000 Active 734 DOM
-
2026-06-14days on market $70,000 Active 732 DOM
-
2026-06-12days on market $70,000 Active 731 DOM
-
2026-06-09days on market $70,000 Active 728 DOM
-
2026-06-08days on market $70,000 Active 727 DOM
-
2026-06-07days on market $70,000 Active 726 DOM
-
2026-06-05days on market $70,000 Active 723 DOM
-
2026-06-03days on market $70,000 Active 722 DOM
-
2026-06-02days on market $70,000 Active 721 DOM
-
2026-06-01days on market $70,000 Active 720 DOM
-
2026-05-31days on market $70,000 Active 719 DOM
-
2026-05-30days on market $70,000 Active 718 DOM
-
2026-03-23price $70,000
-
2025-11-13status Active
-
2025-11-12status Pending Sale
-
2025-10-21price $80,000
-
2024-06-18status Active
-
2024-06-07status Pending Sale
-
2024-05-30$99,000 Active
-
2020-01-07soldstatus $78,000 182-char remark
Show marketing remark (371 chars)
Horse property. 11 Acres with home site setting above over looking the property and the valley. Great view of the mountains surrounding or valley. Must see to understand the scope of Views. Call me let me show you what I am talking about 530-209-3324 Michael Conley (Conley Real Estate). Mobile on property will need major rehab or replaced. Mobile currently not livable.
-
2020-01-07soldstatus $87,000 371-char remark
Show marketing remark (371 chars)
Horse property. 11 Acres with home site setting above over looking the property and the valley. Great view of the mountains surrounding or valley. Must see to understand the scope of Views. Call me let me show you what I am talking about 530-209-3324 Michael Conley (Conley Real Estate). Mobile on property will need major rehab or replaced. Mobile currently not livable.
-
2019-03-03$89,900 371-char remark
Show marketing remark (182 chars)
Views that you have to come see. 11 Acres of property. for you to enjoy. Privacy at the end of the road. Mobile Home on property will need work, not livable in its current condition.
-
2019-03-03$93,000 182-char remark
Show marketing remark (182 chars)
Views that you have to come see. 11 Acres of property. for you to enjoy. Privacy at the end of the road. Mobile Home on property will need work, not livable in its current condition.
ⓘ Source: listings_history table (triggers on properties + properties_extension) + one-shot
backfill from property_details.listing_events for pre-trigger history.
Tax reassessment forecast CA · Resets to sale price
- Current annual tax
- $141 · $12/mo
- Projected year-2 tax
- $532 · $44/mo
- Expected delta
- +$391/yr (+$33/mo · 278.5%)
ⓘ Screening estimate from a state-policy table — verify with the county assessor before closing.
Climate risk First Street
- Flood 1/10 Low FEMA zone X (unshaded) · 0% chance over 30 yrs
- Wildfire 10/10 Extreme
- Heat 8/10 Severe 7 d/yr ≥104°F today · 14 d/yr by 30 yrs out
- Wind 1/10 Low
- Air quality 10/10 Extreme 34 unhealthy d/yr today · 37 by 30 yrs out
Nearby sold comps map
Loading sold comps map…
Walkable amenities ~0.75 mi
Loading nearby amenities…
Taxation est. · year 1
- Rental income
- $19,304
- − Mortgage interest
- −$3,921
- − Property taxes
- −$141
- − Insurance
- −$350
- − Repairs & maintenance
- −$1,544
- − Management
- −$1,544
- − Depreciation
- −$2,036
- Taxable income
- $9,768
- Est. tax owed @ 24.0%
- −$2,344
- After-tax cash flow
- $8,010/yr
For passive investors: Depreciation is non-cash, so a rental often shows a tax loss while cash-flowing — sheltering income. Rental losses are passive: they offset passive income freely, and up to $25,000/yr can offset ordinary (W-2) income if you actively participate and your MAGI is under $100k (phasing out to $0 by $150k); unused losses carry forward. On sale, claimed depreciation is recaptured at up to 25%, and gains may owe capital-gains tax (a 1031 exchange can defer both). Figures are a year-1 estimate at your 24.0% rate — not tax advice; consult a CPA.
Schools (NCES district)
- District
- Evergreen Union
- NCES district ID
- 0613170
- Math proficiency
- 33% ▼ -8.00%
- Reading proficiency
- 49% ▼ -3.00%
- Median HH income
- $49,783
- Composite
- 35.24/100
- National rank
- #4978
- State rank
- #226 of 517 in CA
Livability — Cottonwood
- Score
- 62/100
- State rank
- #476
- US rank
- #16162
Category grades
Schools grade is shown separately in the Schools card above.
Census & demographics
- Population (ZIP)
- 16,497
Population outlook (Tehama County) Hauer SSP2
- Today (2025)
- 61,058 people
- By 2030
- 59,493 · -2.6%
- By 2040
- 56,076 · -8.2%
- By 2050
- 52,372 · -14.2%
- By 2075
- 43,895 · -28.1%
- By 2100
- 34,186 · -44.0%
Race, ethnicity, and origin ACS 2023
- Neighborhood character
- Predominantly White (77%)
- Race & ethnicity
- White 77% Hispanic / Latino 11% Two or more races 11% Asian 3% Native American 1%
- Hispanic origin (detail)
- Mexican 8%
- Common ancestry
- Lithuanian 5% Slovak 4% Portuguese 3%
- Foreign-born
- 4% · Canada, China
- Languages at home
- 92% English-only · Spanish 3% Other Indo-European 2% Other Asian/Pacific 1%
Political lean MEDSL · Tehama
- 2024 margin
- Solid R (+41.8) · D 27.9% · R 69.7% · Other 2.3%
- 2008→2024 swing
- -17.7pp toward R · 2008: -24.1pp · 2024: -41.8pp
- All cycles
- 2024: R+41.8 2020: R+35.6 2016: R+36.8 2012: R+27.4 2008: R+24.1
Not yet ingested
- Civics
- —
Market trends
- HPI YoY
- ▼ -54.22%
- Current HPI
- 364.3174
- Rent YoY
- —
- Metro
- —
- State GDP YoY
- ▲ 3.21%
- F500 in state
- 116
Industry mix (Fortune 500 HQ in CA)
| Industry | F500 HQs | Revenue |
|---|---|---|
| Technology | 27 | $1,492B |
|
||
| Financial Services | 3 | $174B |
|
||
| Retail | 3 | $44B |
|
||
| Insurance | 3 | $26B |
|
||
| Media / Entertainment | 2 | $115B |
|
||
| Pharmaceuticals / Biotech | 2 | $62B |
|
||
Price history
-24.7% since first listed11 events — show timeline
- 2026-03-23 Price Changed $70,000 CRMLS
- 2025-11-13 Relisted — CRMLS
- 2025-11-12 Pending — CRMLS
- 2025-10-21 Price Changed $80,000 CRMLS
- 2024-06-18 Relisted — CRMLS
- 2024-06-07 Pending — CRMLS
- 2024-05-30 Listed $99,000 CRMLS
- 2020-01-07 Sold (MLS) $87,000 TCAOR
- 2020-01-07 Sold (MLS) $78,000 SAOR
- 2019-03-03 Listed $89,900 TCAOR
- 2019-03-03 Listed $93,000 SAOR
Property tax history
+5.0%/yrLatest (2025): $141 · +2.0% YoY. Source: county tax records.
Cash-flow waterfall
monthlySold comps — $/sqft
last 12 mo · ≤1 miLoading sold comps…