 17-Plex
1002 Geer Rd · Turlock, CA
Flood risk 5/10 · Moderate
- FEMA flood zone
- X (unshaded)
- Chance of flooding over 30 yrs
- 0.64%
- Est. flood insurance / yr
- $507 – $1,088
Fire risk 1/10 · Minimal
- Est. fire insurance / yr
- $659 – $1,223
Heat risk 7/10 · Major
- Hot days now (above 102°F)
- 7 days/yr
- Hot days in 30 yrs
- 16 days/yr
Wind risk 1/10 · Minimal
- Chance of severe wind over 30 yrs
- —
Air-quality risk 10/10 · Severe
- Unhealthy air days now
- 42 days/yr
- Unhealthy air days in 30 yrs
- 43 days/yr
Risk factors via First Street. Map © Google.
Why this score? — see what drove the D+ grade
The composite is a weighted blend of 9 inputs, each scored 0–100. Each bar is that input's sub-score; the figure is the points it added to the 100-point composite (weight × sub-score).
- Cash flow +19.2/30.0
- ARV discount +7.5/15.0
- DSCR +6.0/10.0
- 1% rule +4.1/10.0
- Livability +3.3/5.0
- Rent growth +2.8/5.0
- Schools +2.7/10.0
- Condition / age +2.5/5.0
- Appreciation +0.0/10.0
$2,995,000
🖨 Deal sheet 📄 Offer letter ✓ Due diligence
Multi-family units
County records classify this as Multi-Family (5+ Unit). Listing-text estimate: 17 units. confirmed
5+ unit building — per-unit beds/baths from public records are typically unavailable; the breakdown below (if shown) is an estimate from the listing text.
Listing remarks
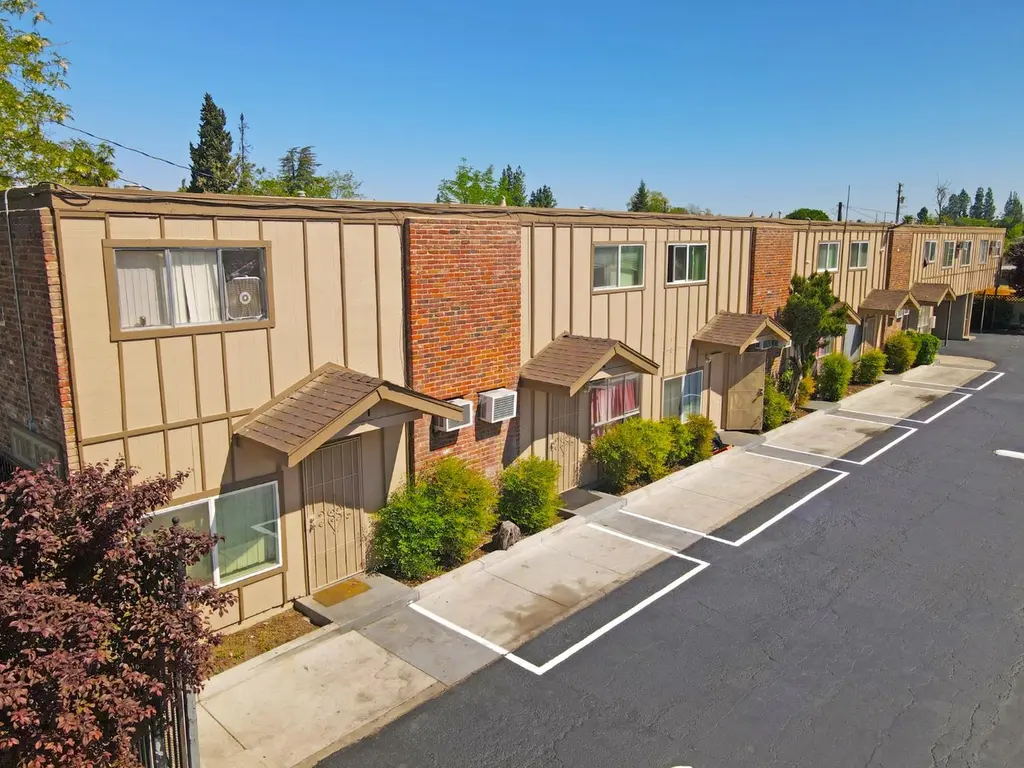
The Bee Apartments offer a 17-unit multifamily investment located at 1002 Geer Road in Turlock. The property features a wide unit mix, ranging from a 260 SF Studio to a spacious 4-BD, 2.5-BA unit (1,669 SF), with the majority made up of large 1,065 SF 2-BD, 1.5-BA Townhomes. The property has been recently renovated, giving investors a clean, stabilized asset with strong in-place income and limited near-term capital needs. The updated condition helps drive tenant demand while supporting long-term retention. Located just minutes from Downtown Turlock, residents enjoy easy access to local dining, retail, and major drivers like California State University, Stanislaus and Highway 99.
Key facts
- Wide unit mix
- Recently renovated
- 0.5 acre lot
Tags
Property features AI
Finance
- Financial info: Residential income property with 17 total units
- HOA & community: No homeowners association
Exterior
- Parking: Total parking for 17 vehicles
- Utilities: Cable connected; Natural gas connected; Public sewer; Water meter on site; Irrigation: see remarks
- Home design: Residential income property (apartments); 5 or more units; Two stories; Built in 1940; Address: 1002 Geer Rd, Turlock, CA
- Construction: Year built 1940
- Exterior features: Half-acre lot (approx. 0.5 acre)
Interior
- Bedrooms: Unit example: 4 bedrooms
- Flooring: Tile; Vinyl
- Bathrooms: Unit example: 2 full baths, 1 partial bath
- Heating & cooling: Wall furnace; Ceiling fan(s); Wall unit(s)
- Interior features: Ceiling fans; Wall units (cooling); Wall furnace heating; Tile flooring; Vinyl flooring; Two-story building
- Laundry & utility: Laundry: Other (on-site)
Neighborhood map
What this means for you Summary
Snapshot
- This is a 17 × 2-bed/1.5-bath units multifamily listed at $3.00M.
Deal economics
- At list price, monthly cash flow is $3k ($39k/yr) — positive. Per door: $189/mo.
- The deal already cash-flows at list — no discount required.
- To meet the 1% rule (rent ≥ 1% of price), the offer needs to be $2.72M (9.1% below list).
- Recommended offer: $2.72M (9.1% below list) — sets the bar for 1% rule.
- Cap rate 7.6% vs local median 3.1% in Turlock — top-decile yield for the area; either an underpriced asset or a hidden risk that comps aren't pricing in. Stress-test before assuming the spread holds.
Location & tenants
- Location reads 66/100 on livability (#353 in CA) — a middle-class / working-renter tenant base. Strengths: housing A, health & safety A-, commute B; Watch: amenities D, schools F, crime D-.
- Turlock Unified (suburban): math 23% / reading 38% proficiency, ranked #334 of 517 in CA (top 65%) — families likely to look elsewhere, expect single-tenant / working-renter base with shorter leases.
- Market conditions: Rents rising (+1.3%/yr); 130 active listings in the ZIP; 11 comparable units currently listed for rent nearby; rentals at typical pace (median 21d on market — plan ~3-4 weeks tenant-placement turnaround); 923 units permitted in Stanislaus County in 2024 (63 in 5+ unit buildings).
- At $27,232/mo this rent would consume 438% of the median local household income ($75k/yr) (locally 1545% of renters already pay >50% of income on rent) — very limited rent-growth headroom before tenants either downsize or default.
Forward outlook
- Local home prices are declining (-3.0%/yr); year-one equity from $21k of loan paydown is wiped out by about $90k of value loss. Plan a longer hold.
- Stanislaus County population projected at +14% by 2050 — modest demand growth; plan on rents tracking national, not racing it.
Negotiation context
- It's been on market 29 days — a 2% lower offer ($2.95M) is reasonable based on typical stale-listing flexibility.
- Current owner paid $1.30M; list at $3.00M implies a 130% gain — meaningful room to come down on a strong offer.
Risks & watch-outs
- Watch-outs: built in 1940 — expect roof / HVAC / electrical / plumbing capex.
- Climate carrying-cost: moderate flood risk; extreme-heat days projected 7→16/yr by 2055 (HVAC capex compounding) — expect insurance premiums to compound above CPI over the hold.
Questions for the listing agent
- Can we see the unit-by-unit rent roll, current vacancy, and any below-market leases? What's the average tenancy length?
- What capital expenditures (roof, boiler, parking lot, exteriors) have been made in the last 5 years, and what's planned in the next 2?
- Built in 1940 — when were the roof, HVAC, electrical panel, plumbing, and water heater last replaced?
- Is there a deadline driving the sale (1031 exchange, divorce, estate, relocation)? That informs how much negotiation room exists.
- Schools are F-rated, which usually means shorter tenancies and higher turnover. Who's the typical renter profile here, and what's been the actual vacancy rate?
- Crime grade is D in this area — have there been break-ins, vandalism, or insurance claims at this property in the last 3 years? What carrier currently insures it and at what premium?
- The area grade is low — what's the realistic commute time and amenity access for the typical tenant pool here? Any planned neighborhood developments (good or bad) we should know about?
- What's the average days-on-market for RENTAL listings here right now (not sales)? A rising rental-DOM trend means longer vacancies and softer asking-rent achievability than the comps imply.
- What's the recent tenant-quality profile in this submarket — average credit score on applications, eviction rate, late-payment / NSF rate, and stable-employment percentage? A property-management company in the area should have these aggregated.
- How much new apartment / multifamily construction is in the pipeline within 1–3 miles? Heavy new supply (>2% of stock underway) typically softens rents 12–24 months out; light construction supports rent growth.
Investment metrics
- 1% rule
- 0.91% ✗
- Cap rate
- 7.58%
- Cash-on-cash
- 4.60%
- DSCR
- 1.20
- GRM
- 9.2
CMA / ARV
- ARV (on-the-fly)
- $725,994
- Comps found
- 2
Show comp detail 2 sales within ~0.75 mi
| Address | Dist | Beds/Ba | Sqft | Sold | Price | $/sf | Match |
|---|---|---|---|---|---|---|---|
| 177 Almond Ave | 0.16mi | 3/2.0 (-1) | 1,415 (-7%) | 9mo | $675,000 | $477 | 65 |
| 426 Flower St | 0.58mi | 4/2.0 | 1,742 (+14%) | 12mo | $450,000 | $258 | 35 |
Match score weights: distance 35% · size 25% · config 20% · recency 20%. Top-matched comps best support the ARV.
Projected returns pro-forma
-3.0% appreciation · 1.27% rent growth · sell at horizon
- IRR
- -10.9%
- Equity multiple
- 0.61×
- Total profit
- $-328,351
- Equity at exit
- $446,564
- IRR
- -4.1%
- Equity multiple
- 0.75×
- Total profit
- $-211,431
- Equity at exit
- $258,953
Cash invested: $838,600 (down + closing). Projections, not guarantees.
Landlord ↔ Tenant lean methodology
- Overall (STATE)
- 18 Strongly Tenant-Friendly
- State California
- 18 Strongly Tenant-Friendly · D+13
- County
- — inherits STATE
- City
- — inherits STATE
ZIP-level market 95380
- Rents YoY
- 1.3%
- Active inventory
- 130
- Price-to-rent
- 155.8×
Monthly cashflow live
- Estimated rent
- $27,232 high interval (Pro) →
- Mortgage (P&I)
- −$15,706
- Tax from tax record
- −$1,346 /mo · $16,156/yr
- Insurance
- −$1,248
- HOA
- −$0
- Vacancy / Maint / Mgmt
- −$5,719
- Net cashflow
- $3,213
Break-even live
17-unit breakdown (identical units grouped — click to expand)
| Units | Beds | Baths | Est. rent |
|---|---|---|---|
| 17× units | 2 | 1.5 | $27,234 |
| #1 | 2 | 1.5 | $1,602 |
| #2 | 2 | 1.5 | $1,602 |
| #3 | 2 | 1.5 | $1,602 |
| #4 | 2 | 1.5 | $1,602 |
| #5 | 2 | 1.5 | $1,602 |
| #6 | 2 | 1.5 | $1,602 |
| #7 | 2 | 1.5 | $1,602 |
| #8 | 2 | 1.5 | $1,602 |
| #9 | 2 | 1.5 | $1,602 |
| #10 | 2 | 1.5 | $1,602 |
| #11 | 2 | 1.5 | $1,602 |
| #12 | 2 | 1.5 | $1,602 |
| #13 | 2 | 1.5 | $1,602 |
| #14 | 2 | 1.5 | $1,602 |
| #15 | 2 | 1.5 | $1,602 |
| #16 | 2 | 1.5 | $1,602 |
| #17 | 2 | 1.5 | $1,602 |
| Total (17 units) | $27,232 | ||
UW: 25.0% down · 7.5% · 30yr · 1.5% tax · 5.0% vac · 8.0% maint · 8.0% mgmt
Financing live
Cash to close
- Down payment
- $748,750
- Closing costs
- $89,850
- Reserves months
- —
- Total cash needed
- —
Loan-product check · same deal, 3 products live
Conventional
25% down · 7.5% · 30yr
- Down + closing
- —
- Monthly P&I
- —
- Monthly cashflow
- —
- DSCR
- —
- Eligible?
- —
Personal DTI + credit; lowest rate.
DSCR
20% down · 8.5% · 30yr
- Down + closing
- —
- Monthly P&I
- —
- Monthly cashflow
- —
- DSCR
- —
- Eligible?
- —
No personal income docs; deal must DSCR.
Hard money
10% down · 12.0% · 12mo
- Down + closing
- —
- Monthly P&I
- —
- Monthly cashflow
- —
- DSCR
- —
- Eligible?
- —
Short-term bridge; refi at stabilization.
Rent comps 11 comps
| Address | Beds | Baths | Sqft | Rent | $/sqft | DOM | Units | Dist |
|---|---|---|---|---|---|---|---|---|
| 1020 Stonridge Dr Turlock, CA | 3.0 | 3.0 | 1678 | $2,375 | $1.42 | 21d | 1 | 0.71mi |
| 455 Vassar Ave Turlock, CA | 4.0 | 2.0 | 1838 | $2,500 | $1.36 | 13d | 1 | 0.79mi |
| 1193 East Ave Turlock, CA | 3.0 | 1.0 | 1206 | $2,150 | $1.78 | 13d | 1 | 0.87mi |
| 475 Georgetown Ave Turlock, CA | 3.0 | 2.0 | 1204 | $2,350 | $1.95 | 21d | 1 | 1.14mi |
| 731 Vermont Ave Turlock, CA | 3.0 | 1.0 | 1238 | $1,750 | $1.41 | 13d | 1 | 1.14mi |
| 1020 W Minnesota Ave Turlock, CA | 3.0 | 2.0 | 1691 | $2,600 | $1.54 | 21d | 1 | 1.15mi |
| 1700 N Tully Rd Turlock, CA | 1.0–3.0 | 1.0–2.0 | 892 | $2,065 | $2.31 | 13d | 1 | 1.21mi |
| 1055 Vermont Ave Turlock, CA | 3.0 | 2.0 | 1283 | $2,000 | $1.56 | 43d | 1 | 1.24mi |
| 630 Newcomb Ave Turlock, CA | 3.0 | 2.0 | 1961 | $2,095 | $1.07 | 43d | 1 | 1.38mi |
| 1133 S Minaret Ave Turlock, CA | 3.0 | 2.0 | 1117 | $2,350 | $2.10 | 43d | 1 | 1.40mi |
| 1020 W Monte Vista Ave Turlock, CA | 3.0 | 2.0 | 1691 | $2,600 | $1.54 | 21d | 1 | 1.48mi |
Listing history 2 events
-
2017-03-15soldstatus $1,300,000
-
2000-03-31soldstatus $340,000
ⓘ Source: listings_history table (triggers on properties + properties_extension) + one-shot
backfill from property_details.listing_events for pre-trigger history.
Tax reassessment forecast CA · Resets to sale price
- Current annual tax
- $16,156 · $1,346/mo
- Projected year-2 tax
- $22,762 · $1,897/mo
- Expected delta
- +$6,606/yr (+$550/mo · 40.9%)
ⓘ Screening estimate from a state-policy table — verify with the county assessor before closing.
Climate risk First Street
- Flood 5/10 Major FEMA zone X (unshaded) · 64% chance over 30 yrs
- Wildfire 1/10 Low
- Heat 7/10 Severe 7 d/yr ≥102°F today · 16 d/yr by 30 yrs out
- Wind 1/10 Low
- Air quality 10/10 Extreme 42 unhealthy d/yr today · 43 by 30 yrs out
Nearby sold comps map
Loading sold comps map…
Walkable amenities ~0.75 mi
Loading nearby amenities…
Taxation est. · year 1
- Rental income
- $326,784
- − Mortgage interest
- −$167,767
- − Property taxes
- −$16,156
- − Insurance
- −$14,975
- − Repairs & maintenance
- −$26,143
- − Management
- −$26,143
- − Depreciation
- −$87,127
- Taxable loss
- −$11,527
- Est. tax savings @ 24.0%
- +$2,766
- After-tax cash flow
- $41,321/yr
For passive investors: Depreciation is non-cash, so a rental often shows a tax loss while cash-flowing — sheltering income. Rental losses are passive: they offset passive income freely, and up to $25,000/yr can offset ordinary (W-2) income if you actively participate and your MAGI is under $100k (phasing out to $0 by $150k); unused losses carry forward. On sale, claimed depreciation is recaptured at up to 25%, and gains may owe capital-gains tax (a 1031 exchange can defer both). Figures are a year-1 estimate at your 24.0% rate — not tax advice; consult a CPA.
Schools (NCES district)
- District
- Turlock Unified
- NCES district ID
- 0600158
- Math proficiency
- 23% ▼ -8.00%
- Reading proficiency
- 38% ▼ -7.00%
- Median HH income
- $50,249
- Composite
- 26.58/100
- National rank
- #7184
- State rank
- #334 of 517 in CA
Livability — Turlock
- Score
- 66/100
- State rank
- #353
- US rank
- #11971
Category grades
Schools grade is shown separately in the Schools card above.
Census & demographics
- Census place
- Turlock, CA
- County
- Stanislaus County · 445,786 people
- City population
- 83,043
- Metro
- Modesto, CA
- Population (ZIP)
- 43,960
- Household income
- $74,534
- Rent vs Own
- Severe rent burden
- 1545.0
Population outlook (Stanislaus County) Hauer SSP2
- Today (2025)
- 579,493 people
- By 2030
- 598,000 · +3.2%
- By 2040
- 630,930 · +8.9%
- By 2050
- 658,300 · +13.6%
- By 2075
- 712,363 · +22.9%
- By 2100
- 719,805 · +24.2%
Race, ethnicity, and origin ACS 2023
- Neighborhood character
- Diverse neighborhood (Simpson 0.57)
- Race & ethnicity
- Hispanic / Latino 54% White 36% Two or more races 14% Asian 4% Black 1%
- Hispanic origin (detail)
- Mexican 51%
- Common ancestry
- Russian 8% Italian 1% Portuguese 1%
- Foreign-born
- 22% · Canada
- Languages at home
- 52% English-only · Spanish 39% Other Indo-European 7%
Political lean MEDSL · Stanislaus
- 2024 margin
- R (+11.0) · D 43.2% · R 54.2% · Other 2.6%
- 2008→2024 swing
- -12.7pp toward R · 2008: 1.7pp · 2024: -11.0pp
- All cycles
- 2024: R+11.0 2020: D+0.8 2016: D+0.6 2012: D+0.7 2008: D+1.7
Not yet ingested
- Civics
- —
Market trends
- HPI YoY
- ▼ -614.27%
- Current HPI
- 307.7264
- Rent YoY
- ▲ 1.27%
- Metro
- Modesto, CA
- State GDP YoY
- ▲ 3.21%
- F500 in state
- 116
Industry mix (Fortune 500 HQ in CA)
| Industry | F500 HQs | Revenue |
|---|---|---|
| Technology | 27 | $1,492B |
|
||
| Financial Services | 3 | $174B |
|
||
| Retail | 3 | $44B |
|
||
| Insurance | 3 | $26B |
|
||
| Media / Entertainment | 2 | $115B |
|
||
| Pharmaceuticals / Biotech | 2 | $62B |
|
||
Price history
+282.4% since first listed2 events — show timeline
- 2017-03-15 Sold (Public Records) $1,300,000 Public Records
- 2000-03-31 Sold (Public Records) $340,000 Public Records
Property tax history
+7.6%/yrLatest (2025): $16,156 · +1.8% YoY. Source: county tax records.
Cash-flow waterfall
monthlySold comps — $/sqft
last 12 mo · ≤1 miLoading sold comps…