409559 E 1080 Rd · Checotah, OK
Flood risk 1/10 · Minimal
- FEMA flood zone
- X (unshaded)
- Chance of flooding over 30 yrs
- 0.0%
- Est. flood insurance / yr
- $507 – $1,088
Fire risk 6/10 · Moderate
- Est. fire insurance / yr
- $2,463 – $4,575
Heat risk 6/10 · Moderate
- Hot days now (above 111°F)
- 7 days/yr
- Hot days in 30 yrs
- 19 days/yr
Wind risk 3/10 · Minor
- Chance of severe wind over 30 yrs
- 6.0%
Air-quality risk 2/10 · Minimal
- Unhealthy air days now
- 1 days/yr
- Unhealthy air days in 30 yrs
- 2 days/yr
Risk factors via First Street. Map © Google.
Why this score? — see what drove the C- grade
The composite is a weighted blend of 9 inputs, each scored 0–100. Each bar is that input's sub-score; the figure is the points it added to the 100-point composite (weight × sub-score).
- Cash flow +15.7/30.0
- Appreciation +10.0/10.0
- ARV discount +7.5/15.0
- DSCR +4.8/10.0
- 1% rule +3.1/10.0
- Livability +3.0/5.0
- Rent growth +2.5/5.0
- Schools +2.5/10.0
- Condition / age +2.5/5.0
$143,500
🖨 Deal sheet 📄 Offer letter ✓ Due diligence
Listing remarks MLS
Sold at time of listing. Listed for statistical purpose only.
Key facts
- Horse shelter
- Double carport
- Storm shelter
Tags
Property features AI
Exterior
- Parking: Detached garage; 2 garage spaces; Carport; Additional storage in parking area
- Security: Storm shelter; Smoke detectors
- Utilities: Electricity available; Natural gas available; Fiber optic available; Cable available; Phone available; Water available (rural); Septic tank
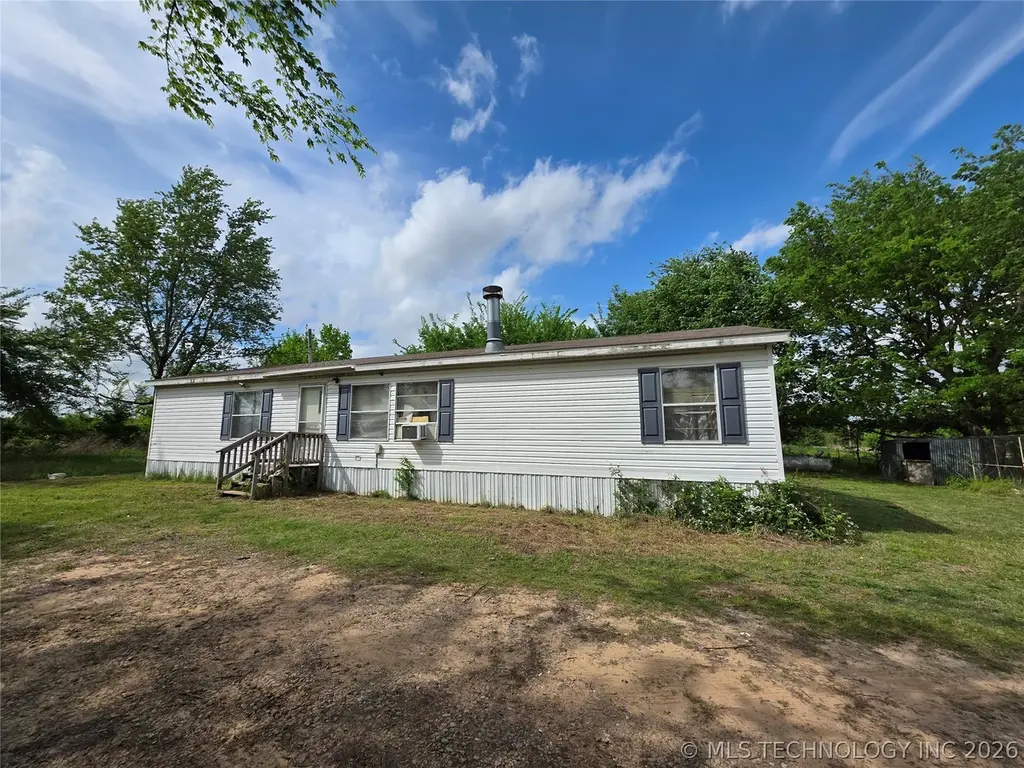
- Home design: Manufactured double wide home; Single-story; Entry on first level
- Construction: Aluminum siding; Asphalt/fiberglass roof; Crawlspace foundation with permanent tie-downs
- Exterior features: Dirt driveway; Shed(s) and additional storage; Barbed wire, chain link, cross fenced and partial fencing; Property faces south; Farm/ranch setting with mature trees and fruit trees; Less than 1 mile to Eufaula Lake; Horses allowed
Interior
- Kitchen: Island; Gas range connection; Gas oven connection; Oven; Range; Dishwasher; Refrigerator
- Bedrooms: Master bedroom with private bath and walk-in closet (First floor); Bedrooms with walk-in closets (First floor); Additional bedroom (First floor)
- Flooring: Carpet; Laminate
- Bathrooms: Master bath with separate shower, bathtub, double sink, vent (First floor); Hall full bathroom with bathtub and vent (First floor); Total of 2 full bathrooms
- Heating & cooling: Central heating; Propane heating; Window cooling units
- Interior features: Vaulted ceilings; Ceiling fan(s); Laminate counters; High speed internet available; Storm windows
- Laundry & utility: Inside utility room (First floor); Washer; Washer hookup; Electric dryer hookup
Neighborhood map
What this means for you Summary
Snapshot
- This is a 3-bed/2.0-bath manufactured listed at $144k.
Deal economics
- At list price, monthly cash flow is $63 ($753/yr) — positive.
- The deal already cash-flows at list — no discount required.
- To meet the 1% rule (rent ≥ 1% of price), the offer needs to be $116k (18.9% below list).
- Recommended offer: $116k (18.9% below list) — sets the bar for 1% rule.
- Cap rate 6.8% vs local median 3.8% in Checotah — top-decile yield for the area; either an underpriced asset or a hidden risk that comps aren't pricing in. Stress-test before assuming the spread holds.
Location & tenants
- Location reads 60/100 on livability (#328 in OK) — a middle-class / working-renter tenant base. Strengths: cost of living A+, housing A-, crime B; Watch: health & safety C-, schools F, amenities F.
- Checotah (town): math 32% / reading 28% proficiency, ranked #72 of 270 in OK (top 27%) — families likely to look elsewhere, expect single-tenant / working-renter base with shorter leases; 72% free/reduced lunch — lower-income household profile, screen leases tightly.
- Market conditions: 147 active listings in the ZIP; 20 units permitted in McIntosh County in 2024 (0 in 5+ unit buildings).
Forward outlook
- In year one you build about $15k of equity ($992 loan paydown + $14k appreciation (10.0% local appreciation)).
- McIntosh County population projected at -17% by 2050 — secular population decline; favor cash flow + early exit over multi-decade hold.
- At projected returns (10.0% appreciation + 3.0% rent growth), your $40k cash investment doubles in ~3 years — after that, you're playing with house money.
- By year 3, paydown + projected appreciation supports a ~$39k cash-out refi (75% LTV) — recoverable capital for the next deal without selling this one.
Negotiation context
- It's been on market 56 days — a 3% lower offer ($139k) is reasonable based on typical stale-listing flexibility.
- 2 sale attempts since 10y ago with the ask held roughly flat each time — persistent listings suggest the price (not the market) is what's stuck; bring a comps-based counter.
- Current owner paid $65k; list at $144k implies a 121% gain — meaningful room to come down on a strong offer.
Risks & watch-outs
- Climate carrying-cost: major wildfire risk; extreme-heat days projected 7→19/yr by 2055 (HVAC capex compounding) — expect insurance premiums to compound above CPI over the hold.
Questions for the listing agent
- It's been on market 56 days. Have you received any prior offers? Is the seller open to a 19% concession, seller financing, or rate buy-down credit?
- Is there a deadline driving the sale (1031 exchange, divorce, estate, relocation)? That informs how much negotiation room exists.
- Schools are F-rated, which usually means shorter tenancies and higher turnover. Who's the typical renter profile here, and what's been the actual vacancy rate?
- What's the average days-on-market for RENTAL listings here right now (not sales)? A rising rental-DOM trend means longer vacancies and softer asking-rent achievability than the comps imply.
- What's the recent tenant-quality profile in this submarket — average credit score on applications, eviction rate, late-payment / NSF rate, and stable-employment percentage? A property-management company in the area should have these aggregated.
- How much new for-sale + rental construction is in the pipeline within 1–3 miles? Heavy new supply typically softens prices + rents 12–24 months out; constrained supply supports both.
Investment metrics
- 1% rule
- 0.81% ✗
- Cap rate
- 6.82%
- Cash-on-cash
- 1.87%
- DSCR
- 1.08
- GRM
- 10.3
CMA / ARV
No comps found within radius.
Projected returns pro-forma
10.0% appreciation · 3.0% rent growth · sell at horizon
- IRR
- 25.6%
- Equity multiple
- 3.04×
- Total profit
- $82,082
- Equity at exit
- $129,276
- IRR
- 22.5%
- Equity multiple
- 6.93×
- Total profit
- $238,447
- Equity at exit
- $278,789
Cash invested: $40,180 (down + closing). Projections, not guarantees.
Landlord ↔ Tenant lean methodology
- Overall (STATE)
- 83 Strongly Landlord-Friendly
- State Oklahoma
- 83 Strongly Landlord-Friendly · R+20
- County
- — inherits STATE
- City
- — inherits STATE
ZIP-level market 74426
- Home prices YoY
- 5.3%
- Active inventory
- 147
- Price-to-rent
- 10.3×
Monthly cashflow live
- Estimated rent
- $1,163 medium interval (Pro) →
- Mortgage (P&I)
- −$753
- Tax from tax record
- −$44 /mo · $526/yr
- Insurance
- −$60
- HOA
- −$0
- Vacancy / Maint / Mgmt
- −$244
- Net cashflow
- $63
Break-even live
UW: 25.0% down · 7.5% · 30yr · 1.5% tax · 5.0% vac · 8.0% maint · 8.0% mgmt
Financing live
Cash to close
- Down payment
- $35,875
- Closing costs
- $4,305
- Reserves months
- —
- Total cash needed
- —
Loan-product check · same deal, 3 products live
Conventional
25% down · 7.5% · 30yr
- Down + closing
- —
- Monthly P&I
- —
- Monthly cashflow
- —
- DSCR
- —
- Eligible?
- —
Personal DTI + credit; lowest rate.
DSCR
20% down · 8.5% · 30yr
- Down + closing
- —
- Monthly P&I
- —
- Monthly cashflow
- —
- DSCR
- —
- Eligible?
- —
No personal income docs; deal must DSCR.
Hard money
10% down · 12.0% · 12mo
- Down + closing
- —
- Monthly P&I
- —
- Monthly cashflow
- —
- DSCR
- —
- Eligible?
- —
Short-term bridge; refi at stabilization.
Listing history 19 events
-
2026-06-18price $143,500 Active 56 DOM
-
2026-06-18days on market $144,900 Active 56 DOM
-
2026-06-17days on market $144,900 Active 55 DOM
-
2026-06-16days on market $144,900 Active 54 DOM
-
2026-06-15days on market $144,900 Active 53 DOM
-
2026-06-13days on market $144,900 Active 51 DOM
-
2026-06-12days on market $144,900 Active 50 DOM
-
2026-06-09days on market $144,900 Active 47 DOM
-
2026-06-08days on market $144,900 Active 46 DOM
-
2026-06-08days on market $144,900 Active 45 DOM
-
2026-06-07days on market $144,900 Active 44 DOM
-
2026-06-04days on market $144,900 Active 41 DOM
-
2026-06-02days on market $144,900 Active 40 DOM
-
2026-06-01days on market $144,900 Active 39 DOM
-
2026-05-31days on market $144,900 Active 38 DOM
-
2026-05-21price $144,900
-
2026-04-14$149,900 Active
-
2016-11-28soldstatus $65,000 61-char remark
Show marketing remark (61 chars)
Sold at time of listing. Listed for statistical purpose only.
-
2016-08-12$65,000 61-char remark
Show marketing remark (61 chars)
Sold at time of listing. Listed for statistical purpose only.
ⓘ Source: listings_history table (triggers on properties + properties_extension) + one-shot
backfill from property_details.listing_events for pre-trigger history.
Tax reassessment forecast OK · Resets to sale price
- Current annual tax
- $526 · $44/mo
- Projected year-2 tax
- $1,292 · $108/mo
- Expected delta
- +$766/yr (+$64/mo · 145.5%)
ⓘ Screening estimate from a state-policy table — verify with the county assessor before closing.
Climate risk First Street
- Flood 1/10 Low FEMA zone X (unshaded) · 0% chance over 30 yrs
- Wildfire 6/10 Major
- Heat 6/10 Major 7 d/yr ≥111°F today · 19 d/yr by 30 yrs out
- Wind 3/10 Moderate 6% chance of damaging wind over 30 yrs
- Air quality 2/10 Low 1 unhealthy d/yr today · 2 by 30 yrs out
Nearby sold comps map
Loading sold comps map…
Walkable amenities ~0.75 mi
Loading nearby amenities…
Taxation est. · year 1
- Rental income
- $13,957
- − Mortgage interest
- −$8,038
- − Property taxes
- −$526
- − Insurance
- −$718
- − Repairs & maintenance
- −$1,117
- − Management
- −$1,117
- − Depreciation
- −$4,175
- Taxable loss
- −$1,732
- Est. tax savings @ 24.0%
- +$416
- After-tax cash flow
- $1,168/yr
For passive investors: Depreciation is non-cash, so a rental often shows a tax loss while cash-flowing — sheltering income. Rental losses are passive: they offset passive income freely, and up to $25,000/yr can offset ordinary (W-2) income if you actively participate and your MAGI is under $100k (phasing out to $0 by $150k); unused losses carry forward. On sale, claimed depreciation is recaptured at up to 25%, and gains may owe capital-gains tax (a 1031 exchange can defer both). Figures are a year-1 estimate at your 24.0% rate — not tax advice; consult a CPA.
Schools (NCES district)
- District
- Checotah
- NCES district ID
- 4007350
- Math proficiency
- 32% ▼ -7.00%
- Reading proficiency
- 28% ▼ -2.00%
- Median HH income
- $34,331
- Composite
- 24.73/100
- National rank
- #7607
- State rank
- #72 of 270 in OK
Livability — Checotah
- Score
- 60/100
- State rank
- #328
- US rank
- #18495
Category grades
Schools grade is shown separately in the Schools card above.
Census & demographics
- Population (ZIP)
- 9,482
Population outlook (McIntosh County) Hauer SSP2
- Today (2025)
- 18,935 people
- By 2030
- 18,272 · -3.5%
- By 2040
- 16,905 · -10.7%
- By 2050
- 15,771 · -16.7%
- By 2075
- 14,097 · -25.6%
- By 2100
- 12,572 · -33.6%
Race, ethnicity, and origin ACS 2023
- Neighborhood character
- Diverse neighborhood (Simpson 0.62)
- Race & ethnicity
- White 62% Native American 18% Two or more races 13% Hispanic / Latino 5% Black 3% Asian 2%
- Common ancestry
- Iranian 3% Slovak 2% Lithuanian 2%
- Foreign-born
- 2% · Canada
- Languages at home
- 94% English-only · German/W. Germanic 2% Other Indo-European 1% Spanish 1%
Political lean MEDSL · McIntosh
- 2024 margin
- Solid R (+52.7) · D 22.9% · R 75.7% · Other 1.4%
- 2008→2024 swing
- -33.5pp toward R · 2008: -19.3pp · 2024: -52.7pp
- All cycles
- 2024: R+52.7 2020: R+49.7 2016: R+42.5 2012: R+23.8 2008: R+19.3
Not yet ingested
- Civics
- —
Market trends
- HPI YoY
- ▲ 16.32%
- Current HPI
- 325.0751
- Rent YoY
- —
- Metro
- —
- State GDP YoY
- ▲ 1.55%
- F500 in state
- 6
Industry mix (Fortune 500 HQ in OK)
| Industry | F500 HQs | Revenue |
|---|---|---|
| Energy | 3 | $48B |
|
||
Price history
+122.9% since first listed4 events — show timeline
- 2026-05-21 Price Changed $144,900 MLS Technology, Inc.
- 2026-04-14 Listed $149,900 MLS Technology, Inc.
- 2016-11-28 Sold (MLS) $65,000 MLS Technology, Inc.
- 2016-08-12 Listed $65,000 MLS Technology, Inc.
Property tax history
+2.8%/yrLatest (2025): $526 · +7.6% YoY. Source: county tax records.
Cash-flow waterfall
monthlySold comps — $/sqft
last 12 mo · ≤1 miLoading sold comps…