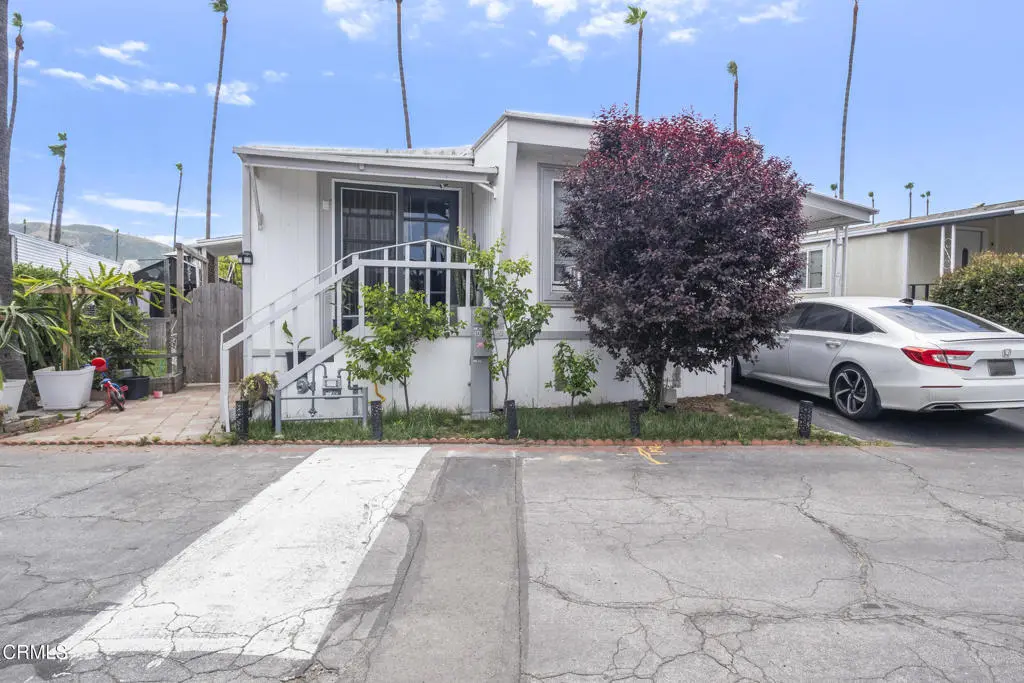
265 Beckwith Unit 54A · Santa Paula, CA
Flood risk 3/10 · Minor
- FEMA flood zone
- X (unshaded)
- Chance of flooding over 30 yrs
- 0.2%
- Est. flood insurance / yr
- $507 – $1,088
Fire risk 5/10 · Moderate
- Est. fire insurance / yr
- $659 – $1,223
Heat risk 5/10 · Moderate
- Hot days now (above 95°F)
- 7 days/yr
- Hot days in 30 yrs
- 17 days/yr
Wind risk 1/10 · Minimal
- Chance of severe wind over 30 yrs
- —
Air-quality risk 7/10 · Major
- Unhealthy air days now
- 12 days/yr
- Unhealthy air days in 30 yrs
- 12 days/yr
Risk factors via First Street. Map © Google.
Why this score? — see what drove the B- grade
The composite is a weighted blend of 9 inputs, each scored 0–100. Each bar is that input's sub-score; the figure is the points it added to the 100-point composite (weight × sub-score).
- Cash flow +24.4/30.0
- ARV discount +15.0/15.0
- DSCR +7.9/10.0
- 1% rule +6.3/10.0
- Schools +5.0/10.0
- Condition / age +3.8/5.0
- Livability +3.3/5.0
- Rent growth +2.5/5.0
- Appreciation +0.0/10.0
$259,900
🖨 Deal sheet 📄 Offer letter ✓ Due diligence
Listing remarks
Charming double-wide mobile home located in the desirable community of Santa Paula West Mobile Home Park. This well-maintained 2-bedroom, 1-bath residence offers a spacious layout with comfortable living areas, abundant natural light, and a welcoming atmosphere throughout. The open living room flows into a functional kitchen with ample cabinet space and room for dining. Both bedrooms are generously sized, providing comfort for guests or family living. Outside, enjoy private outdoor space perfect for relaxing, gardening, or entertaining. Conveniently located near shopping, dining, parks, and easy access to local amenities, this home offers an excellent opportunity for affordable living in be
Key facts
- Functional kitchen
- Ample cabinet space
- Spacious layout
Tags
Property features AI
Finance
- Other: Living area and year built sourced from public records
- Financial info: Land lease approximately $853 monthly (seller provided)
- HOA & community: Located in Santa Paula West Mobile Home Park; Community park
Exterior
- Parking: 2 covered carport spaces; 2 garage spaces; Total 4 parking spaces
- Utilities: Public sewer; District/public water; Cable available; Electricity available
- Home design: Mobile home remains on site; Double body (multi-section/mobile); Has a view
- Construction: Mobile dimensions approximately 24' x 53'
- Exterior features: Chain link fencing; Patio (see remarks); In-ground pool; No sprinklers
Interior
- Kitchen: Gas range
- Flooring: Tile
- Bathrooms: 1 full bath
- Interior features: In-ground spa; Shower
- Laundry & utility: Has laundry; Gas dryer hookup
Neighborhood map
What this means for you Summary
Snapshot
- This is a 2-bed/1.0-bath manufactured listed at $260k. Condition is rated good.
Deal economics
- At list price, monthly cash flow is $527 ($6k/yr) — positive.
- The deal already cash-flows at list — no discount required.
- Meets the 1% rule at list price ($3k rent vs $260k).
- Recommended offer: $252k (3.0% below list) — sets the bar for market timing.
- Cap rate 8.7% vs local median 1.9% in Santa Paula — top-decile yield for the area; either an underpriced asset or a hidden risk that comps aren't pricing in. Stress-test before assuming the spread holds.
Location & tenants
- Location reads 66/100 on livability (#331 in CA) — a middle-class / working-renter tenant base. Strengths: health & safety A-, commute B+; Watch: schools D, amenities F, cost of living F.
- Market conditions: 130 active listings in the ZIP; 4 comparable units currently listed for rent nearby; rentals at typical pace (median 19d on market — plan ~3-4 weeks tenant-placement turnaround); solid renter incomes; 1,759 units permitted in Ventura County in 2024 (1,196 in 5+ unit buildings).
- This rent runs 44% of the median local income ($81k/yr) — at the standard rent-burdened threshold; future hikes will face affordability resistance.
Forward outlook
- Local home prices are declining (-3.0%/yr); year-one equity from $2k of loan paydown is wiped out by about $8k of value loss. Plan a longer hold.
- Ventura County population projected at +4% by 2050 — modest demand growth; plan on rents tracking national, not racing it.
Negotiation context
- It's been on market 54 days — a 3% lower offer ($252k) is reasonable based on typical stale-listing flexibility.
Risks & watch-outs
- Climate carrying-cost: moderate wildfire risk; extreme-heat days projected 7→17/yr by 2055 (HVAC capex compounding) — expect insurance premiums to compound above CPI over the hold.
Questions for the listing agent
- It's been on market 54 days. Have you received any prior offers? Is the seller open to a 3% concession, seller financing, or rate buy-down credit?
- Built in 1963 — when were the roof, HVAC, electrical panel, plumbing, and water heater last replaced?
- Is there a deadline driving the sale (1031 exchange, divorce, estate, relocation)? That informs how much negotiation room exists.
- Schools are D-rated, which usually means shorter tenancies and higher turnover. Who's the typical renter profile here, and what's been the actual vacancy rate?
- What's the average days-on-market for RENTAL listings here right now (not sales)? A rising rental-DOM trend means longer vacancies and softer asking-rent achievability than the comps imply.
- What's the recent tenant-quality profile in this submarket — average credit score on applications, eviction rate, late-payment / NSF rate, and stable-employment percentage? A property-management company in the area should have these aggregated.
- How much new for-sale + rental construction is in the pipeline within 1–3 miles? Heavy new supply typically softens prices + rents 12–24 months out; constrained supply supports both.
Investment metrics
- 1% rule
- 1.13% ✓
- Cap rate
- 8.73%
- Cash-on-cash
- 8.69%
- DSCR
- 1.39
- GRM
- 7.4
CMA / ARV
- ARV (on-the-fly)
- $432,000
- Comps found
- 6
Show comp detail 6 sales within ~0.75 mi
| Address | Dist | Beds/Ba | Sqft | Sold | Price | $/sf | Match |
|---|---|---|---|---|---|---|---|
| 975 W Telegraph Rd #24 | 0.18mi | 2/2.0 | 1,152 (-4%) | 9mo | $430,000 | $373 | 74 |
| 975 W Telegraph Rd #50 | 0.18mi | 2/2.0 | 1,152 (-4%) | 14mo | $420,000 | $365 | 70 |
| 975 W Telegraph Rd #103 | 0.18mi | 2/2.0 | 1,152 (-4%) | 20mo | $415,000 | $360 | 65 |
| 975 W Telegraph Rd #38 | 0.18mi | 2/2.0 | 1,344 (+12%) | 8mo | $440,000 | $327 | 61 |
| 975 W Telegraph Rd #81 | 0.18mi | 2/2.0 | 1,344 (+12%) | 22mo | $470,000 | $350 | 49 |
| 975 W Telegraph Rd Unit C81 | 0.28mi | 2/2.0 | 1,344 (+12%) | 22mo | $470,000 | $350 | 44 |
Match score weights: distance 35% · size 25% · config 20% · recency 20%. Top-matched comps best support the ARV.
Projected returns pro-forma
-3.0% appreciation · 3.0% rent growth · sell at horizon
- IRR
- -3.1%
- Equity multiple
- 0.88×
- Total profit
- $-8,513
- Equity at exit
- $38,752
- IRR
- 6.6%
- Equity multiple
- 1.49×
- Total profit
- $35,978
- Equity at exit
- $22,471
Cash invested: $72,772 (down + closing). Projections, not guarantees.
Landlord ↔ Tenant lean methodology
- Overall (STATE)
- 18 Strongly Tenant-Friendly
- State California
- 18 Strongly Tenant-Friendly · D+13
- County
- — inherits STATE
- City
- — inherits STATE
ZIP-level market 93060
- Active inventory
- 130
- Price-to-rent
- 7.4×
Monthly cashflow live
- Estimated rent
- $2,940 medium interval (Pro) →
- Mortgage (P&I)
- −$1,363
- Tax est. 1.5%
- −$325 /mo · $3,898/yr
- Insurance
- −$108
- HOA
- −$0
- Vacancy / Maint / Mgmt
- −$618
- Net cashflow
- $527
Break-even live
UW: 25.0% down · 7.5% · 30yr · 1.5% tax · 5.0% vac · 8.0% maint · 8.0% mgmt
Financing live
Cash to close
- Down payment
- $64,975
- Closing costs
- $7,797
- Reserves months
- —
- Total cash needed
- —
Loan-product check · same deal, 3 products live
Conventional
25% down · 7.5% · 30yr
- Down + closing
- —
- Monthly P&I
- —
- Monthly cashflow
- —
- DSCR
- —
- Eligible?
- —
Personal DTI + credit; lowest rate.
DSCR
20% down · 8.5% · 30yr
- Down + closing
- —
- Monthly P&I
- —
- Monthly cashflow
- —
- DSCR
- —
- Eligible?
- —
No personal income docs; deal must DSCR.
Hard money
10% down · 12.0% · 12mo
- Down + closing
- —
- Monthly P&I
- —
- Monthly cashflow
- —
- DSCR
- —
- Eligible?
- —
Short-term bridge; refi at stabilization.
Rent comps 4 comps
| Address | Beds | Baths | Sqft | Rent | $/sqft | DOM | Units | Dist |
|---|---|---|---|---|---|---|---|---|
| 325 Princeton St Santa Paula, CA | 3.0 | 2.0 | 1197 | $3,600 | $3.01 | 43d | 1 | 0.92mi |
| 325 Princeton St Santa Paula, CA | 3.0 | 2.0 | 1197 | $3,600 | $3.01 | 1d | 1 | 0.92mi |
| 200 W Main St Apt 7 Santa Paula, CA | 2.0 | 1.0 | 900 | $2,175 | $2.42 | 19d | 1 | 1.32mi |
| 129 Santa Anna St Unit B Santa Paula, CA | 2.0 | 1.0 | 840 | $2,250 | $2.68 | 14d | 1 | 1.50mi |
Listing history 14 events
-
2026-06-18days on market $259,900 Active 54 DOM
-
2026-06-17days on market $259,900 Active 53 DOM
-
2026-06-16days on market $259,900 Active 52 DOM
-
2026-06-15days on market $259,900 Active 51 DOM
-
2026-06-13days on market $259,900 Active 49 DOM
-
2026-06-10days on market $259,900 Active 46 DOM
-
2026-06-09days on market $259,900 Active 45 DOM
-
2026-06-08pricedays on market $259,900 Active 44 DOM
-
2026-06-07days on market $269,900 Active 43 DOM
-
2026-06-03days on market $269,900 Active 39 DOM
-
2026-06-02days on market $269,900 Active 38 DOM
-
2026-06-01days on market $269,900 Active 37 DOM
-
2026-05-31days on market $269,900 Active 36 DOM
-
2026-04-25$269,900 Active
ⓘ Source: listings_history table (triggers on properties + properties_extension) + one-shot
backfill from property_details.listing_events for pre-trigger history.
Climate risk First Street
- Flood 3/10 Moderate FEMA zone X (unshaded) · 20% chance over 30 yrs
- Wildfire 5/10 Major
- Heat 5/10 Major 7 d/yr ≥95°F today · 17 d/yr by 30 yrs out
- Wind 1/10 Low
- Air quality 7/10 Severe 12 unhealthy d/yr today · 12 by 30 yrs out
Nearby sold comps map
Loading sold comps map…
Walkable amenities ~0.75 mi
Loading nearby amenities…
Taxation est. · year 1
- Rental income
- $35,286
- − Mortgage interest
- −$14,558
- − Property taxes
- −$3,898
- − Insurance
- −$1,300
- − Repairs & maintenance
- −$2,823
- − Management
- −$2,823
- − Depreciation
- −$7,561
- Taxable income
- $2,323
- Est. tax owed @ 24.0%
- −$558
- After-tax cash flow
- $5,765/yr
For passive investors: Depreciation is non-cash, so a rental often shows a tax loss while cash-flowing — sheltering income. Rental losses are passive: they offset passive income freely, and up to $25,000/yr can offset ordinary (W-2) income if you actively participate and your MAGI is under $100k (phasing out to $0 by $150k); unused losses carry forward. On sale, claimed depreciation is recaptured at up to 25%, and gains may owe capital-gains tax (a 1031 exchange can defer both). Figures are a year-1 estimate at your 24.0% rate — not tax advice; consult a CPA.
Condition & rehab AI · 12 photos
This charming double-wide mobile home in Santa Paula West Mobile Home Park is well-maintained and move-in ready, with good condition throughout. A fresh coat of paint and some minor exterior updates would further enhance its curb appeal and rental value.
Value-add opportunities
- Resale paint exterior — enhances curb appeal
- Resale trim exterior — improves curb appeal
- Rental replace outdoor furniture — attracts renters
Renovation cost estimate screening
Value-add ROI direction
- Resale paint exterior — enhances curb appeal ↑
- Resale trim exterior — improves curb appeal ↑
- Rental replace outdoor furniture — attracts renters ↑
ⓘ Cost ranges are severity-bucket heuristics (US national rule-of-thumb). Get contractor quotes + a written scope before underwriting a rehab budget.
Schools (NCES district)
No district data.
Livability — Santa Paula
- Score
- 66/100
- State rank
- #331
- US rank
- #11320
Category grades
Schools grade is shown separately in the Schools card above.
Census & demographics
- Census place
- Santa Paula, CA
- County
- Ventura County · 829,955 people
- City population
- 34,501
- Metro
- Oxnard-Thousand Oaks-Ventura, CA
- Population (ZIP)
- 34,501
- Household income
- $80,979
- Rent vs Own
- Severe rent burden
- 1317.0
Population outlook (Ventura County) Hauer SSP2
- Today (2025)
- 895,754 people
- By 2030
- 912,134 · +1.8%
- By 2040
- 931,454 · +4.0%
- By 2050
- 934,609 · +4.3%
- By 2075
- 924,899 · +3.3%
- By 2100
- 864,712 · -3.5%
Race, ethnicity, and origin ACS 2023
- Neighborhood character
- Predominantly Hispanic (77%)
- Race & ethnicity
- Hispanic / Latino 77% White 18% Two or more races 18% Black 1% Native American 1% Asian 1%
- Hispanic origin (detail)
- Mexican 75%
- Common ancestry
- Lithuanian 1% Portuguese 1% Slovak 1%
- Foreign-born
- 31% · Canada
- Languages at home
- 37% English-only · Spanish 61%
Political lean MEDSL · Ventura
- 2024 margin
- D (+15.1) · D 56.1% · R 41.0% · Other 2.9%
- 2008→2024 swing
- +2.8pp toward D · 2008: 12.3pp · 2024: 15.1pp
- All cycles
- 2024: D+15.1 2020: D+21.1 2016: D+16.8 2012: D+5.3 2008: D+12.3
Not yet ingested
- Civics
- —
Market trends
- HPI YoY
- ▼ -942.94%
- Current HPI
- 333.9105
- Rent YoY
- —
- Metro
- Oxnard-Thousand Oaks-Ventura, CA
- State GDP YoY
- ▲ 3.21%
- F500 in state
- 116
Industry mix (Fortune 500 HQ in CA)
| Industry | F500 HQs | Revenue |
|---|---|---|
| Technology | 27 | $1,492B |
|
||
| Financial Services | 3 | $174B |
|
||
| Retail | 3 | $44B |
|
||
| Insurance | 3 | $26B |
|
||
| Media / Entertainment | 2 | $115B |
|
||
| Pharmaceuticals / Biotech | 2 | $62B |
|
||
Price history
1 event — show timeline
- 2026-04-25 Listed $269,900 CRMLS
Cash-flow waterfall
monthlySold comps — $/sqft
last 12 mo · ≤1 miLoading sold comps…