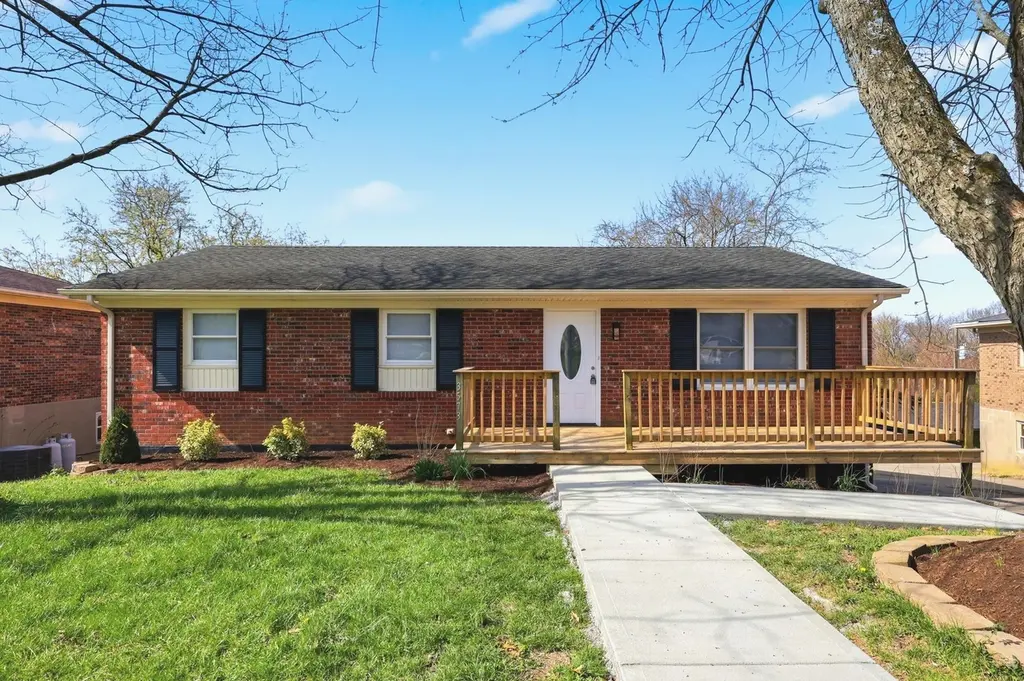
3573 Bold Bidder Dr · Lexington-Fayette, KY
Flood risk 1/10 · Minimal
- FEMA flood zone
- X (unshaded)
- Chance of flooding over 30 yrs
- 0.0%
- Est. flood insurance / yr
- $473 – $860
Fire risk 1/10 · Minimal
- Est. fire insurance / yr
- $839 – $1,559
Heat risk 4/10 · Minor
- Hot days now (above 101°F)
- 7 days/yr
- Hot days in 30 yrs
- 19 days/yr
Wind risk 2/10 · Minimal
- Chance of severe wind over 30 yrs
- 3.0%
Air-quality risk 1/10 · Minimal
- Unhealthy air days now
- 0 days/yr
- Unhealthy air days in 30 yrs
- 0 days/yr
Risk factors via First Street. Map © Google.
Why this score? — see what drove the F grade
The composite is a weighted blend of 9 inputs, each scored 0–100. Each bar is that input's sub-score; the figure is the points it added to the 100-point composite (weight × sub-score).
- Cash flow +6.7/30.0
- Rent growth +3.6/5.0
- Schools +3.4/10.0
- Livability +2.5/5.0
- Condition / age +2.5/5.0
- DSCR +1.0/10.0
- 1% rule +0.6/10.0
- ARV discount +0.0/15.0
- Appreciation +0.0/10.0
$314,999
🖨 Deal sheet 📄 Offer letter ✓ Due diligence
Listing remarks
Charming 4-bed, 3-bath ranch with finished basement — bright, open main level with updated kitchen, ample living space, and private master suite. Finished lower level adds flexible family/rec room, home office, or guest area. Large yard, attached garage, and convenient layout make this an ideal move-in-ready home. Agent Owner
Key facts
- Private master suite
- Large yard
- Finished basement
Tags
Neighborhood map
What this means for you Summary
Snapshot
- This is a 4-bed/1.5-bath single-family listed at $315k.
Deal economics
- At list price, monthly cash flow is $-501 ($-6k/yr) — negative.
- To cash-flow at today's rent, offer at most $227k (28.1% below list).
- To meet the 1% rule (rent ≥ 1% of price), the offer needs to be $176k (44.2% below list).
- Recommended offer: $176k (44.2% below list) — sets the bar for 1% rule.
Location & tenants
- Location reads: area grade F — affects rentability + tenant quality, not the cash-flow math above.
- Fayette County (urban): math 35% / reading 45% proficiency, ranked #27 of 165 in KY (top 16%) — families likely to look elsewhere, expect single-tenant / working-renter base with shorter leases.
- Zoned schools: Tates Creek Elementary School (math 31% / reading 37%, grade F, #329 of 676 statewide, top 49%, 642 students, 70% FRL); Tates Creek Middle School (math 29% / reading 38%, grade F, #105 of 217 statewide, top 51%, 769 students, 58% FRL); Tates Creek High School (math 29% / reading 32%, grade F, #121 of 254 statewide, top 47%, 1,734 students, 52% FRL) — zoned schools average 60% FRL vs 44% district-wide (16 pts higher); higher-poverty schools than district average — tighter screening recommended.
- Market conditions: Rents rising fast (+4.5%/yr); 103 active listings in the ZIP; 24 comparable units currently listed for rent nearby; rentals at typical pace (median 24d on market — plan ~3-4 weeks tenant-placement turnaround); 1,036 units permitted in Fayette County in 2024 (542 in 5+ unit buildings).
- This rent runs 39% of the median local income ($54k/yr) — at the standard rent-burdened threshold; future hikes will face affordability resistance.
Forward outlook
- Local home prices are declining (-3.0%/yr); year-one equity from $2k of loan paydown is wiped out by about $9k of value loss. Plan a longer hold.
- Fayette County population projected at +35% by 2050 — long-run rental-demand tailwind backs the buy-and-hold thesis.
Negotiation context
- Only 5 days on market — expect competitive offers; lowballing is unlikely to land.
- 3 sale attempts since 25y ago with the ask held roughly flat each time — persistent listings suggest the price (not the market) is what's stuck; bring a comps-based counter.
- Current owner paid $120k; list at $315k implies a 162% gain — meaningful room to come down on a strong offer.
Questions for the listing agent
- What do current leases actually rent for vs. the listed asking? Can we see a recent rent roll and the last 12 months of T-12 income?
- Built in 1974 — when were the roof, HVAC, electrical panel, plumbing, and water heater last replaced?
- Is there a deadline driving the sale (1031 exchange, divorce, estate, relocation)? That informs how much negotiation room exists.
- The area grade is low — what's the realistic commute time and amenity access for the typical tenant pool here? Any planned neighborhood developments (good or bad) we should know about?
- What's the average days-on-market for RENTAL listings here right now (not sales)? A rising rental-DOM trend means longer vacancies and softer asking-rent achievability than the comps imply.
- What's the recent tenant-quality profile in this submarket — average credit score on applications, eviction rate, late-payment / NSF rate, and stable-employment percentage? A property-management company in the area should have these aggregated.
- How much new for-sale + rental construction is in the pipeline within 1–3 miles? Heavy new supply typically softens prices + rents 12–24 months out; constrained supply supports both.
Investment metrics
- 1% rule
- 0.56% ✗
- Cap rate
- 4.39%
- Cash-on-cash
- -6.81%
- DSCR
- 0.70
- GRM
- 14.9
CMA / ARV
- ARV (on-the-fly)
- $265,408
- Comps found
- 12
Show comp detail 12 sales within ~0.75 mi
| Address | Dist | Beds/Ba | Sqft | Sold | Price | $/sf | Match |
|---|---|---|---|---|---|---|---|
| 3501 Gunbow Ct | 0.16mi | 3/1.5 (-1) | 1,215 (-5%) | 2mo | $197,450 | $163 | 78 |
| 3504 Gunbow Ct | 0.17mi | 3/1.5 (-1) | 1,215 (-5%) | 2mo | $233,900 | $193 | 77 |
| 1307 Stephen Foster Dr | 0.49mi | 3/1.5 (-1) | 1,323 (+4%) | 1mo | $259,900 | $196 | 65 |
| 1548 Deer Lake Dr | 0.54mi | 3/1.5 (-1) | 1,232 (-3%) | 2mo | $238,000 | $193 | 62 |
| 1413 Jandymar Ct | 0.38mi | 3/2.0 (-1) | 1,364 (+7%) | 4mo | $225,000 | $165 | 61 |
| 3613 Crosby Dr | 0.56mi | 3/1.5 (-1) | 1,213 (-5%) | 4mo | $252,500 | $208 | 57 |
| 1605 Squire Hart Way | 0.74mi | 3/2.0 (-1) | 1,305 (+2%) | 4mo | $286,000 | $219 | 52 |
| 3668 Crosby Dr | 0.73mi | 4/2.0 | 1,432 (+12%) | 1mo | $274,750 | $192 | 43 |
| 3553 Buckhorn Dr | 0.61mi | 3/1.0 (-1) | 1,107 (-13%) | 3mo | $237,500 | $215 | 40 |
| 1561 Flora Glen Way | 0.62mi | 3/1.0 (-1) | 1,107 (-13%) | 3mo | $239,000 | $216 | 40 |
| 3400 Colonnade Dr | 0.60mi | 3/1.0 (-1) | 1,103 (-14%) | 4mo | $250,000 | $227 | 40 |
| 3304 Fall Ct | 0.67mi | 3/1.0 (-1) | 1,107 (-13%) | 2mo | $232,900 | $210 | 38 |
Match score weights: distance 35% · size 25% · config 20% · recency 20%. Top-matched comps best support the ARV.
Projected returns pro-forma
-3.0% appreciation · 4.52% rent growth · sell at horizon
- IRR
- -26.8%
- Equity multiple
- 0.09×
- Total profit
- $-80,348
- Equity at exit
- $46,967
- IRR
- -20.6%
- Equity multiple
- -0.13×
- Total profit
- $-100,083
- Equity at exit
- $27,235
Cash invested: $88,200 (down + closing). Projections, not guarantees.
Landlord ↔ Tenant lean methodology
- Overall (STATE)
- 83 Strongly Landlord-Friendly
- State Kentucky
- 83 Strongly Landlord-Friendly · R+16
- County
- — inherits STATE
- City
- — inherits STATE
ZIP-level market 40517
- Rents YoY
- 4.5%
- Active inventory
- 103
- Price-to-rent
- 14.9×
Monthly cashflow live
- Estimated rent
- $1,757 high interval (Pro) →
- Mortgage (P&I)
- −$1,652
- Tax from tax record
- −$106 /mo · $1,268/yr
- Insurance
- −$131
- HOA
- −$0
- Vacancy / Maint / Mgmt
- −$369
- Net cashflow
- $-501
Break-even live
UW: 25.0% down · 7.5% · 30yr · 1.5% tax · 5.0% vac · 8.0% maint · 8.0% mgmt
Financing live
Cash to close
- Down payment
- $78,750
- Closing costs
- $9,450
- Reserves months
- —
- Total cash needed
- —
Loan-product check · same deal, 3 products live
Conventional
25% down · 7.5% · 30yr
- Down + closing
- —
- Monthly P&I
- —
- Monthly cashflow
- —
- DSCR
- —
- Eligible?
- —
Personal DTI + credit; lowest rate.
DSCR
20% down · 8.5% · 30yr
- Down + closing
- —
- Monthly P&I
- —
- Monthly cashflow
- —
- DSCR
- —
- Eligible?
- —
No personal income docs; deal must DSCR.
Hard money
10% down · 12.0% · 12mo
- Down + closing
- —
- Monthly P&I
- —
- Monthly cashflow
- —
- DSCR
- —
- Eligible?
- —
Short-term bridge; refi at stabilization.
Rent comps 24 comps
| Address | Beds | Baths | Sqft | Rent | $/sqft | DOM | Units | Dist |
|---|---|---|---|---|---|---|---|---|
| 3628 Bold Bidder Dr Unit B Lexington, KY | 3.0 | 2.0 | 1400 | $1,495 | $1.07 | 23d | 1 | 0.16mi |
| 3504 Careto Ct Lexington, KY | 3.0 | 2.0 | 1200 | $1,800 | $1.50 | 14d | 1 | 0.20mi |
| 3545 Sundart Dr Lexington, KY | 4.0 | 2.0 | 1028 | $1,795 | $1.75 | 14d | 1 | 0.20mi |
| 3501 Pimlico Pkwy Lexington, KY | 1.0–3.0 | 1.0–2.0 | 832 | $1,405 | $1.69 | 14d | 11 | 0.28mi |
| 3612 River Park Dr Lexington, KY | 3.0 | 1.0 | 1025 | $1,695 | $1.65 | 14d | 1 | 0.42mi |
| 1552 Samara Glen Way Lexington, KY | 3.0 | 1.0 | 1145 | $1,550 | $1.35 | 23d | 1 | 0.56mi |
| 1391 Stephen Foster Dr Lexington, KY | 3.0 | 1.0 | 1000 | $1,500 | $1.50 | 14d | 1 | 0.58mi |
| 1333 Ox Hill Dr Lexington, KY | 3.0 | 1.0 | 1000 | $1,600 | $1.60 | 14d | 1 | 0.58mi |
| 1230 Trent Blvd Unit Labs Lexington, KY | 3.0 | 1.0 | 1000 | $1,550 | $1.55 | 23d | 1 | 0.81mi |
| 1179 Tatesbrook Dr Unit A Lexington, KY | 3.0 | 1.5 | 1408 | $1,500 | $1.07 | 23d | 1 | 0.83mi |
| 3448 Dixiana Dr Lexington, KY | 3.0 | 1.5 | 1161 | $1,995 | $1.72 | 23d | 1 | 0.86mi |
| 1197 Appian Crossing Way Lexington, KY | 1.0–3.0 | 1.0–2.5 | 1066 | $1,559 | $1.46 | 23d | 5 | 0.87mi |
| 3425 Featherston Dr Lexington, KY | 3.0 | 1.0 | 1145 | $1,600 | $1.40 | 23d | 1 | 0.92mi |
| 3339 Sutherland Dr Lexington, KY | 3.0 | 1.5 | 1108 | $1,895 | $1.71 | 14d | 1 | 0.92mi |
| 1409 Gatlinburg Ct Lexington, KY | 3.0 | 1.0 | 1145 | $1,700 | $1.48 | 23d | 1 | 0.93mi |
| 3352 Featherston Dr Lexington, KY | 3.0 | 1.0 | 1120 | $1,600 | $1.43 | 23d | 1 | 1.02mi |
| 2500 Alumni Dr Lexington, KY | 1.0–3.0 | 1.0–3.0 | 996 | $1,975 | $1.98 | 23d | 1 | 1.13mi |
| 3901 Rapid Run Dr Lexington, KY | 1.0–3.0 | 1.0–2.0 | 1002 | $1,884 | $1.88 | 14d | 34 | 1.14mi |
| 1717 Brook Park Dr Lexington, KY | 3.0 | 2.0 | 1400 | $1,950 | $1.39 | 23d | 1 | 1.23mi |
| 3732 Old Tates Creek Pike Lexington, KY | 3.0 | 2.5 | 1764 | $2,050 | $1.16 | 23d | 1 | 1.24mi |
| 2653 Twinbrooke Ln Lexington, KY | 3.0 | 1.0 | 1400 | $1,600 | $1.14 | 23d | 1 | 1.40mi |
| 3327 Wood Valley Ct Lexington, KY | 3.0 | 1.5 | 1650 | $1,550 | $0.94 | 14d | 1 | 1.44mi |
| 1025 Chinoe Rd Lexington, KY | 3.0 | 2.5 | 1840 | $2,900 | $1.58 | 23d | 1 | 1.45mi |
| 3260 Commodore Dr Lexington, KY | 1.0–3.0 | 1.0–2.5 | 1229 | $2,625 | $2.14 | 14d | 11 | 1.47mi |
Listing history 7 events
-
2026-04-04status Pending
-
2026-04-01status Active
-
2026-03-31status Pending
-
2026-03-29$314,999 Active
-
2025-11-04soldstatus $120,000
-
2002-01-30historical
-
2001-07-26$94,900
ⓘ Source: listings_history table (triggers on properties + properties_extension) + one-shot
backfill from property_details.listing_events for pre-trigger history.
Tax reassessment forecast KY · Resets to sale price
- Current annual tax
- $1,268 · $106/mo
- Projected year-2 tax
- $2,709 · $226/mo
- Expected delta
- +$1,441/yr (+$120/mo · 113.7%)
ⓘ Screening estimate from a state-policy table — verify with the county assessor before closing.
Climate risk First Street
- Flood 1/10 Low FEMA zone X (unshaded) · 0% chance over 30 yrs
- Wildfire 1/10 Low
- Heat 4/10 Moderate 7 d/yr ≥101°F today · 19 d/yr by 30 yrs out
- Wind 2/10 Low 3% chance of damaging wind over 30 yrs
- Air quality 1/10 Low 0 unhealthy d/yr today · 0 by 30 yrs out
Nearby sold comps map
Loading sold comps map…
Walkable amenities ~0.75 mi
Loading nearby amenities…
Taxation est. · year 1
- Rental income
- $21,087
- − Mortgage interest
- −$17,645
- − Property taxes
- −$1,268
- − Insurance
- −$1,575
- − Repairs & maintenance
- −$1,687
- − Management
- −$1,687
- − Depreciation
- −$9,164
- Taxable loss
- −$11,938
- Est. tax savings @ 24.0%
- +$2,865
- After-tax cash flow
- $-3,142/yr
For passive investors: Depreciation is non-cash, so a rental often shows a tax loss while cash-flowing — sheltering income. Rental losses are passive: they offset passive income freely, and up to $25,000/yr can offset ordinary (W-2) income if you actively participate and your MAGI is under $100k (phasing out to $0 by $150k); unused losses carry forward. On sale, claimed depreciation is recaptured at up to 25%, and gains may owe capital-gains tax (a 1031 exchange can defer both). Figures are a year-1 estimate at your 24.0% rate — not tax advice; consult a CPA.
Schools (NCES district)
- District
- Fayette County
- NCES district ID
- 2101860
- Math proficiency
- 35% ▼ -16.00%
- Reading proficiency
- 45% ▼ -13.00%
- Median HH income
- $49,245
- Composite
- 34.38/100
- National rank
- #5211
- State rank
- #27 of 165 in KY
Livability — Lexington-Fayette
No livability data for this city. (Only ~50 U.S. cities are tracked.)
Census & demographics
- Census place
- Lexington-Fayette, KY
- County
- Fayette County · 317,143 people
- City population
- 321,882
- Metro
- Lexington-Fayette, KY
- Population (ZIP)
- 35,656
- Household income
- $53,670
- Rent vs Own
- Severe rent burden
- 2743.0
Population outlook (Fayette County) Hauer SSP2
- Today (2025)
- 363,454 people
- By 2030
- 388,270 · +6.8%
- By 2040
- 438,688 · +20.7%
- By 2050
- 490,667 · +35.0%
- By 2075
- 625,394 · +72.1%
- By 2100
- 721,354 · +98.5%
Race, ethnicity, and origin ACS 2023
- Neighborhood character
- Diverse neighborhood (Simpson 0.57)
- Race & ethnicity
- White 60% Black 24% Two or more races 9% Hispanic / Latino 8% Asian 2%
- Hispanic origin (detail)
- Mexican 5%
- Common ancestry
- Italian 3% Lithuanian 2% Slovak 1%
- Foreign-born
- 9% · Canada
- Languages at home
- 87% English-only · Spanish 6% Other Indo-European 2% Arabic 1%
Political lean MEDSL · Fayette
- 2024 margin
- D (+18.1) · D 58.0% · R 39.9% · Other 2.1%
- 2008→2024 swing
- +13.3pp toward D · 2008: 4.8pp · 2024: 18.1pp
- All cycles
- 2024: D+18.1 2020: D+20.8 2016: D+9.5 2012: D+1.0 2008: D+4.8
Not yet ingested
- Civics
- —
Market trends
- HPI YoY
- ▼ -182.53%
- Current HPI
- 248.0466
- Rent YoY
- ▲ 4.52%
- Metro
- Lexington-Fayette, KY
- State GDP YoY
- ▲ 1.81%
- F500 in state
- 4
Industry mix (Fortune 500 HQ in KY)
| Industry | F500 HQs | Revenue |
|---|---|---|
| Healthcare | 1 | $118B |
|
||
| Food / Beverage | 1 | $7B |
|
||
Price history
+231.9% since first listed7 events — show timeline
- 2026-04-04 Pending — ImagineMLS
- 2026-04-01 Relisted — ImagineMLS
- 2026-03-31 Pending — ImagineMLS
- 2026-03-29 Listed $314,999 ImagineMLS
- 2025-11-04 Sold (Public Records) $120,000 Public Records
- 2002-01-30 Listing Removed — ImagineMLS
- 2001-07-26 Listed $94,900 ImagineMLS
Property tax history
+1.8%/yrLatest (2015): $1,268 · +1.8% YoY. Source: county tax records.
Cash-flow waterfall
monthlySold comps — $/sqft
last 12 mo · ≤1 miLoading sold comps…