334 Miss Ann Dr · Sulligent, AL
Flood risk 1/10 · Minimal
- FEMA flood zone
- X (unshaded)
- Chance of flooding over 30 yrs
- 0.0%
- Est. flood insurance / yr
- $507 – $1,088
Fire risk 4/10 · Minor
- Est. fire insurance / yr
- $916 – $1,700
Heat risk 6/10 · Moderate
- Hot days now (above 107°F)
- 7 days/yr
- Hot days in 30 yrs
- 20 days/yr
Wind risk 6/10 · Moderate
- Chance of severe wind over 30 yrs
- 27.0%
Air-quality risk 1/10 · Minimal
- Unhealthy air days now
- 0 days/yr
- Unhealthy air days in 30 yrs
- 0 days/yr
Risk factors via First Street. Map © Google.
Why this score? — see what drove the D+ grade
The composite is a weighted blend of 9 inputs, each scored 0–100. Each bar is that input's sub-score; the figure is the points it added to the 100-point composite (weight × sub-score).
- Cash flow +15.0/30.0
- ARV discount +7.5/15.0
- Appreciation +5.9/10.0
- 1% rule +5.0/10.0
- DSCR +5.0/10.0
- Livability +2.9/5.0
- Schools +2.8/10.0
- Rent growth +2.5/5.0
- Condition / age +2.5/5.0
$23,260
🖨 Deal sheet (PDF) 📄 Offer letter ✓ Due diligence
Listing remarks
Double Wide mobile home on approximately 1.5 ac Call for details
Key facts
- Listed 53 days
Property features AI
Exterior
- Parking: No on-site parking
- Home design: Residential mobile home; One story
- Exterior features: Directions: Wilson Rd, right on Miss Ann Dr
Interior
- Interior features: Single-story layout
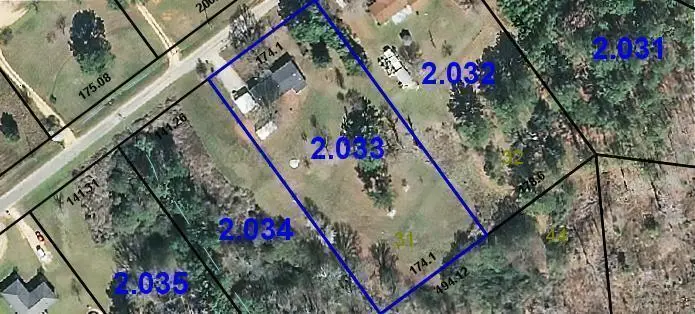
Neighborhood map
What this means for you Summary
Snapshot
- This is a 3-bed/1.0-bath manufactured listed at $23k.
Deal economics
- At list price, monthly cash flow is $652 ($8k/yr) — positive.
- The deal already cash-flows at list — no discount required.
- Meets the 1% rule at list price ($1k rent vs $23k).
- Recommended offer: $23k (3.0% below list) — sets the bar for market timing.
Location & tenants
- Location reads 57/100 on livability (#394 in AL) — a working-class tenant base; expect higher turnover. Strengths: cost of living A+, crime A-; Watch: amenities F, commute F, employment F.
- Lamar County (rural): math 23% / reading 44% proficiency, ranked #57 of 129 in AL (top 44%) — families likely to look elsewhere, expect single-tenant / working-renter base with shorter leases.
- Zoned schools: Vernon Elementary School (math 42% / reading 47%, grade F, #171 of 627 statewide, top 31%, 278 students, 72% FRL) — zoned schools average 72% FRL vs 48% district-wide (24 pts higher); higher-poverty schools than district average — tighter screening recommended.
- Market conditions: 12 active listings in the ZIP.
Forward outlook
- In year one you build about $591 of equity ($161 loan paydown + $430 appreciation (1.9% local appreciation)).
- Lamar County population projected at -21% by 2050 — secular population decline; favor cash flow + early exit over multi-decade hold.
- At projected returns (1.9% appreciation + 3.0% rent growth), your $7k cash investment doubles in ~1 year — after that, you're playing with house money.
Negotiation context
- It's been on market 54 days — a 3% lower offer ($23k) is reasonable based on typical stale-listing flexibility.
- 2 sale attempts since 2y ago with the ask held roughly flat each time — persistent listings suggest the price (not the market) is what's stuck; bring a comps-based counter.
Risks & watch-outs
- Climate carrying-cost: major wind risk, 27% chance of damaging wind over 30y; extreme-heat days projected 7→20/yr by 2055 (HVAC capex compounding) — expect insurance premiums to compound above CPI over the hold.
Questions for the listing agent
- It's been on market 54 days. Have you received any prior offers? Is the seller open to a 3% concession, seller financing, or rate buy-down credit?
- Is there a deadline driving the sale (1031 exchange, divorce, estate, relocation)? That informs how much negotiation room exists.
- Schools are D-rated, which usually means shorter tenancies and higher turnover. Who's the typical renter profile here, and what's been the actual vacancy rate?
- The area grade is low — what's the realistic commute time and amenity access for the typical tenant pool here? Any planned neighborhood developments (good or bad) we should know about?
- What's the average days-on-market for RENTAL listings here right now (not sales)? A rising rental-DOM trend means longer vacancies and softer asking-rent achievability than the comps imply.
- What's the recent tenant-quality profile in this submarket — average credit score on applications, eviction rate, late-payment / NSF rate, and stable-employment percentage? A property-management company in the area should have these aggregated.
- How much new for-sale + rental construction is in the pipeline within 1–3 miles? Heavy new supply typically softens prices + rents 12–24 months out; constrained supply supports both.
Investment metrics
- 1% rule
- 4.34% ✓
- Cap rate
- 39.91%
- Cash-on-cash
- 120.08%
- DSCR
- 6.34
- GRM
- 1.9
CMA / ARV
- ARV (median comp)
- $119,284
- List price
- $23,260
- Delta
- -80.50%
- Verdict
- UNDERPRICED
- Comps
- 1 within 2.0 mi
Projected returns pro-forma
1.85% appreciation · 3.0% rent growth · sell at horizon
- IRR
- —
- Equity multiple
- 7.59×
- Total profit
- $42,930
- Equity at exit
- $8,985
- IRR
- —
- Equity multiple
- 15.81×
- Total profit
- $96,474
- Equity at exit
- $12,794
Cash invested: $6,513 (down + closing). Projections, not guarantees.
Landlord ↔ Tenant lean methodology
- Overall (STATE)
- 90 Strongly Landlord-Friendly
- State Alabama
- 90 Strongly Landlord-Friendly · R+15
- County
- — inherits STATE
- City
- — inherits STATE
ZIP-level market 35586
- Home prices YoY
- 1.4%
- Active inventory
- 12
- Price-to-rent
- 1.9×
Monthly cashflow live
- Estimated rent
- $1,010 medium interval (Pro) →
- Mortgage (P&I)
- −$122
- Tax from tax record
- −$14 /mo · $170/yr
- Insurance
- −$10
- HOA
- −$0
- Vacancy / Maint / Mgmt
- −$212
- Net cashflow
- $652
Break-even live
Sensitivity live
| Price | -10% $665 | -5% $658 | +0% $652 | +5% $645 | +10% $639 |
|---|---|---|---|---|---|
| Rent | -10% $572 | -5% $612 | +0% $652 | +5% $692 | +10% $731 |
| Rate | -1.0pp $663 | -0.5pp $658 | base $652 | +0.5pp $646 | +1.0pp $640 |
UW: 25.0% down · 7.5% · 30yr · 1.5% tax · 5.0% vac · 8.0% maint · 8.0% mgmt
Financing live
Cash to close
- Down payment
- $5,815
- Closing costs
- $698
- Reserves months
- —
- Total cash needed
- —
Loan-product check · same deal, 3 products live
Conventional
25% down · 7.5% · 30yr
- Down + closing
- —
- Monthly P&I
- —
- Monthly cashflow
- —
- DSCR
- —
- Eligible?
- —
Personal DTI + credit; lowest rate.
DSCR
20% down · 8.5% · 30yr
- Down + closing
- —
- Monthly P&I
- —
- Monthly cashflow
- —
- DSCR
- —
- Eligible?
- —
No personal income docs; deal must DSCR.
Hard money
10% down · 12.0% · 12mo
- Down + closing
- —
- Monthly P&I
- —
- Monthly cashflow
- —
- DSCR
- —
- Eligible?
- —
Short-term bridge; refi at stabilization.
Listing history 18 events
-
2026-06-21days on market $23,260 Active 54 DOM
-
2026-06-19days on market $23,260 Active 52 DOM
-
2026-06-18days on market $23,260 Active 51 DOM
-
2026-06-17days on market $23,260 Active 50 DOM
-
2026-06-16days on market $23,260 Active 49 DOM
-
2026-06-15days on market $23,260 Active 48 DOM
-
2026-06-14days on market $23,260 Active 46 DOM
-
2026-06-12days on market $23,260 Active 45 DOM
-
2026-06-09days on market $23,260 Active 42 DOM
-
2026-06-08days on market $23,260 Active 41 DOM
-
2026-06-07days on market $23,260 Active 40 DOM
-
2026-06-04days on market $23,260 Active 36 DOM
-
2026-06-02days on market $23,260 Active 35 DOM
-
2026-06-01days on market $23,260 Active 34 DOM
-
2026-05-31days on market $23,260 Active 33 DOM
-
2026-05-31days on market $23,260 Active 32 DOM
-
2026-04-25$23,260 Active 64-char remark
-
2024-07-13$33,500 Active
ⓘ Source: listings_history table (triggers on properties + properties_extension) + one-shot
backfill from property_details.listing_events for pre-trigger history.
Tax reassessment forecast AL · Resets to sale price
- Current annual tax
- $170 · $14/mo
- Projected year-2 tax
- $170 · $14/mo
- Expected delta
- $0/yr ($0/mo · 0.0%)
ⓘ Screening estimate from a state-policy table — verify with the county assessor before closing.
Climate risk First Street
- Flood 1/10 Low FEMA zone X (unshaded) · 0% chance over 30 yrs
- Wildfire 4/10 Moderate
- Heat 6/10 Major 7 d/yr ≥107°F today · 20 d/yr by 30 yrs out
- Wind 6/10 Major 27% chance of damaging wind over 30 yrs
- Air quality 1/10 Low 0 unhealthy d/yr today · 0 by 30 yrs out
Nearby sold comps map
Loading sold comps map…
Walkable amenities ~0.75 mi
Loading nearby amenities…
Taxation est. · year 1
- Rental income
- $12,115
- − Mortgage interest
- −$1,303
- − Property taxes
- −$170
- − Insurance
- −$116
- − Repairs & maintenance
- −$969
- − Management
- −$969
- − Depreciation
- −$677
- Taxable income
- $7,910
- Est. tax owed @ 24.0%
- −$1,898
- After-tax cash flow
- $5,922/yr
For passive investors: Depreciation is non-cash, so a rental often shows a tax loss while cash-flowing — sheltering income. Rental losses are passive: they offset passive income freely, and up to $25,000/yr can offset ordinary (W-2) income if you actively participate and your MAGI is under $100k (phasing out to $0 by $150k); unused losses carry forward. On sale, claimed depreciation is recaptured at up to 25%, and gains may owe capital-gains tax (a 1031 exchange can defer both). Figures are a year-1 estimate at your 24.0% rate — not tax advice; consult a CPA.
Schools (NCES district)
- District
- Lamar County
- NCES district ID
- 0101950
- Math proficiency
- 23% ▼ -26.00%
- Reading proficiency
- 44% ▲ 1.00%
- Median HH income
- $34,856
- Composite
- 27.58/100
- National rank
- #6937
- State rank
- #57 of 129 in AL
Livability — Sulligent
- Score
- 57/100
- State rank
- #394
- US rank
- #22125
Category grades
Schools grade is shown separately in the Schools card above.
Census & demographics
- Census place
- Sulligent, AL
- City population
- 3,442
- Population (ZIP)
- 3,442
Population outlook (Lamar County) Hauer SSP2
- Today (2025)
- 12,818 people
- By 2030
- 12,235 · -4.5%
- By 2040
- 11,110 · -13.3%
- By 2050
- 10,081 · -21.4%
- By 2075
- 8,013 · -37.5%
- By 2100
- 6,222 · -51.5%
Race, ethnicity, and origin ACS 2023
- Neighborhood character
- Predominantly White (90%)
- Race & ethnicity
- White 90% Black 4% Two or more races 2% Native American 1%
- Common ancestry
- Italian 1%
- Foreign-born
- 1% · Canada
Political lean MEDSL · Lamar
- 2024 margin
- Solid R (+76.0) · D 11.7% · R 87.8%
- 2008→2024 swing
- -22.2pp toward R · 2008: -53.8pp · 2024: -76.0pp
- All cycles
- 2024: R+76.0 2020: R+72.2 2016: R+69.0 2012: R+53.2 2008: R+53.8
Not yet ingested
- Civics
- —
Market trends
- HPI YoY
- ▲ 1.85%
- Current HPI
- 134.2483
- Rent YoY
- —
- Metro
- —
- State GDP YoY
- ▲ 2.94%
- F500 in state
- 4
Industry mix (Fortune 500 HQ in AL)
| Industry | F500 HQs | Revenue |
|---|---|---|
| Financial Services | 1 | $8B |
|
||
| Healthcare | 1 | $5B |
|
||
Price history
-30.6% since first listed2 events — show timeline
- 2026-04-25 Listed $23,260 Walker County Area MLS
- 2024-07-13 Listed $33,500 Walker County Area MLS
Property tax history
-16.6%/yrLatest (2025): $170 · -30.4% YoY. Source: county tax records.
Cash-flow waterfall
monthlySold comps — $/sqft
last 12 mo · ≤1 miLoading sold comps…