7112 Springwell Ct SE · Huntsville, AL
Flood risk 1/10 · Minimal
- FEMA flood zone
- X (unshaded)
- Chance of flooding over 30 yrs
- 0.0%
- Est. flood insurance / yr
- $507 – $1,088
Fire risk 2/10 · Minimal
- Est. fire insurance / yr
- $916 – $1,700
Heat risk 5/10 · Moderate
- Hot days now (above 105°F)
- 8 days/yr
- Hot days in 30 yrs
- 24 days/yr
Wind risk 4/10 · Minor
- Chance of severe wind over 30 yrs
- 14.0%
Air-quality risk 1/10 · Minimal
- Unhealthy air days now
- 0 days/yr
- Unhealthy air days in 30 yrs
- 0 days/yr
Risk factors via First Street. Map © Google.
Why this score? — see what drove the D+ grade
The composite is a weighted blend of 9 inputs, each scored 0–100. Each bar is that input's sub-score; the figure is the points it added to the 100-point composite (weight × sub-score).
- Cash flow +12.2/30.0
- Appreciation +10.0/10.0
- ARV discount +6.7/15.0
- Livability +4.1/5.0
- Schools +3.7/10.0
- 1% rule +3.6/10.0
- DSCR +3.6/10.0
- Rent growth +2.5/5.0
- Condition / age +1.0/5.0
$435,990
🖨 Deal sheet 📄 Offer letter ✓ Due diligence
Listing remarks
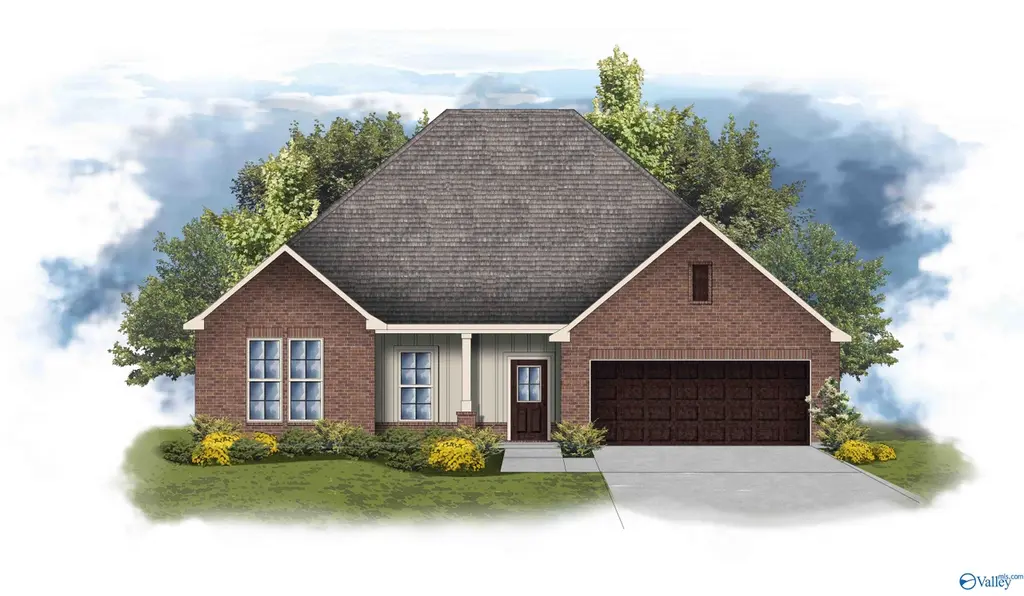
Under Construction-The COMSTOCK III G in Hickory Cove at Mountain Preserve community offers a 4BR/2BA, open and split design. Upgrades added (list attached). Features: double vanity, garden tub, separate custom tiled shower, and walk-in closet in master bath, double vanity in 2nd bath, kitchen island, walk-in pantry, boot bench in mudroom, covered porches, undermount sinks, custom kitchen backsplash, stone faced gas fireplace, LED lighting, crown molding, built-in shelving in panty/closets, landscaping with stone edging, gutters, stone address blocks, and more! Energy Efficient: tankless gas water heater, gas kitchen appliance package, vinyl low E-3 tilt-in windows, and more!
Key facts
- 0.28 acre lot
- 2 garage spots
- Community pool
Neighborhood map
What this means for you Summary
Snapshot
- This is a 4-bed/2.0-bath single-family listed at $436k. Condition is rated poor.
Deal economics
- At list price, monthly cash flow is $-84 ($-1k/yr) — negative.
- To cash-flow at today's rent, offer at most $424k (2.8% below list).
- To meet the 1% rule (rent ≥ 1% of price), the offer needs to be $377k (13.5% below list).
- Recommended offer: $377k (13.5% below list) — sets the bar for 1% rule.
- Cap rate 6.1% vs local median 3.8% in Huntsville — top-decile yield for the area; either an underpriced asset or a hidden risk that comps aren't pricing in. Stress-test before assuming the spread holds.
Location & tenants
- Location reads 82/100 on livability (#3 in AL, #1,082 nationally) — a professional / high-income tenant draw. Strengths: commute A+, cost of living A+, housing A+; Watch: crime F.
- Madison County (rural): math 27% / reading 56% proficiency, ranked #19 of 129 in AL (top 15%) — families likely to look elsewhere, expect single-tenant / working-renter base with shorter leases.
- Market conditions: 184 active listings in the ZIP; 2 comparable units currently listed for rent nearby; 4,709 units permitted in Madison County in 2024 (1,186 in 5+ unit buildings).
Forward outlook
- In year one you build about $47k of equity ($3k loan paydown + $44k appreciation (10.0% local appreciation)).
- Madison County population projected at +18% by 2050 — long-run rental-demand tailwind backs the buy-and-hold thesis.
- By year 2, paydown + projected appreciation supports a ~$75k cash-out refi (75% LTV) — recoverable capital for the next deal without selling this one.
Negotiation context
- Only 0 days on market — expect competitive offers; lowballing is unlikely to land.
Risks & watch-outs
- Climate carrying-cost: extreme-heat days projected 8→24/yr by 2055 (HVAC capex compounding) — expect insurance premiums to compound above CPI over the hold.
Questions for the listing agent
- What do current leases actually rent for vs. the listed asking? Can we see a recent rent roll and the last 12 months of T-12 income?
- Have any recent inspections been done? Can we get a copy of the seller's disclosures and any deferred-maintenance estimates?
- What does the HOA fee cover, when was the last increase, and are there any pending special assessments or reserve-fund shortfalls?
- Is there a deadline driving the sale (1031 exchange, divorce, estate, relocation)? That informs how much negotiation room exists.
- Crime grade is F in this area — have there been break-ins, vandalism, or insurance claims at this property in the last 3 years? What carrier currently insures it and at what premium?
- The area grade is low — what's the realistic commute time and amenity access for the typical tenant pool here? Any planned neighborhood developments (good or bad) we should know about?
- What's the average days-on-market for RENTAL listings here right now (not sales)? A rising rental-DOM trend means longer vacancies and softer asking-rent achievability than the comps imply.
- What's the recent tenant-quality profile in this submarket — average credit score on applications, eviction rate, late-payment / NSF rate, and stable-employment percentage? A property-management company in the area should have these aggregated.
- How much new for-sale + rental construction is in the pipeline within 1–3 miles? Heavy new supply typically softens prices + rents 12–24 months out; constrained supply supports both.
Investment metrics
- 1% rule
- 0.86% ✗
- Cap rate
- 6.06%
- Cash-on-cash
- -0.82%
- DSCR
- 0.96
- GRM
- 9.6
CMA / ARV
- ARV (on-the-fly)
- $428,090
- Comps found
- 12
Show comp detail 12 sales within ~0.75 mi
| Address | Dist | Beds/Ba | Sqft | Sold | Price | $/sf | Match |
|---|---|---|---|---|---|---|---|
| 7112 Springwell Ct SE | 0.00mi | 4/2.0 | 2,314 (0%) | 1mo | $435,990 | $188 | 99 |
| 7109 Springwell Ct SE | 0.00mi | 4/2.0 | 2,314 (0%) | 4mo | $458,628 | $198 | 97 |
| 7106 Springwell Ct SE | 0.07mi | 4/2.0 | 2,314 (0%) | 5mo | $444,985 | $192 | 93 |
| 7137 Hickory Cove Way | 0.13mi | 4/2.0 | 2,314 (0%) | 6mo | $410,000 | $177 | 89 |
| 7108 Springwell Ct SE | 0.00mi | 4/2.0 | 2,120 (-8%) | 3mo | $425,129 | $201 | 84 |
| 7110 Springwell Ct SE | 0.00mi | 4/2.5 | 2,544 (+10%) | 2mo | $460,571 | $181 | 80 |
| 9018 Mountain Preserve Blvd | 0.41mi | 4/2.0 | 2,314 (0%) | 2mo | $390,000 | $169 | 79 |
| 7107 Springwell Ct SE | 0.00mi | 4/2.5 | 2,544 (+10%) | 5mo | $470,909 | $185 | 78 |
| 7118 Springwell Ct SE | 0.00mi | 4/2.0 | 2,636 (+14%) | 1mo | $461,712 | $175 | 76 |
| 7115 Springwell Ct SE | 0.00mi | 4/2.0 | 2,641 (+14%) | 3mo | $490,411 | $186 | 74 |
| 7102 Springwell Ct SE | 0.04mi | 4/2.0 | 2,641 (+14%) | 1mo | $462,298 | $175 | 74 |
| 8818 Old Middlestown Rd SE | 0.68mi | 4/3.0 | 2,092 (-10%) | 6mo | $386,385 | $185 | 43 |
Match score weights: distance 35% · size 25% · config 20% · recency 20%. Top-matched comps best support the ARV.
Projected returns pro-forma
10.0% appreciation · 3.0% rent growth · sell at horizon
- IRR
- 23.7%
- Equity multiple
- 2.90×
- Total profit
- $232,203
- Equity at exit
- $392,774
- IRR
- 21.1%
- Equity multiple
- 6.64×
- Total profit
- $688,171
- Equity at exit
- $847,033
Cash invested: $122,077 (down + closing). Projections, not guarantees.
Landlord ↔ Tenant lean methodology
- Overall (STATE)
- 90 Strongly Landlord-Friendly
- State Alabama
- 90 Strongly Landlord-Friendly · R+15
- County
- — inherits STATE
- City
- — inherits STATE
ZIP-level market 35748
- Home prices YoY
- 4.0%
- Active inventory
- 184
- Price-to-rent
- 9.6×
Monthly cashflow live
- Estimated rent
- $3,771 medium interval (Pro) →
- Mortgage (P&I)
- −$2,286
- Tax est. 1.5%
- −$545 /mo · $6,540/yr
- Insurance
- −$182
- HOA
- −$50
- Vacancy / Maint / Mgmt
- −$792
- Net cashflow
- $-84
Break-even live
UW: 25.0% down · 7.5% · 30yr · 1.5% tax · 5.0% vac · 8.0% maint · 8.0% mgmt
Financing live
Cash to close
- Down payment
- $108,998
- Closing costs
- $13,080
- Reserves months
- —
- Total cash needed
- —
Loan-product check · same deal, 3 products live
Conventional
25% down · 7.5% · 30yr
- Down + closing
- —
- Monthly P&I
- —
- Monthly cashflow
- —
- DSCR
- —
- Eligible?
- —
Personal DTI + credit; lowest rate.
DSCR
20% down · 8.5% · 30yr
- Down + closing
- —
- Monthly P&I
- —
- Monthly cashflow
- —
- DSCR
- —
- Eligible?
- —
No personal income docs; deal must DSCR.
Hard money
10% down · 12.0% · 12mo
- Down + closing
- —
- Monthly P&I
- —
- Monthly cashflow
- —
- DSCR
- —
- Eligible?
- —
Short-term bridge; refi at stabilization.
Rent comps 2 comps
| Address | Beds | Baths | Sqft | Rent | $/sqft | DOM | Units | Dist |
|---|---|---|---|---|---|---|---|---|
| 8889 Mountain Preserve Blvd SE Gurley, AL | 4.0 | 3.5 | 3350 | $4,000 | $1.19 | 43d | 1 | 0.08mi |
| 9041 Mountain Preserve Blvd SE Gurley, AL | 3.0 | 2.0 | 1833 | $2,700 | $1.47 | 14d | 1 | 0.54mi |
HOA detail
- Monthly dues
- $50 · $600/yr
- Likely covers
- watergaslandscaping
Listing history 2 events
-
2026-03-26historical
-
2026-03-26$435,990
ⓘ Source: listings_history table (triggers on properties + properties_extension) + one-shot
backfill from property_details.listing_events for pre-trigger history.
Climate risk First Street
- Flood 1/10 Low FEMA zone X (unshaded) · 0% chance over 30 yrs
- Wildfire 2/10 Low
- Heat 5/10 Major 8 d/yr ≥105°F today · 24 d/yr by 30 yrs out
- Wind 4/10 Moderate 14% chance of damaging wind over 30 yrs
- Air quality 1/10 Low 0 unhealthy d/yr today · 0 by 30 yrs out
Nearby sold comps map
Loading sold comps map…
Walkable amenities ~0.75 mi
Loading nearby amenities…
Taxation est. · year 1
- Rental income
- $45,254
- − Mortgage interest
- −$24,422
- − Property taxes
- −$6,540
- − Insurance
- −$2,180
- − Repairs & maintenance
- −$3,620
- − Management
- −$3,620
- − HOA
- −$600
- − Depreciation
- −$12,683
- Taxable loss
- −$8,412
- Est. tax savings @ 24.0%
- +$2,019
- After-tax cash flow
- $1,013/yr
For passive investors: Depreciation is non-cash, so a rental often shows a tax loss while cash-flowing — sheltering income. Rental losses are passive: they offset passive income freely, and up to $25,000/yr can offset ordinary (W-2) income if you actively participate and your MAGI is under $100k (phasing out to $0 by $150k); unused losses carry forward. On sale, claimed depreciation is recaptured at up to 25%, and gains may owe capital-gains tax (a 1031 exchange can defer both). Figures are a year-1 estimate at your 24.0% rate — not tax advice; consult a CPA.
Condition & rehab AI · 3 photos
The home is in poor condition with a major roof issue. Immediate repairs are needed to raise its value.
Repairs flagged
- Major roof — The satellite image shows significant damage to the roof.
Value-add opportunities
- Both repair and replace roof — A new roof will significantly improve the home's appearance and functionality, enhancing both resale and rental value.
Renovation cost estimate screening
| Repair item | Severity | Est. cost |
|---|---|---|
| roof · The satellite image shows significant damage to the roof. | Major | $15,000–50,000 |
| Total estimated repair cost · 1 items | $15,000–50,000 |
Value-add ROI direction
- Both repair and replace roof — A new roof will significantly improve the home's appearance and functionality, enhancing both resale and rental value. ↑
ⓘ Cost ranges are severity-bucket heuristics (US national rule-of-thumb). Get contractor quotes + a written scope before underwriting a rehab budget.
Schools (NCES district)
- District
- Madison County
- NCES district ID
- 0102220
- Math proficiency
- 27% ▼ -32.00%
- Reading proficiency
- 56% ▼ -1.00%
- Median HH income
- $66,058
- Composite
- 37.15/100
- National rank
- #4483
- State rank
- #19 of 129 in AL
Livability — Huntsville
- Score
- 82/100
- State rank
- #3
- US rank
- #1082
Category grades
Schools grade is shown separately in the Schools card above.
Census & demographics
- Census place
- Huntsville, AL
- City population
- 220,435
- Population (ZIP)
- 7,311
Population outlook (Madison County) Hauer SSP2
- Today (2025)
- 392,086 people
- By 2030
- 409,788 · +4.5%
- By 2040
- 440,557 · +12.4%
- By 2050
- 460,990 · +17.6%
- By 2075
- 502,872 · +28.3%
- By 2100
- 513,623 · +31.0%
Race, ethnicity, and origin ACS 2023
- Neighborhood character
- Predominantly White (92%)
- Race & ethnicity
- White 92% Two or more races 3% Black 3%
- Common ancestry
- Lithuanian 5% Slovak 4% Italian 1%
- Foreign-born
- 1%
- Languages at home
- 97% English-only · French/Haitian/Cajun 1% Other Indo-European 1% Tagalog/Filipino 1%
Political lean MEDSL · Madison
- 2024 margin
- Lean R (+9.0) · D 44.7% · R 53.7% · Other 1.6%
- 2008→2024 swing
- +6.0pp toward D · 2008: -14.9pp · 2024: -9.0pp
- All cycles
- 2024: R+9.0 2020: R+8.0 2016: R+16.8 2012: R+18.7 2008: R+14.9
Not yet ingested
- Civics
- —
Market trends
- HPI YoY
- ▲ 13.02%
- Current HPI
- 337.7613
- Rent YoY
- —
- Metro
- —
- State GDP YoY
- ▲ 2.94%
- F500 in state
- 4
Industry mix (Fortune 500 HQ in AL)
| Industry | F500 HQs | Revenue |
|---|---|---|
| Financial Services | 1 | $8B |
|
||
| Healthcare | 1 | $5B |
|
||
Price history
2 events — show timeline
- 2026-03-26 Delisted — VMLS
- 2026-03-26 Listed $435,990 VMLS
Cash-flow waterfall
monthlySold comps — $/sqft
last 12 mo · ≤1 miLoading sold comps…