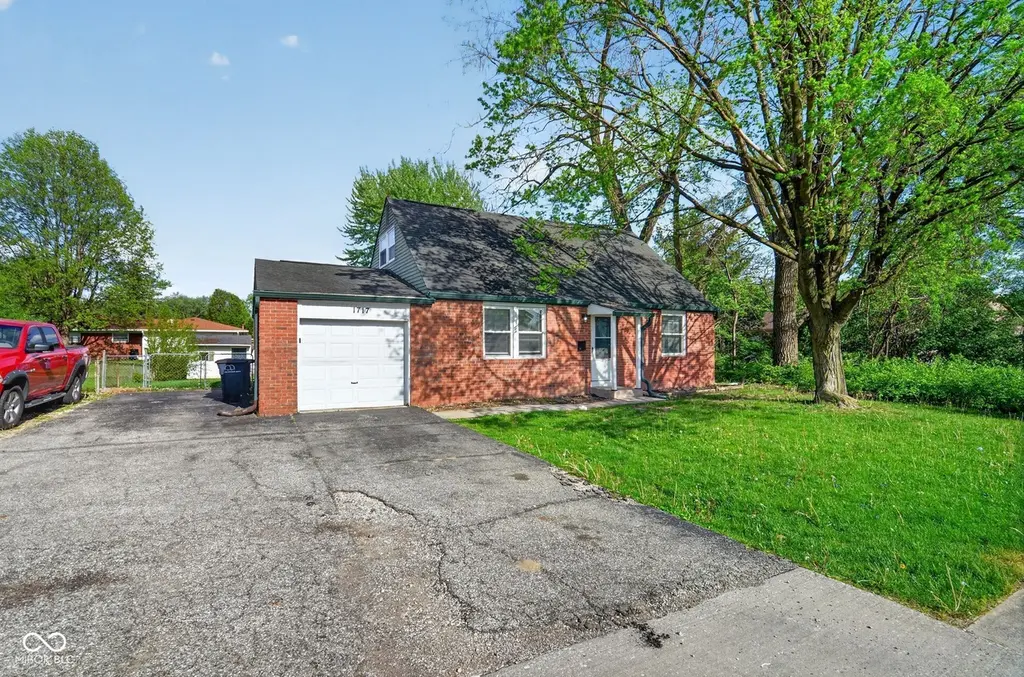
1717 S 9th Ave · Beech Grove, IN
Flood risk 1/10 · Minimal
- FEMA flood zone
- X (unshaded)
- Chance of flooding over 30 yrs
- 0.0%
- Est. flood insurance / yr
- $507 – $1,088
Fire risk 1/10 · Minimal
- Est. fire insurance / yr
- $717 – $1,331
Heat risk 4/10 · Minor
- Hot days now (above 102°F)
- 7 days/yr
- Hot days in 30 yrs
- 19 days/yr
Wind risk 2/10 · Minimal
- Chance of severe wind over 30 yrs
- 1.0%
Air-quality risk 3/10 · Minor
- Unhealthy air days now
- 2 days/yr
- Unhealthy air days in 30 yrs
- 3 days/yr
Risk factors via First Street. Map © Google.
Why this score? — see what drove the D grade
The composite is a weighted blend of 9 inputs, each scored 0–100. Each bar is that input's sub-score; the figure is the points it added to the 100-point composite (weight × sub-score).
- Cash flow +14.1/30.0
- ARV discount +7.3/15.0
- 1% rule +4.7/10.0
- DSCR +4.3/10.0
- Livability +3.2/5.0
- Rent growth +2.5/5.0
- Condition / age +2.5/5.0
- Schools +1.9/10.0
- Appreciation +0.0/10.0
$214,900
🖨 Deal sheet (PDF) 📄 Offer letter ✓ Due diligence
Listing remarks MLS
Welcome to this spacious 4-bedroom, 2-bath single-family home located in the heart of Beech Grove. Built in 1970, this well-maintained residence offers a comfortable and functional layout with approximately 1407 square feet of living space, providing plenty of room for everyday living and entertaining. The home features a practical floor plan with generous living areas, an eat-in kitchen, and ample natural light throughout. Situated in an established neighborhood within Beech Grove, the property offers a quiet residential setting while still providing convenient access to schools, parks, shopping, and major roadways leading into nearby Indianapolis. With its solid structure and versatile layout, this home presents an excellent opportunity for both homeowners and investors. Whether you're looking to move in and personalize or expand your portfolio, this property offers strong long-term potential in a desirable location.
Key facts
- Access to parks
- Access to shopping
- Eat-in kitchen
Tags
Neighborhood map
What this means for you Summary
Snapshot
- This is a 3-bed/1.0-bath single-family listed at $215k.
Deal economics
- At list price, monthly cash flow is $33 ($391/yr) — positive.
- The deal already cash-flows at list — no discount required.
- To meet the 1% rule (rent ≥ 1% of price), the offer needs to be $208k (3.1% below list).
- Recommended offer: $208k (3.1% below list) — sets the bar for 1% rule.
- Cap rate 6.5% vs local median 4.4% in Beech Grove — top-decile yield for the area; either an underpriced asset or a hidden risk that comps aren't pricing in. Stress-test before assuming the spread holds.
Location & tenants
- Location reads 63/100 on livability (#418 in IN) — a middle-class / working-renter tenant base. Strengths: cost of living A+, housing A+; Watch: health & safety C-, amenities F, commute F.
- Beech Grove City Schools (suburban): math 17% / reading 29% proficiency, ranked #269 of 301 in IN (top 89%) — low school quality limits family demand, transient renter base, plan for 1-2y turnover.
- Zoned schools: Hornet Park Elementary School (456 students, 75% FRL); Beech Grove Middle School (math 13% / reading 24%, grade F, #276 of 330 statewide, top 84%, 476 students, 78% FRL); Beech Grove Sr High School (math 17% / reading 47%, grade F, #295 of 369 statewide, top 82%, 918 students, 71% FRL) — zoned schools average 75% FRL vs 58% district-wide (17 pts higher); higher-poverty schools than district average — tighter screening recommended.
- Market conditions: 75 active listings in the ZIP; 6 comparable units currently listed for rent nearby; rentals at typical pace (median 14d on market — plan ~3-4 weeks tenant-placement turnaround); 1,906 units permitted in Marion County in 2024 (621 in 5+ unit buildings).
- This rent runs 44% of the median local income ($57k/yr) — at the standard rent-burdened threshold; future hikes will face affordability resistance.
Forward outlook
- Local home prices are declining (-3.0%/yr); year-one equity from $1k of loan paydown is wiped out by about $6k of value loss. Plan a longer hold.
- Marion County population projected at +18% by 2050 — long-run rental-demand tailwind backs the buy-and-hold thesis.
Negotiation context
- It's been on market 18 days — a 2% lower offer ($212k) is reasonable based on typical stale-listing flexibility.
- 3 sale attempts since 13y ago with the ask held roughly flat each time — persistent listings suggest the price (not the market) is what's stuck; bring a comps-based counter.
- Current owner paid $52k; list at $215k implies a 309% gain — meaningful room to come down on a strong offer.
Questions for the listing agent
- Built in 1970 — when were the roof, HVAC, electrical panel, plumbing, and water heater last replaced?
- Is there a deadline driving the sale (1031 exchange, divorce, estate, relocation)? That informs how much negotiation room exists.
- Schools are F-rated, which usually means shorter tenancies and higher turnover. Who's the typical renter profile here, and what's been the actual vacancy rate?
- The area grade is low — what's the realistic commute time and amenity access for the typical tenant pool here? Any planned neighborhood developments (good or bad) we should know about?
- What's the average days-on-market for RENTAL listings here right now (not sales)? A rising rental-DOM trend means longer vacancies and softer asking-rent achievability than the comps imply.
- What's the recent tenant-quality profile in this submarket — average credit score on applications, eviction rate, late-payment / NSF rate, and stable-employment percentage? A property-management company in the area should have these aggregated.
- How much new for-sale + rental construction is in the pipeline within 1–3 miles? Heavy new supply typically softens prices + rents 12–24 months out; constrained supply supports both.
Investment metrics
- 1% rule
- 0.97% ✗
- Cap rate
- 6.47%
- Cash-on-cash
- 0.65%
- DSCR
- 1.03
- GRM
- 8.6
CMA / ARV
- ARV (median comp)
- $214,029
- List price
- $214,900
- Delta
- 0.41%
- Verdict
- FAIR
- Comps
- 20 within 1.0 mi
Show comp detail 11 sales within ~0.75 mi
| Address | Dist | Beds/Ba | Sqft | Sold | Price | $/sf | Match |
|---|---|---|---|---|---|---|---|
| 939 Stave Oak Dr | 0.48mi | 4/2.5 (+1) | 2,124 (-8%) | 2mo | $350,000 | $165 | 53 |
| 5150 Arling Dr | 0.73mi | 4/2.5 (+1) | 2,240 (-2%) | 6mo | $340,000 | $152 | 46 |
| 3510 Chamberlin Dr | 0.65mi | 3/2.0 | 2,080 (-10%) | 6mo | $203,000 | $98 | 45 |
| 4430 Dudley North Dr | 0.56mi | 3/1.5 | 2,112 (-8%) | 21mo | $225,000 | $107 | 41 |
| 5051 Arling Ct | 0.68mi | 3/2.5 | 2,025 (-12%) | 4mo | $325,000 | $160 | 39 |
| 5108 Arling Dr | 0.71mi | 4/2.5 (+1) | 2,474 (+8%) | 8mo | $345,000 | $139 | 36 |
| 3926 Meridee Dr | 0.66mi | 3/2.5 | 2,141 (-7%) | 20mo | $350,000 | $163 | 35 |
| 3515 Lindbergh Dr | 0.66mi | 3/1.5 | 2,610 (+14%) | 15mo | $250,000 | $96 | 32 |
| 5524 Coventry Park Way | 0.65mi | 2/2.5 (-1) | 2,036 (-11%) | 13mo | $350,000 | $172 | 29 |
| 5524 Cherry Blossom Ct | 0.69mi | 4/2.5 (+1) | 1,999 (-13%) | 13mo | $315,000 | $158 | 24 |
| 4833 Coventry Park Blvd | 0.72mi | 2/2.0 (-1) | 1,968 (-14%) | 22mo | $348,000 | $177 | 14 |
Match score weights: distance 35% · size 25% · config 20% · recency 20%. Top-matched comps best support the ARV.
Projected returns pro-forma
-3.0% appreciation · 3.0% rent growth · sell at horizon
- IRR
- -15.2%
- Equity multiple
- 0.46×
- Total profit
- $-32,637
- Equity at exit
- $32,042
- IRR
- -6.5%
- Equity multiple
- 0.58×
- Total profit
- $-25,301
- Equity at exit
- $18,581
Cash invested: $60,172 (down + closing). Projections, not guarantees.
Landlord ↔ Tenant lean methodology
- Overall (STATE)
- 90 Strongly Landlord-Friendly
- State Indiana
- 90 Strongly Landlord-Friendly · R+11
- County
- — inherits STATE
- City
- — inherits STATE
ZIP-level market 46107
- Home prices YoY
- -29.1%
- Active inventory
- 75
- Price-to-rent
- 8.6×
Monthly cashflow live
- Estimated rent
- $2,083 high interval (Pro) →
- Mortgage (P&I)
- −$1,127
- Tax from tax record
- −$396 /mo · $4,756/yr
- Insurance
- −$90
- HOA
- −$0
- Vacancy / Maint / Mgmt
- −$437
- Net cashflow
- $33
Break-even live
Sensitivity live
| Price | -10% $154 | -5% $93 | +0% $33 | +5% $-28 | +10% $-89 |
|---|---|---|---|---|---|
| Rent | -10% $-132 | -5% $-50 | +0% $33 | +5% $115 | +10% $197 |
| Rate | -1.0pp $141 | -0.5pp $87 | base $33 | +0.5pp $-23 | +1.0pp $-80 |
UW: 25.0% down · 7.5% · 30yr · 1.5% tax · 5.0% vac · 8.0% maint · 8.0% mgmt
Financing live
Cash to close
- Down payment
- $53,725
- Closing costs
- $6,447
- Reserves months
- —
- Total cash needed
- —
Loan-product check · same deal, 3 products live
Conventional
25% down · 7.5% · 30yr
- Down + closing
- —
- Monthly P&I
- —
- Monthly cashflow
- —
- DSCR
- —
- Eligible?
- —
Personal DTI + credit; lowest rate.
DSCR
20% down · 8.5% · 30yr
- Down + closing
- —
- Monthly P&I
- —
- Monthly cashflow
- —
- DSCR
- —
- Eligible?
- —
No personal income docs; deal must DSCR.
Hard money
10% down · 12.0% · 12mo
- Down + closing
- —
- Monthly P&I
- —
- Monthly cashflow
- —
- DSCR
- —
- Eligible?
- —
Short-term bridge; refi at stabilization.
Rent comps 6 comps
| Address | Beds | Baths | Sqft | Rent | $/sqft | DOM | Units | Dist |
|---|---|---|---|---|---|---|---|---|
| 418 Andrea Dr Beech Grove, IN | 4.0 | 2.0 | 1626 | $1,836 | $1.13 | 25d | 1 | 0.31mi |
| 5343 S Linwood Ave Indianapolis, IN | 4.0 | 2.5 | 2268 | $3,000 | $1.32 | 14d | 1 | 0.41mi |
| 5500 S Emerson Ave Indianapolis, IN | 2.0–3.0 | 2.5 | 1492 | $2,175 | $1.46 | 0d | 2 | 0.67mi |
| 5310 Shelbyville Rd Indianapolis, IN | 4.0 | 2.0 | 1860 | $1,850 | $0.99 | 0d | 1 | 1.00mi |
| 2946 Carson Dr Indianapolis, IN | 3.0 | 3.0 | 1590 | $1,600 | $1.01 | 4d | 1 | 1.35mi |
| 4233 Carson Ln Indianapolis, IN | 4.0 | 3.0 | 1590 | $1,750 | $1.10 | 25d | 1 | 1.37mi |
Listing history 6 events
-
2026-05-05status Pending 932-char remark
Show marketing remark (932 chars)
Welcome to this spacious 4-bedroom, 2-bath single-family home located in the heart of Beech Grove. Built in 1970, this well-maintained residence offers a comfortable and functional layout with approximately 1407 square feet of living space, providing plenty of room for everyday living and entertaining. The home features a practical floor plan with generous living areas, an eat-in kitchen, and ample natural light throughout. Situated in an established neighborhood within Beech Grove, the property offers a quiet residential setting while still providing convenient access to schools, parks, shopping, and major roadways leading into nearby Indianapolis. With its solid structure and versatile layout, this home presents an excellent opportunity for both homeowners and investors. Whether you're looking to move in and personalize or expand your portfolio, this property offers strong long-term potential in a desirable location.
-
2026-04-17$214,900 Active 932-char remark
Show marketing remark (932 chars)
Welcome to this spacious 4-bedroom, 2-bath single-family home located in the heart of Beech Grove. Built in 1970, this well-maintained residence offers a comfortable and functional layout with approximately 1407 square feet of living space, providing plenty of room for everyday living and entertaining. The home features a practical floor plan with generous living areas, an eat-in kitchen, and ample natural light throughout. Situated in an established neighborhood within Beech Grove, the property offers a quiet residential setting while still providing convenient access to schools, parks, shopping, and major roadways leading into nearby Indianapolis. With its solid structure and versatile layout, this home presents an excellent opportunity for both homeowners and investors. Whether you're looking to move in and personalize or expand your portfolio, this property offers strong long-term potential in a desirable location.
-
2022-01-24$145,000 Active
-
2013-08-23historical
-
2013-08-22soldstatus $52,500
-
2013-06-28$54,900
ⓘ Source: listings_history table (triggers on properties + properties_extension) + one-shot
backfill from property_details.listing_events for pre-trigger history.
Tax reassessment forecast IN · Partial reset (capped growth)
- Current annual tax
- $4,756 · $396/mo
- Projected year-2 tax
- $4,756 · $396/mo
- Expected delta
- $0/yr ($0/mo · 0.0%)
ⓘ Screening estimate from a state-policy table — verify with the county assessor before closing.
Climate risk First Street
- Flood 1/10 Low FEMA zone X (unshaded) · 0% chance over 30 yrs
- Wildfire 1/10 Low
- Heat 4/10 Moderate 7 d/yr ≥102°F today · 19 d/yr by 30 yrs out
- Wind 2/10 Low 100% chance of damaging wind over 30 yrs
- Air quality 3/10 Moderate 2 unhealthy d/yr today · 3 by 30 yrs out
Nearby sold comps map
Loading sold comps map…
Walkable amenities ~0.75 mi
Loading nearby amenities…
Taxation est. · year 1
- Rental income
- $24,994
- − Mortgage interest
- −$12,038
- − Property taxes
- −$4,756
- − Insurance
- −$1,074
- − Repairs & maintenance
- −$2,000
- − Management
- −$2,000
- − Depreciation
- −$6,252
- Taxable loss
- −$3,125
- Est. tax savings @ 24.0%
- +$750
- After-tax cash flow
- $1,141/yr
For passive investors: Depreciation is non-cash, so a rental often shows a tax loss while cash-flowing — sheltering income. Rental losses are passive: they offset passive income freely, and up to $25,000/yr can offset ordinary (W-2) income if you actively participate and your MAGI is under $100k (phasing out to $0 by $150k); unused losses carry forward. On sale, claimed depreciation is recaptured at up to 25%, and gains may owe capital-gains tax (a 1031 exchange can defer both). Figures are a year-1 estimate at your 24.0% rate — not tax advice; consult a CPA.
Schools (NCES district)
- District
- Beech Grove City Schools
- NCES district ID
- 1800450
- Math proficiency
- 17% ▼ -8.00%
- Reading proficiency
- 29% ▼ -6.00%
- Median HH income
- $38,775
- Composite
- 19.28/100
- National rank
- #8802
- State rank
- #269 of 301 in IN
Livability — Beech Grove
- Score
- 63/100
- State rank
- #418
- US rank
- #15174
Category grades
Schools grade is shown separately in the Schools card above.
Census & demographics
- Census place
- Beech Grove, IN
- County
- Marion County · 998,460 people
- City population
- 13,020
- Metro
- Indianapolis-Carmel-Anderson, IN
- Population (ZIP)
- 13,020
- Household income
- $56,799
- Rent vs Own
- Severe rent burden
- 326.0
Population outlook (Marion County) Hauer SSP2
- Today (2025)
- 1,025,572 people
- By 2030
- 1,065,727 · +3.9%
- By 2040
- 1,141,577 · +11.3%
- By 2050
- 1,208,920 · +17.9%
- By 2075
- 1,367,288 · +33.3%
- By 2100
- 1,438,201 · +40.2%
Race, ethnicity, and origin ACS 2023
- Neighborhood character
- Predominantly White (88%)
- Race & ethnicity
- White 88% Hispanic / Latino 6% Two or more races 4% Black 2%
- Hispanic origin (detail)
- Mexican 4%
- Common ancestry
- Slovak 3% Romanian 2% Iranian 2%
- Foreign-born
- 3% · Canada, Jamaica
- Languages at home
- 97% English-only · Spanish 2% Other Indo-European 1%
Political lean MEDSL · Marion
- 2024 margin
- Strong D (+27.7) · D 63.0% · R 35.3% · Other 1.7%
- 2008→2024 swing
- -0.7pp no change · 2008: 28.4pp · 2024: 27.7pp
- All cycles
- 2024: D+27.7 2020: D+29.1 2016: D+22.8 2012: D+22.2 2008: D+28.4
Not yet ingested
- Civics
- —
Market trends
- HPI YoY
- ▼ -112.00%
- Current HPI
- 272.2969
- Rent YoY
- —
- Metro
- Indianapolis-Carmel-Anderson, IN
- State GDP YoY
- ▲ 2.90%
- F500 in state
- 18
Industry mix (Fortune 500 HQ in IN)
| Industry | F500 HQs | Revenue |
|---|---|---|
| Industrial Machinery | 2 | $37B |
|
||
| Healthcare | 1 | $177B |
|
||
| Pharmaceuticals | 1 | $45B |
|
||
| Metals / Steel | 1 | $18B |
|
||
| Agriculture | 1 | $17B |
|
||
| Packaging | 1 | $12B |
|
||
Price history
+291.4% since first listed6 events — show timeline
- 2026-05-05 Pending — MIBOR as Distributed by MLS Grid
- 2026-04-17 Listed $214,900 MIBOR as Distributed by MLS Grid
- 2022-01-24 Listed $145,000 MIBOR as Distributed by MLS Grid
- 2013-08-23 Listing Removed — MIBOR as Distributed by MLS Grid
- 2013-08-22 Sold (MLS) $52,500 MIBOR as Distributed by MLS Grid
- 2013-06-28 Listed $54,900 MIBOR as Distributed by MLS Grid
Property tax history
+6.8%/yrLatest (2025): $4,756 · +1.8% YoY. Source: county tax records.
Cash-flow waterfall
monthlySold comps — $/sqft
last 12 mo · ≤1 miLoading sold comps…