3916 Gray Ave SW · Birmingham, AL
Flood risk 1/10 · Minimal
- FEMA flood zone
- X (unshaded)
- Chance of flooding over 30 yrs
- 0.0%
- Est. flood insurance / yr
- $507 – $1,088
Fire risk 3/10 · Minor
- Est. fire insurance / yr
- $916 – $1,700
Heat risk 7/10 · Major
- Hot days now (above 108°F)
- 7 days/yr
- Hot days in 30 yrs
- 20 days/yr
Wind risk 6/10 · Moderate
- Chance of severe wind over 30 yrs
- 27.0%
Air-quality risk 4/10 · Minor
- Unhealthy air days now
- 5 days/yr
- Unhealthy air days in 30 yrs
- 5 days/yr
Risk factors via First Street. Map © Google.
Why this score? — see what drove the B+ grade
The composite is a weighted blend of 9 inputs, each scored 0–100. Each bar is that input's sub-score; the figure is the points it added to the 100-point composite (weight × sub-score).
- Cash flow +30.0/30.0
- ARV discount +15.0/15.0
- 1% rule +10.0/10.0
- DSCR +10.0/10.0
- Appreciation +4.3/10.0
- Livability +3.4/5.0
- Rent growth +2.5/5.0
- Condition / age +2.5/5.0
- Schools +0.9/10.0
$34,500
🖨 Deal sheet (PDF) 📄 Offer letter ✓ Due diligence
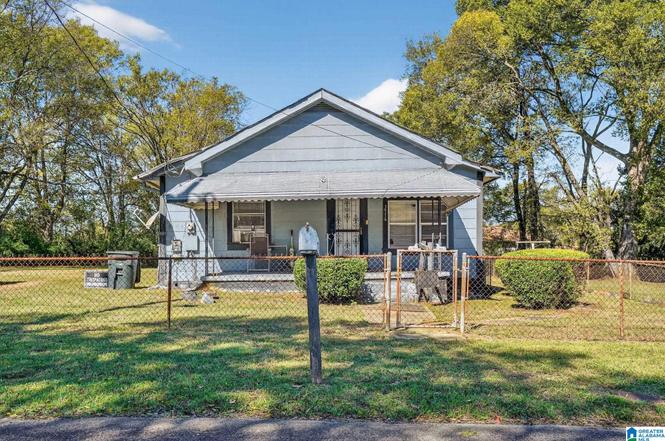
Listing remarks
2 bedroom/1 bathroom home offering 1,024 sq. ft. of living space. This property sits on a 0.32 acre lot. The kitchen features wooden cabinets, granite countertops, and laminate flooring, while the living room has hardwood floors and a window A/C. Bedrooms include window A/C units and closet nooks, and the bathroom features laminate flooring and a wall-mounted heater. There’s also a dedicated laundry area. The property is fully fenced with a covered front patio. The backyard is maintained with trimmed grass and includes a small storage area. Plumbing is connected to the city and in good working order, with no major electrical or foundation issues. Though vacant for two years, the prope
Key facts
- Laminate flooring
- Fully fenced
- Wooden cabinets
Tags
Neighborhood map
What this means for you Summary
Snapshot
- This is a 2-bed/1.0-bath single-family listed at $34k.
Deal economics
- At list price, monthly cash flow is $599 ($7k/yr) — positive.
- The deal already cash-flows at list — no discount required.
- Meets the 1% rule at list price ($1k rent vs $34k).
- Recommended offer: $32k (6.0% below list) — sets the bar for market timing.
- Cap rate 27.1% vs local median 6.2% in Birmingham — top-decile yield for the area; either an underpriced asset or a hidden risk that comps aren't pricing in. Stress-test before assuming the spread holds.
Location & tenants
- Location reads 67/100 on livability (#78 in AL) — a middle-class / working-renter tenant base. Strengths: commute A+, cost of living A+, housing A+; Watch: amenities C-, crime F, employment F.
- Birmingham City (urban): math 4% / reading 20% proficiency, ranked #116 of 129 in AL (top 90%) — low school quality limits family demand, transient renter base, plan for 1-2y turnover; 82% free/reduced lunch — lower-income household profile, screen leases tightly.
- Zoned schools: Wenonah High School (math 2% / reading 2%, grade F, #291 of 305 statewide, top 100%, 656 students, 85% FRL) — zoned schools at 85% FRL track the district average.
- Market conditions: 26 active listings in the ZIP; 33 comparable units currently listed for rent nearby; rentals at typical pace (median 26d on market — plan ~3-4 weeks tenant-placement turnaround); 45% of comp listings sitting > 30 days — soft ceiling on asking rent; 2,114 units permitted in Jefferson County in 2024 (556 in 5+ unit buildings).
Forward outlook
- Local home prices are declining (-1.3%/yr); year-one equity from $239 of loan paydown is wiped out by about $454 of value loss. Plan a longer hold.
- Jefferson County population projected to shrink 4% by 2050 — rents likely to lag national; underwrite the cash flow, not the appreciation.
- At projected returns (-1.3% appreciation + 3.0% rent growth), your $10k cash investment doubles in ~2 years — after that, you're playing with house money.
Negotiation context
- It's been on market 67 days — a 6% lower offer ($32k) is reasonable based on typical stale-listing flexibility.
- Current owner paid $13k; list at $34k implies a 170% gain — meaningful room to come down on a strong offer.
Risks & watch-outs
- Watch-outs: built in 1930 — expect roof / HVAC / electrical / plumbing capex.
- Climate carrying-cost: major wind risk, 27% chance of damaging wind over 30y; extreme-heat days projected 7→20/yr by 2055 (HVAC capex compounding) — expect insurance premiums to compound above CPI over the hold.
Questions for the listing agent
- It's been on market 67 days. Have you received any prior offers? Is the seller open to a 6% concession, seller financing, or rate buy-down credit?
- Built in 1930 — when were the roof, HVAC, electrical panel, plumbing, and water heater last replaced?
- Why hasn't it sold? Are there any deal-killer items the seller is aware of (foundation, flood, title, zoning, code violations)?
- Is there a deadline driving the sale (1031 exchange, divorce, estate, relocation)? That informs how much negotiation room exists.
- Schools are F-rated, which usually means shorter tenancies and higher turnover. Who's the typical renter profile here, and what's been the actual vacancy rate?
- Crime grade is F in this area — have there been break-ins, vandalism, or insurance claims at this property in the last 3 years? What carrier currently insures it and at what premium?
- What's the average days-on-market for RENTAL listings here right now (not sales)? A rising rental-DOM trend means longer vacancies and softer asking-rent achievability than the comps imply.
- What's the recent tenant-quality profile in this submarket — average credit score on applications, eviction rate, late-payment / NSF rate, and stable-employment percentage? A property-management company in the area should have these aggregated.
- How much new for-sale + rental construction is in the pipeline within 1–3 miles? Heavy new supply typically softens prices + rents 12–24 months out; constrained supply supports both.
Investment metrics
- 1% rule
- 3.12% ✓
- Cap rate
- 27.14%
- Cash-on-cash
- 74.44%
- DSCR
- 4.31
- GRM
- 2.7
CMA / ARV
- ARV (on-the-fly)
- $67,584
- Comps found
- 12
Show comp detail 12 sales within ~0.75 mi
| Address | Dist | Beds/Ba | Sqft | Sold | Price | $/sf | Match |
|---|---|---|---|---|---|---|---|
| 3729 Pine Ave SW | 0.24mi | 3/1.0 (+1) | 1,067 (+4%) | 6mo | $70,000 | $66 | 72 |
| 4100 Park Ave | 0.18mi | 3/1.0 (+1) | 1,125 (+10%) | 10mo | $82,500 | $73 | 61 |
| 1505 Collier Dr | 0.58mi | 3/1.0 (+1) | 992 (-3%) | 4mo | $60,000 | $60 | 59 |
| 3417 Maple Ave SW | 0.55mi | 2/1.0 | 910 (-11%) | 2mo | $50,000 | $55 | 54 |
| 3720 Howard Ave SW | 0.58mi | 3/1.0 (+1) | 1,092 (+7%) | 6mo | $64,000 | $59 | 52 |
| 1628 Collier Dr | 0.70mi | 3/1.0 (+1) | 995 (-3%) | 13mo | $78,000 | $78 | 47 |
| 520 Midway St | 0.64mi | 2/1.0 | 904 (-12%) | 5mo | $33,000 | $37 | 47 |
| 3321 Cedar Ave SW | 0.68mi | 3/1.0 (+1) | 1,100 (+7%) | 10mo | $65,000 | $59 | 42 |
| 4008 Grasselli Ave | 0.55mi | 3/1.0 (+1) | 1,153 (+13%) | 8mo | $85,000 | $74 | 41 |
| 1037 Daniel Dr | 0.71mi | 2/1.0 | 904 (-12%) | 9mo | $88,000 | $97 | 40 |
| 3008 Elmyra Dr | 0.67mi | 3/2.0 (+1) | 1,104 (+8%) | 13mo | $88,000 | $80 | 36 |
| 3304 Spaulding St SW | 0.64mi | 3/2.0 (+1) | 1,140 (+11%) | 8mo | $40,000 | $35 | 35 |
Match score weights: distance 35% · size 25% · config 20% · recency 20%. Top-matched comps best support the ARV.
Projected returns pro-forma
-1.32% appreciation · 3.0% rent growth · sell at horizon
- IRR
- 75.6%
- Equity multiple
- 4.63×
- Total profit
- $35,099
- Equity at exit
- $7,805
- IRR
- 78.2%
- Equity multiple
- 9.50×
- Total profit
- $82,114
- Equity at exit
- $7,758
Cash invested: $9,660 (down + closing). Projections, not guarantees.
Landlord ↔ Tenant lean methodology
- Overall (STATE)
- 90 Strongly Landlord-Friendly
- State Alabama
- 90 Strongly Landlord-Friendly · R+15
- County
- — inherits STATE
- City
- — inherits STATE
ZIP-level market 35221
- Home prices YoY
- -1.1%
- Active inventory
- 26
- Price-to-rent
- 2.7×
Monthly cashflow live
- Estimated rent
- $1,076 high interval (Pro) →
- Mortgage (P&I)
- −$181
- Tax from tax record
- −$56 /mo · $667/yr
- Insurance
- −$14
- HOA
- −$0
- Vacancy / Maint / Mgmt
- −$226
- Net cashflow
- $599
Break-even live
Sensitivity live
| Price | -10% $619 | -5% $609 | +0% $599 | +5% $589 | +10% $580 |
|---|---|---|---|---|---|
| Rent | -10% $514 | -5% $557 | +0% $599 | +5% $642 | +10% $684 |
| Rate | -1.0pp $617 | -0.5pp $608 | base $599 | +0.5pp $590 | +1.0pp $581 |
UW: 25.0% down · 7.5% · 30yr · 1.5% tax · 5.0% vac · 8.0% maint · 8.0% mgmt
Financing live
Cash to close
- Down payment
- $8,625
- Closing costs
- $1,035
- Reserves months
- —
- Total cash needed
- —
Loan-product check · same deal, 3 products live
Conventional
25% down · 7.5% · 30yr
- Down + closing
- —
- Monthly P&I
- —
- Monthly cashflow
- —
- DSCR
- —
- Eligible?
- —
Personal DTI + credit; lowest rate.
DSCR
20% down · 8.5% · 30yr
- Down + closing
- —
- Monthly P&I
- —
- Monthly cashflow
- —
- DSCR
- —
- Eligible?
- —
No personal income docs; deal must DSCR.
Hard money
10% down · 12.0% · 12mo
- Down + closing
- —
- Monthly P&I
- —
- Monthly cashflow
- —
- DSCR
- —
- Eligible?
- —
Short-term bridge; refi at stabilization.
Rent comps 33 comps
| Address | Beds | Baths | Sqft | Rent | $/sqft | DOM | Units | Dist |
|---|---|---|---|---|---|---|---|---|
| 3736 Oak Ave SW Birmingham, AL | 3.0 | 2.0 | 984 | $1,050 | $1.07 | 25d | 1 | 0.21mi |
| 3729 Maple Ave SW Birmingham, AL | 3.0 | 2.0 | 1008 | $1,200 | $1.19 | 45d | 1 | 0.23mi |
| 3729 Pine Ave SW Birmingham, AL | 3.0 | 1.0 | 1067 | $1,100 | $1.03 | 23d | 1 | 0.25mi |
| 4029 Walnut Ave SW Birmingham, AL | 2.0 | 1.0 | 1300 | $1,369 | $1.05 | 5d | 1 | 0.29mi |
| 3616 Maple Ave SW Birmingham, AL | 2.0 | 1.0 | 1488 | $950 | $0.64 | 45d | 1 | 0.37mi |
| 4120 George Ave SW Birmingham, AL | 2.0 | 1.0 | 944 | $850 | $0.90 | 25d | 1 | 0.50mi |
| 1441 Creel St Birmingham, AL | 3.0 | 2.0 | 1319 | $1,275 | $0.97 | 5d | 1 | 0.58mi |
| 4009 Grasselli Ave SW Birmingham, AL | 3.0 | 1.0 | 875 | $900 | $1.03 | 25d | 1 | 0.60mi |
| 3720 Howard Ave SW Birmingham, AL | 3.0 | 1.0 | 1092 | $1,200 | $1.10 | 25d | 1 | 0.60mi |
| 3400 Walnut Ave SW Birmingham, AL | 3.0 | 1.0 | 1133 | $1,200 | $1.06 | 45d | 1 | 0.63mi |
| 1433 Rayfield Dr Birmingham, AL | 3.0 | 1.0 | 1064 | $950 | $0.89 | 45d | 1 | 0.69mi |
| 3332 Walnut Ave SW Birmingham, AL | 3.0 | 1.0 | 1339 | $750 | $0.56 | 21d | 1 | 0.70mi |
| 2804 32nd Way SW Birmingham, AL | 3.0 | 1.0 | 840 | $900 | $1.07 | 45d | 1 | 0.72mi |
| 408 Midway St Birmingham, AL | 3.0 | 1.0 | 1301 | $1,075 | $0.83 | 21d | 1 | 0.73mi |
| 2805 32nd Way SW Birmingham, AL | 3.0 | 1.0 | 792 | $900 | $1.14 | 45d | 1 | 0.75mi |
| 1376 Creel Ct Birmingham, AL | 3.0 | 1.0 | 1008 | $1,000 | $0.99 | 45d | 1 | 0.76mi |
| 1112 S Gale Dr Birmingham, AL | 3.0 | 1.5 | 1053 | $1,175 | $1.12 | 45d | 1 | 0.76mi |
| 1721 Collier Dr Birmingham, AL | 2.0 | 1.0 | 925 | $800 | $0.86 | 45d | 1 | 0.78mi |
| 1412 Woodward Rd Birmingham, AL | 3.0 | 1.0 | 1220 | $1,203 | $0.99 | 18d | 1 | 0.79mi |
| 537 Grant St Birmingham, AL | 3.0 | 1.0 | 1444 | $1,200 | $0.83 | 25d | 1 | 0.81mi |
| 517 Grant St Birmingham, AL | 3.0 | 1.0 | 912 | $850 | $0.93 | 25d | 1 | 0.87mi |
| 120 Parkwood St Birmingham, AL | 3.0 | 1.5 | 1224 | $1,150 | $0.94 | 18d | 1 | 0.92mi |
| 336 McPherson Ave Birmingham, AL | 3.0 | 1.0 | 1094 | $1,100 | $1.01 | 25d | 1 | 0.93mi |
| 340 McPherson Ave Birmingham, AL | 2.0 | 1.0 | 924 | $910 | $0.98 | 45d | 1 | 0.94mi |
| 3640 Wenonah Rd SW Birmingham, AL | 3.0 | 2.0 | 1100 | $1,195 | $1.09 | 25d | 1 | 0.98mi |
| 3640 Wenonah Rd SW Birmingham, AL | 3.0 | 2.0 | 1100 | $1,195 | $1.09 | 13d | 1 | 0.98mi |
| 1417 Brighton Rd Birmingham, AL | 3.0 | 2.0 | 1048 | $1,200 | $1.15 | 45d | 1 | 0.99mi |
| 2300 31st St SW Unit ENSLEY2316 A Birmingham, AL | 2.0 | 1.0 | 750 | $1,000 | $1.33 | 5d | 1 | 1.03mi |
| 830 Burwell St Birmingham, AL | 3.0 | 1.5 | 1011 | $1,200 | $1.19 | 45d | 1 | 1.06mi |
| 1838 31st St SW Birmingham, AL | 3.0 | 2.0 | 1400 | $1,223 | $0.87 | 18d | 1 | 1.25mi |
| 1272 Meadow Ln Birmingham, AL | 2.0 | 1.0 | 744 | $800 | $1.08 | 45d | 1 | 1.28mi |
| 3000 Dawson Ave SW Birmingham, AL | 3.0 | 1.0 | 1092 | $925 | $0.85 | 45d | 1 | 1.29mi |
| 1340 Pineview Rd Birmingham, AL | 3.0 | 2.0 | 1116 | $1,075 | $0.96 | 45d | 1 | 1.47mi |
Listing history 3 events
-
2025-12-30status Pending
-
2025-10-24$34,500 Active
-
1984-05-11soldstatus $12,800
ⓘ Source: listings_history table (triggers on properties + properties_extension) + one-shot
backfill from property_details.listing_events for pre-trigger history.
Tax reassessment forecast AL · Resets to sale price
- Current annual tax
- $667 · $56/mo
- Projected year-2 tax
- $667 · $56/mo
- Expected delta
- $0/yr ($0/mo · 0.0%)
ⓘ Screening estimate from a state-policy table — verify with the county assessor before closing.
Climate risk First Street
- Flood 1/10 Low FEMA zone X (unshaded) · 0% chance over 30 yrs
- Wildfire 3/10 Moderate
- Heat 7/10 Severe 7 d/yr ≥108°F today · 20 d/yr by 30 yrs out
- Wind 6/10 Major 27% chance of damaging wind over 30 yrs
- Air quality 4/10 Moderate 5 unhealthy d/yr today · 5 by 30 yrs out
Nearby sold comps map
Loading sold comps map…
Walkable amenities ~0.75 mi
Loading nearby amenities…
Taxation est. · year 1
- Rental income
- $12,913
- − Mortgage interest
- −$1,933
- − Property taxes
- −$667
- − Insurance
- −$172
- − Repairs & maintenance
- −$1,033
- − Management
- −$1,033
- − Depreciation
- −$1,004
- Taxable income
- $7,071
- Est. tax owed @ 24.0%
- −$1,697
- After-tax cash flow
- $5,494/yr
For passive investors: Depreciation is non-cash, so a rental often shows a tax loss while cash-flowing — sheltering income. Rental losses are passive: they offset passive income freely, and up to $25,000/yr can offset ordinary (W-2) income if you actively participate and your MAGI is under $100k (phasing out to $0 by $150k); unused losses carry forward. On sale, claimed depreciation is recaptured at up to 25%, and gains may owe capital-gains tax (a 1031 exchange can defer both). Figures are a year-1 estimate at your 24.0% rate — not tax advice; consult a CPA.
Schools (NCES district)
- District
- Birmingham City
- NCES district ID
- 0100390
- Math proficiency
- 4% ▼ -17.00%
- Reading proficiency
- 20% ▼ -4.00%
- Median HH income
- $31,988
- Composite
- 9.49/100
- National rank
- #9850
- State rank
- #116 of 129 in AL
Livability — Birmingham
- Score
- 67/100
- State rank
- #78
- US rank
- #10412
Category grades
Schools grade is shown separately in the Schools card above.
Census & demographics
- Census place
- Birmingham, AL
- City population
- 210,422
- Population (ZIP)
- 3,127
Population outlook (Jefferson County) Hauer SSP2
- Today (2025)
- 669,185 people
- By 2030
- 669,694 · +0.1%
- By 2040
- 661,388 · -1.2%
- By 2050
- 643,086 · -3.9%
- By 2075
- 577,267 · -13.7%
- By 2100
- 474,758 · -29.1%
Race, ethnicity, and origin ACS 2023
- Neighborhood character
- Predominantly Black (89%)
- Race & ethnicity
- Black 89% Two or more races 7% Hispanic / Latino 6% White 4%
- Hispanic origin (detail)
- Mexican 6%
- Foreign-born
- 3% · Canada
- Languages at home
- 93% English-only · Spanish 6%
Political lean MEDSL · Jefferson
- 2024 margin
- D (+10.4) · D 54.6% · R 44.2% · Other 1.2%
- 2008→2024 swing
- +5.4pp toward D · 2008: 5.1pp · 2024: 10.4pp
- All cycles
- 2024: D+10.4 2020: D+13.2 2016: D+7.2 2012: D+6.0 2008: D+5.1
Not yet ingested
- Civics
- —
Market trends
- HPI YoY
- ▼ -1.32%
- Current HPI
- 121.0566
- Rent YoY
- —
- Metro
- —
- State GDP YoY
- ▲ 2.94%
- F500 in state
- 4
Industry mix (Fortune 500 HQ in AL)
| Industry | F500 HQs | Revenue |
|---|---|---|
| Financial Services | 1 | $8B |
|
||
| Healthcare | 1 | $5B |
|
||
Price history
+169.5% since first listed3 events — show timeline
- 2025-12-30 Pending — Greater Alabama MLS
- 2025-10-24 Listed $34,500 Greater Alabama MLS
- 1984-05-11 Sold (Public Records) $12,800 Public Records
Property tax history
+0.2%/yrLatest (2025): $667 · +0.0% YoY. Source: county tax records.
Cash-flow waterfall
monthlySold comps — $/sqft
last 12 mo · ≤1 miLoading sold comps…