 Duplex
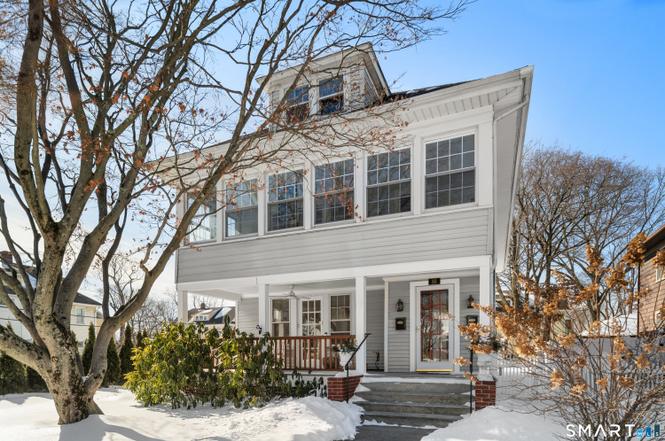
80 Gregory Blvd · Norwalk, CT
Flood risk 4/10 · Minor
- FEMA flood zone
- X (unshaded)
- Chance of flooding over 30 yrs
- 0.22%
- Est. flood insurance / yr
- $473 – $860
Fire risk 1/10 · Minimal
- Est. fire insurance / yr
- $829 – $1,539
Heat risk 6/10 · Moderate
- Hot days now (above 98°F)
- 7 days/yr
- Hot days in 30 yrs
- 16 days/yr
Wind risk 6/10 · Moderate
- Chance of severe wind over 30 yrs
- 75.0%
Air-quality risk 8/10 · Major
- Unhealthy air days now
- 13 days/yr
- Unhealthy air days in 30 yrs
- 18 days/yr
Risk factors via First Street. Map © Google.
Why this score? — see what drove the C- grade
The composite is a weighted blend of 9 inputs, each scored 0–100. Each bar is that input's sub-score; the figure is the points it added to the 100-point composite (weight × sub-score).
- Cash flow +20.2/30.0
- ARV discount +9.9/15.0
- DSCR +6.4/10.0
- 1% rule +4.9/10.0
- Livability +3.9/5.0
- Schools +3.4/10.0
- Condition / age +2.5/5.0
- Rent growth +2.3/5.0
- Appreciation +0.0/10.0
$949,000
🖨 Deal sheet 📄 Offer letter ✓ Due diligence
Multi-family units
County records classify this as Multi-Family (2-4 Unit). Listing-text estimate: 2 units. confirmed
Listing remarks
Whether you're looking to make a savvy investment or find a place to call home while someone else helps pay the mortgage, this charming two-family residence in the heart of East Norwalk is a rare find that checks every box. Perched on a spacious corner lot, this property immediately feels like home. It's the kind of place where you can envision slow Saturday mornings and easy coastal living. The first floor features a welcoming open porch-perfect for a couple of rocking chairs, a cold drink, and watching the neighborhood go by. Upstairs, the second unit offers a cozy enclosed porch, providing a private, sun-drenched sanctuary to enjoy your morning coffee or curl up with a good book, regardl
Key facts
- 7,405 sq ft lot
- 3 garage spots
- Built 1924
Neighborhood map
What this means for you Summary
Snapshot
- This is a 2 × 2-bed/1.0-bath units multifamily listed at $949k.
Deal economics
- At list price, monthly cash flow is $1k ($14k/yr) — positive. Per door: $600/mo.
- The deal already cash-flows at list — no discount required.
- To meet the 1% rule (rent ≥ 1% of price), the offer needs to be $939k (1.1% below list).
- Recommended offer: $935k (1.5% below list) — sets the bar for market timing.
- Cap rate 7.8% vs local median 3.4% in Norwalk — top-decile yield for the area; either an underpriced asset or a hidden risk that comps aren't pricing in. Stress-test before assuming the spread holds.
Location & tenants
- Location reads 77/100 on livability (#41 in CT, #2,966 nationally) — a middle-class / working-renter tenant base. Strengths: employment A+, health & safety A+, crime A; Watch: amenities C-, cost of living F.
- Norwalk School District (urban): math 29% / reading 44% proficiency, ranked #104 of 153 in CT (top 68%) — families likely to look elsewhere, expect single-tenant / working-renter base with shorter leases.
- Market conditions: Rents soft (-1.0%/yr); 40 active listings in the ZIP; 8 comparable units currently listed for rent nearby; rentals lingering (median 44d on market — plan ~5-8 weeks vacancy on turnover, expect pricing pressure); 50% of comp listings sitting > 30 days — soft ceiling on asking rent; solid renter incomes; 1,151 units permitted in Western Connecticut Planning Region in 2024 (714 in 5+ unit buildings).
- At $9,387/mo this rent would consume 106% of the median local household income ($106k/yr) (locally 462% of renters already pay >50% of income on rent) — very limited rent-growth headroom before tenants either downsize or default.
Forward outlook
- Local home prices are declining (-3.0%/yr); year-one equity from $7k of loan paydown is wiped out by about $28k of value loss. Plan a longer hold.
Negotiation context
- It's been on market 28 days — a 2% lower offer ($935k) is reasonable based on typical stale-listing flexibility.
- Current owner paid $565k; list at $949k implies a 68% gain — meaningful room to come down on a strong offer.
Risks & watch-outs
- Watch-outs: built in 1924 — expect roof / HVAC / electrical / plumbing capex.
- Climate carrying-cost: major wind risk, 75% chance of damaging wind over 30y; extreme-heat days projected 7→16/yr by 2055 (HVAC capex compounding) — expect insurance premiums to compound above CPI over the hold.
Questions for the listing agent
- Can we see the unit-by-unit rent roll, current vacancy, and any below-market leases? What's the average tenancy length?
- What capital expenditures (roof, boiler, parking lot, exteriors) have been made in the last 5 years, and what's planned in the next 2?
- Built in 1924 — when were the roof, HVAC, electrical panel, plumbing, and water heater last replaced?
- Is there a deadline driving the sale (1031 exchange, divorce, estate, relocation)? That informs how much negotiation room exists.
- What's the average days-on-market for RENTAL listings here right now (not sales)? A rising rental-DOM trend means longer vacancies and softer asking-rent achievability than the comps imply.
- What's the recent tenant-quality profile in this submarket — average credit score on applications, eviction rate, late-payment / NSF rate, and stable-employment percentage? A property-management company in the area should have these aggregated.
- How much new apartment / multifamily construction is in the pipeline within 1–3 miles? Heavy new supply (>2% of stock underway) typically softens rents 12–24 months out; light construction supports rent growth.
Investment metrics
- 1% rule
- 0.99% ✗
- Cap rate
- 7.81%
- Cash-on-cash
- 5.42%
- DSCR
- 1.24
- GRM
- 8.4
CMA / ARV
- ARV (on-the-fly)
- $1,001,520
- Comps found
- 2
Show comp detail 2 sales within ~0.75 mi
| Address | Dist | Beds/Ba | Sqft | Sold | Price | $/sf | Match |
|---|---|---|---|---|---|---|---|
| 80 Gregory Blvd | 0.00mi | 4/2.0 | 3,120 (0%) | 0mo | $915,000 | $293 | 100 |
| 38 Gregory Blvd | 0.22mi | 5/4.0 (+1) | 3,315 (+6%) | 5mo | $1,062,500 | $321 | 62 |
Match score weights: distance 35% · size 25% · config 20% · recency 20%. Top-matched comps best support the ARV.
Projected returns pro-forma
-3.0% appreciation · 0.0% rent growth · sell at horizon
- IRR
- -11.2%
- Equity multiple
- 0.61×
- Total profit
- $-104,919
- Equity at exit
- $141,499
- IRR
- -6.7%
- Equity multiple
- 0.63×
- Total profit
- $-99,529
- Equity at exit
- $82,052
Cash invested: $265,720 (down + closing). Projections, not guarantees.
Landlord ↔ Tenant lean methodology
- Overall (STATE)
- 27 Tenant-Leaning
- State Connecticut
- 27 Tenant-Leaning · D+7
- County
- — inherits STATE
- City
- — inherits STATE
ZIP-level market 06855
- Home prices YoY
- -29.4%
- Rents YoY
- -1.0%
- Active inventory
- 40
- Price-to-rent
- 16.8×
Monthly cashflow live
- Estimated rent
- $9,387 high interval (Pro) →
- Mortgage (P&I)
- −$4,977
- Tax from tax record
- −$844 /mo · $10,122/yr
- Insurance
- −$395
- HOA
- −$0
- Vacancy / Maint / Mgmt
- −$1,971
- Net cashflow
- $1,200
Break-even live
2-unit breakdown (identical units grouped — click to expand)
| Units | Beds | Baths | Est. rent |
|---|---|---|---|
| 2× units | 2 | 1 | $9,388 |
| #1 | 2 | 1 | $4,694 |
| #2 | 2 | 1 | $4,694 |
| Total (2 units) | $9,387 | ||
UW: 25.0% down · 7.5% · 30yr · 1.5% tax · 5.0% vac · 8.0% maint · 8.0% mgmt
Financing live
Cash to close
- Down payment
- $237,250
- Closing costs
- $28,470
- Reserves months
- —
- Total cash needed
- —
Loan-product check · same deal, 3 products live
Conventional
25% down · 7.5% · 30yr
- Down + closing
- —
- Monthly P&I
- —
- Monthly cashflow
- —
- DSCR
- —
- Eligible?
- —
Personal DTI + credit; lowest rate.
DSCR
20% down · 8.5% · 30yr
- Down + closing
- —
- Monthly P&I
- —
- Monthly cashflow
- —
- DSCR
- —
- Eligible?
- —
No personal income docs; deal must DSCR.
Hard money
10% down · 12.0% · 12mo
- Down + closing
- —
- Monthly P&I
- —
- Monthly cashflow
- —
- DSCR
- —
- Eligible?
- —
Short-term bridge; refi at stabilization.
Rent comps 8 comps
| Address | Beds | Baths | Sqft | Rent | $/sqft | DOM | Units | Dist |
|---|---|---|---|---|---|---|---|---|
| 50 Shorefront Park Norwalk, CT | 4.0 | 3.5 | 3048 | $22,000 | $7.22 | 14d | 1 | 0.71mi |
| 50 Shorefront Park Norwalk, CT | 4.0 | 3.5 | 3248 | $22,000 | $6.77 | 21d | 1 | 0.71mi |
| 4 Covlee Dr Westport, CT | 4.0 | 3.5 | 2935 | $9,500 | $3.24 | 43d | 1 | 1.00mi |
| 41 N Main St Norwalk, CT | 3.0 | 2.0 | 2500 | $5,000 | $2.00 | 43d | 1 | 1.01mi |
| 6 Plover Ln Westport, CT | 4.0 | 4.5 | 3540 | $15,500 | $4.38 | 23d | 1 | 1.19mi |
| 515 West Ave Norwalk, CT | 1.0–3.0 | 1.0–2.0 | 1532 | $4,853 | $3.17 | 19d | 48 | 1.37mi |
| 4 Spriteview Ave Westport, CT | 3.0 | 3.0 | 2404 | $35,000 | $14.56 | 43d | 1 | 1.43mi |
| 18 Soundview Ave Unit 1 Norwalk, CT | 3.0 | 1.0 | 3168 | $3,000 | $0.95 | 43d | 1 | 1.50mi |
Listing history 5 events
-
2026-04-10status Under Contract
-
2026-03-25historical Under Contract - Continue to Show
-
2026-03-14$949,000 Active
-
2026-03-07historical $949,000
-
2019-01-07soldstatus $565,000
ⓘ Source: listings_history table (triggers on properties + properties_extension) + one-shot
backfill from property_details.listing_events for pre-trigger history.
Tax reassessment forecast CT · Partial reset (capped growth)
- Current annual tax
- $10,122 · $844/mo
- Projected year-2 tax
- $15,215 · $1,268/mo
- Expected delta
- +$5,093/yr (+$424/mo · 50.3%)
ⓘ Screening estimate from a state-policy table — verify with the county assessor before closing.
Climate risk First Street
- Flood 4/10 Moderate FEMA zone X (unshaded) · 22% chance over 30 yrs
- Wildfire 1/10 Low
- Heat 6/10 Major 7 d/yr ≥98°F today · 16 d/yr by 30 yrs out
- Wind 6/10 Major 75% chance of damaging wind over 30 yrs
- Air quality 8/10 Severe 13 unhealthy d/yr today · 18 by 30 yrs out
Nearby sold comps map
Loading sold comps map…
Walkable amenities ~0.75 mi
Loading nearby amenities…
Taxation est. · year 1
- Rental income
- $112,644
- − Mortgage interest
- −$53,159
- − Property taxes
- −$10,122
- − Insurance
- −$4,745
- − Repairs & maintenance
- −$9,012
- − Management
- −$9,012
- − Depreciation
- −$27,607
- Taxable loss
- −$1,012
- Est. tax savings @ 24.0%
- +$243
- After-tax cash flow
- $14,645/yr
For passive investors: Depreciation is non-cash, so a rental often shows a tax loss while cash-flowing — sheltering income. Rental losses are passive: they offset passive income freely, and up to $25,000/yr can offset ordinary (W-2) income if you actively participate and your MAGI is under $100k (phasing out to $0 by $150k); unused losses carry forward. On sale, claimed depreciation is recaptured at up to 25%, and gains may owe capital-gains tax (a 1031 exchange can defer both). Figures are a year-1 estimate at your 24.0% rate — not tax advice; consult a CPA.
Schools (NCES district)
- District
- Norwalk School District
- NCES district ID
- 0903090
- Math proficiency
- 29% ▼ -11.00%
- Reading proficiency
- 44% ▼ -6.00%
- Median HH income
- $76,540
- Composite
- 34.07/100
- National rank
- #5297
- State rank
- #104 of 153 in CT
Livability — Norwalk
- Score
- 77/100
- State rank
- #41
- US rank
- #2966
Category grades
Schools grade is shown separately in the Schools card above.
Census & demographics
- Census place
- Norwalk, CT
- County
- Fairfield County · 765,532 people
- City population
- 89,026
- Metro
- Bridgeport-Stamford-Norwalk, CT
- Population (ZIP)
- 9,351
- Household income
- $106,439
- Rent vs Own
- Severe rent burden
- 462.0
Population outlook (Western Connecticut County) Hauer SSP2
- By 2040
- 685,031
Race, ethnicity, and origin ACS 2023
- Neighborhood character
- Diverse neighborhood (Simpson 0.63)
- Race & ethnicity
- White 54% Hispanic / Latino 26% Two or more races 14% Black 10% Asian 4%
- Hispanic origin (detail)
- Mexican 5% Puerto Rican 1% Cuban 1%
- Common ancestry
- Romanian 3% Lithuanian 2% Hispanic 2%
- Foreign-born
- 26% · Canada, Jamaica, Guatemala
- Languages at home
- 65% English-only · Spanish 25% Other Indo-European 4% French/Haitian/Cajun 2%
Political lean MEDSL · Western Connecticut
- 2024 margin
- D (+19.1) · D 58.8% · R 39.7% · Other 1.6%
- All cycles
- 2024: D+19.1
Not yet ingested
- Civics
- —
Market trends
- HPI YoY
- ▼ -80.60%
- Current HPI
- 193.6645
- Rent YoY
- ▼ -0.97%
- Metro
- Bridgeport-Stamford-Norwalk, CT
- State GDP YoY
- ▲ 1.06%
- F500 in state
- 38
Industry mix (Fortune 500 HQ in CT)
| Industry | F500 HQs | Revenue |
|---|---|---|
| Industrial Machinery | 4 | $38B |
|
||
| Insurance | 3 | $71B |
|
||
| Financial Services | 2 | $25B |
|
||
| Transportation / Logistics | 2 | $18B |
|
||
| Healthcare | 1 | $247B |
|
||
| Telecommunications | 1 | $55B |
|
||
Price history
+68.0% since first listed5 events — show timeline
- 2026-04-10 Pending — Smart MLS
- 2026-03-25 Contingent — Smart MLS
- 2026-03-14 Listed $949,000 Smart MLS
- 2026-03-07 Coming Soon $949,000 Smart MLS
- 2019-01-07 Sold (Public Records) $565,000 Public Records
Property tax history
+4.1%/yrLatest (2023): $10,122 · +2.2% YoY. Source: county tax records.
Cash-flow waterfall
monthlySold comps — $/sqft
last 12 mo · ≤1 miLoading sold comps…