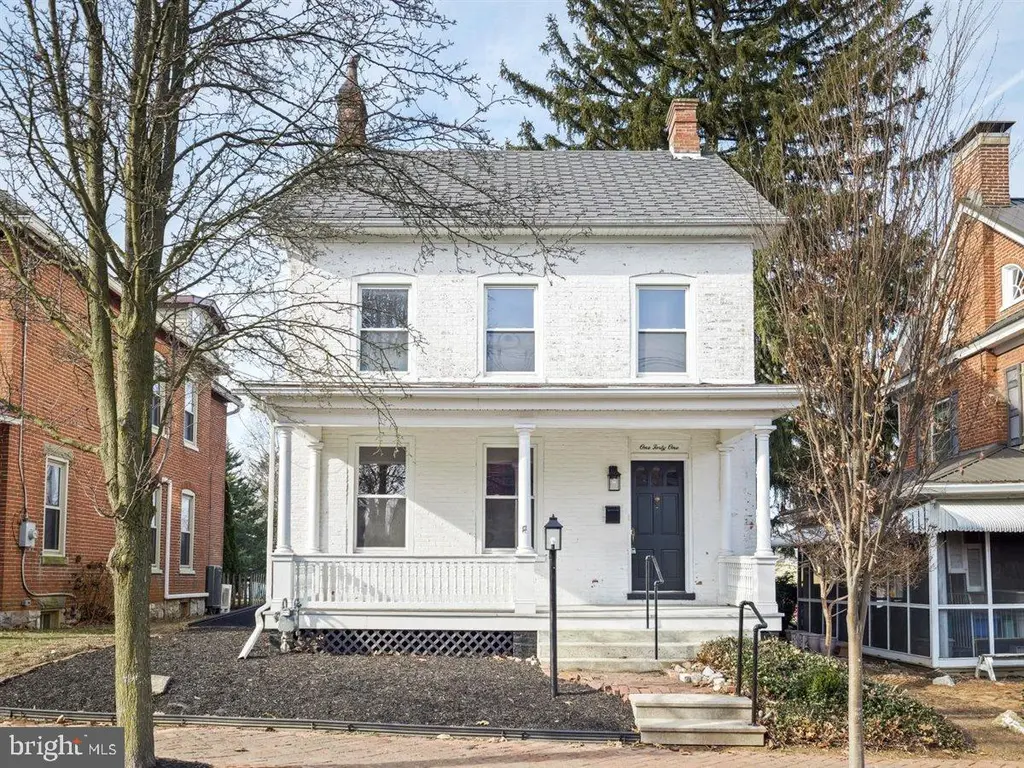
141 S Washington St · Greencastle, PA
Flood risk 1/10 · Minimal
- FEMA flood zone
- X (unshaded)
- Chance of flooding over 30 yrs
- 0.0%
- Est. flood insurance / yr
- $507 – $1,088
Fire risk 1/10 · Minimal
- Est. fire insurance / yr
- $511 – $949
Heat risk 5/10 · Moderate
- Hot days now (above 100°F)
- 7 days/yr
- Hot days in 30 yrs
- 16 days/yr
Wind risk 2/10 · Minimal
- Chance of severe wind over 30 yrs
- 2.0%
Air-quality risk 1/10 · Minimal
- Unhealthy air days now
- 0 days/yr
- Unhealthy air days in 30 yrs
- 0 days/yr
Risk factors via First Street. Map © Google.
Why this score? — see what drove the C- grade
The composite is a weighted blend of 9 inputs, each scored 0–100. Each bar is that input's sub-score; the figure is the points it added to the 100-point composite (weight × sub-score).
- Cash flow +15.0/30.0
- ARV discount +15.0/15.0
- Schools +4.7/10.0
- DSCR +4.6/10.0
- Livability +3.9/5.0
- 1% rule +3.3/10.0
- Rent growth +2.5/5.0
- Condition / age +2.5/5.0
- Appreciation +0.0/10.0
$179,900
🖨 Deal sheet 📄 Offer letter ✓ Due diligence
Listing remarks
Four-Story Brick Home with Historic Character & Value-Add Potential This four-story brick home offers a rare blend of historic charm and renovation opportunity. Featuring 3 bedrooms and 2 full bathrooms, the property includes * * two fireplaces—located in the living room and primary bedroom— * * and original hardwood floors in select rooms, providing timeless character and a strong foundation for restoration. The home offers an unfinished basement with excellent storage or future finishing potential, along with a lofty, creative attic space ideal for additional living area, office, or studio use. A large backyard adds outdoor value and flexibility, and the property also
Key facts
- Unfinished basement
- Large backyard
- Off-street parking
Tags
Property features AI
Finance
- Other: Ownership is fee simple; Lease not considered
Exterior
- Parking: Off-street parking
- Utilities: 100 amp electric service; Public water; Public sewer
- Home design: Detached home; Main entrance faces northeast; Major rehab needed
- Construction: Brick construction; Brick/mortar foundation; Asbestos shingle roof; Building not winterized; Above-grade other structures
- Exterior features: Shed on property; Not in a federal flood zone; Pets allowed with no restrictions
Interior
- Bedrooms: Three bedrooms on the upper level
- Bathrooms: Two full bathrooms (one on main level, one on upper level)
- Heating & cooling: Hot water baseboard heating; Natural gas heating
- Interior features: Estimated living area; 9 total rooms; Connecting stairway to basement; Unfinished basement; Two fireplaces
- Laundry & utility: Laundry on the main floor; 60+ gallon natural gas hot water tank
Neighborhood map
What this means for you Summary
Snapshot
- This is a 3-bed/2.0-bath other listed at $180k.
Deal economics
- At list price, monthly cash flow is $55 ($659/yr) — positive.
- The deal already cash-flows at list — no discount required.
- To meet the 1% rule (rent ≥ 1% of price), the offer needs to be $150k (16.9% below list).
- Recommended offer: $150k (16.9% below list) — sets the bar for 1% rule.
- Cap rate 6.7% vs local median 2.1% in Greencastle — top-decile yield for the area; either an underpriced asset or a hidden risk that comps aren't pricing in. Stress-test before assuming the spread holds.
Location & tenants
- Location reads 78/100 on livability (#273 in PA, #2,406 nationally) — a middle-class / working-renter tenant base. Strengths: crime A+, cost of living A+, health & safety A+; Watch: amenities F, commute F.
- Greencastle-Antrim SD (suburban): math 43% / reading 65% proficiency, ranked #118 of 539 in PA (top 22%) — acceptable for families but not a draw, mixed tenant base, ~2y average lease.
- Zoned schools: Greencastle-Antrim El Sch (math 45% / reading 63%, grade C, #557 of 1,518 statewide, top 37%, 680 students, 40% FRL); Greencastle-Antrim Ms (math 32% / reading 67%, grade C, #137 of 512 statewide, top 27%, 689 students, 37% FRL); Greencastle-Antrim Shs (math 74% / reading 24%, grade D, #149 of 437 statewide, top 34%, 1,047 students, 32% FRL).
- Market conditions: 122 active listings in the ZIP; 1 comparable units currently listed for rent nearby; 633 units permitted in Franklin County in 2024 (112 in 5+ unit buildings).
Forward outlook
- Local home prices are declining (-3.0%/yr); year-one equity from $1k of loan paydown is wiped out by about $5k of value loss. Plan a longer hold.
Negotiation context
- It's been on market 17 days — a 2% lower offer ($177k) is reasonable based on typical stale-listing flexibility.
- 6 sale attempts with the ask held roughly flat each time — persistent listings suggest the price (not the market) is what's stuck; bring a comps-based counter.
- Current owner paid $147k; 22% above their basis — modest negotiation headroom, anchor on the comps not their cost.
Risks & watch-outs
- Watch-outs: built in 1900 — expect roof / HVAC / electrical / plumbing capex.
- Climate carrying-cost: extreme-heat days projected 7→16/yr by 2055 (HVAC capex compounding) — expect insurance premiums to compound above CPI over the hold.
Questions for the listing agent
- Built in 1900 — when were the roof, HVAC, electrical panel, plumbing, and water heater last replaced?
- Is there a deadline driving the sale (1031 exchange, divorce, estate, relocation)? That informs how much negotiation room exists.
- Schools are B-rated — typically a magnet for longer-tenancy family renters. What's the average tenant stay here, and is there a school-zone premium baked into asking?
- What's the average days-on-market for RENTAL listings here right now (not sales)? A rising rental-DOM trend means longer vacancies and softer asking-rent achievability than the comps imply.
- What's the recent tenant-quality profile in this submarket — average credit score on applications, eviction rate, late-payment / NSF rate, and stable-employment percentage? A property-management company in the area should have these aggregated.
- How much new for-sale + rental construction is in the pipeline within 1–3 miles? Heavy new supply typically softens prices + rents 12–24 months out; constrained supply supports both.
Investment metrics
- 1% rule
- 0.83% ✗
- Cap rate
- 6.66%
- Cash-on-cash
- 1.31%
- DSCR
- 1.06
- GRM
- 10.0
CMA / ARV
- ARV (median comp)
- $232,542
- List price
- $179,900
- Delta
- -22.64%
- Verdict
- UNDERPRICED
- Comps
- 20 within 1.0 mi
Projected returns pro-forma
-3.0% appreciation · 3.0% rent growth · sell at horizon
- IRR
- -14.2%
- Equity multiple
- 0.49×
- Total profit
- $-25,702
- Equity at exit
- $26,824
- IRR
- -5.5%
- Equity multiple
- 0.64×
- Total profit
- $-18,077
- Equity at exit
- $15,554
Cash invested: $50,372 (down + closing). Projections, not guarantees.
Landlord ↔ Tenant lean methodology
- Overall (STATE)
- 62 Landlord-Friendly
- State Pennsylvania
- 62 Landlord-Friendly · EVEN
- County
- — inherits STATE
- City
- — inherits STATE
ZIP-level market 17225
- Home prices YoY
- -19.0%
- Active inventory
- 122
- Price-to-rent
- 10.0×
Monthly cashflow live
- Estimated rent
- $1,495 medium interval (Pro) →
- Mortgage (P&I)
- −$943
- Tax from tax record
- −$108 /mo · $1,293/yr
- Insurance
- −$75
- HOA
- −$0
- Vacancy / Maint / Mgmt
- −$314
- Net cashflow
- $55
Break-even live
UW: 25.0% down · 7.5% · 30yr · 1.5% tax · 5.0% vac · 8.0% maint · 8.0% mgmt
Financing live
Cash to close
- Down payment
- $44,975
- Closing costs
- $5,397
- Reserves months
- —
- Total cash needed
- —
Loan-product check · same deal, 3 products live
Conventional
25% down · 7.5% · 30yr
- Down + closing
- —
- Monthly P&I
- —
- Monthly cashflow
- —
- DSCR
- —
- Eligible?
- —
Personal DTI + credit; lowest rate.
DSCR
20% down · 8.5% · 30yr
- Down + closing
- —
- Monthly P&I
- —
- Monthly cashflow
- —
- DSCR
- —
- Eligible?
- —
No personal income docs; deal must DSCR.
Hard money
10% down · 12.0% · 12mo
- Down + closing
- —
- Monthly P&I
- —
- Monthly cashflow
- —
- DSCR
- —
- Eligible?
- —
Short-term bridge; refi at stabilization.
Rent comps 1 comps
| Address | Beds | Baths | Sqft | Rent | $/sqft | DOM | Units | Dist |
|---|---|---|---|---|---|---|---|---|
| 122 S Carlisle St Greencastle, PA | 3.0 | 1.0 | 1470 | $1,495 | $1.02 | 21d | 1 | 0.07mi |
Listing history 17 events
-
2026-05-06historical
-
2026-05-06$179,900 Active 1113-char remark
-
2026-04-24$188,900 Active
-
2026-04-24historical
-
2026-04-21historical Active Under Contract
-
2026-04-03price $189,900
-
2026-04-03status Active
-
2026-04-03historical
-
2026-02-13$198,900 Active
-
2026-02-13historical
-
2026-01-08$209,900 Active
-
2025-10-14soldstatus $146,880
-
2025-10-08soldstatus $146,880 Closed
-
2025-09-11status Pending
-
2025-09-02price $104,900
-
2025-08-07$139,900 Active
-
2025-07-29historical $139,900
ⓘ Source: listings_history table (triggers on properties + properties_extension) + one-shot
backfill from property_details.listing_events for pre-trigger history.
Tax reassessment forecast PA · Partial reset (capped growth)
- Current annual tax
- $1,293 · $108/mo
- Projected year-2 tax
- $2,068 · $172/mo
- Expected delta
- +$775/yr (+$65/mo · 59.9%)
ⓘ Screening estimate from a state-policy table — verify with the county assessor before closing.
Climate risk First Street
- Flood 1/10 Low FEMA zone X (unshaded) · 0% chance over 30 yrs
- Wildfire 1/10 Low
- Heat 5/10 Major 7 d/yr ≥100°F today · 16 d/yr by 30 yrs out
- Wind 2/10 Low 2% chance of damaging wind over 30 yrs
- Air quality 1/10 Low 0 unhealthy d/yr today · 0 by 30 yrs out
Nearby sold comps map
Loading sold comps map…
Walkable amenities ~0.75 mi
Loading nearby amenities…
Taxation est. · year 1
- Rental income
- $17,940
- − Mortgage interest
- −$10,077
- − Property taxes
- −$1,293
- − Insurance
- −$900
- − Repairs & maintenance
- −$1,435
- − Management
- −$1,435
- − Depreciation
- −$5,233
- Taxable loss
- −$2,433
- Est. tax savings @ 24.0%
- +$584
- After-tax cash flow
- $1,243/yr
For passive investors: Depreciation is non-cash, so a rental often shows a tax loss while cash-flowing — sheltering income. Rental losses are passive: they offset passive income freely, and up to $25,000/yr can offset ordinary (W-2) income if you actively participate and your MAGI is under $100k (phasing out to $0 by $150k); unused losses carry forward. On sale, claimed depreciation is recaptured at up to 25%, and gains may owe capital-gains tax (a 1031 exchange can defer both). Figures are a year-1 estimate at your 24.0% rate — not tax advice; consult a CPA.
Schools (NCES district)
- District
- Greencastle-Antrim SD
- NCES district ID
- 4211010
- Math proficiency
- 43% ▼ -14.00%
- Reading proficiency
- 65% ▼ -9.00%
- Median HH income
- $62,541
- Composite
- 47.21/100
- National rank
- #2319
- State rank
- #118 of 539 in PA
Livability — Greencastle
- Score
- 78/100
- State rank
- #273
- US rank
- #2406
Category grades
Schools grade is shown separately in the Schools card above.
Census & demographics
- Census place
- Greencastle, PA
- Population (ZIP)
- 20,335
Population outlook (Franklin County) Hauer SSP2
- Today (2025)
- 157,827 people
- By 2030
- 158,933 · +0.7%
- By 2040
- 159,060 · +0.8%
- By 2050
- 155,132 · -1.7%
- By 2075
- 138,545 · -12.2%
- By 2100
- 112,321 · -28.8%
Race, ethnicity, and origin ACS 2023
- Neighborhood character
- Predominantly White (90%)
- Race & ethnicity
- White 90% Two or more races 4% Black 3% Asian 2% Hispanic / Latino 1%
- Common ancestry
- Romanian 4% Italian 4% American 2%
- Foreign-born
- 4% · Canada, China
- Languages at home
- 96% English-only · Spanish 1% Russian/Polish/Slavic 1%
Political lean MEDSL · Franklin
- 2024 margin
- Solid R (+43.0) · D 28.1% · R 71.1%
- 2008→2024 swing
- -10.4pp toward R · 2008: -32.6pp · 2024: -43.0pp
- All cycles
- 2024: R+43.0 2020: R+43.1 2016: R+46.5 2012: R+38.5 2008: R+32.6
Not yet ingested
- Civics
- —
Market trends
- HPI YoY
- ▼ -54.84%
- Current HPI
- 233.5857
- Rent YoY
- —
- Metro
- —
- State GDP YoY
- ▲ 1.68%
- F500 in state
- 34
Industry mix (Fortune 500 HQ in PA)
| Industry | F500 HQs | Revenue |
|---|---|---|
| Healthcare | 2 | $309B |
|
||
| Insurance | 2 | $27B |
|
||
| Telecommunications / Media | 1 | $124B |
|
||
| Industrial Distribution | 1 | $22B |
|
||
| Financial Services | 1 | $20B |
|
||
| Chemicals / Materials | 1 | $18B |
|
||
Price history
+28.6% since first listed18 events — show timeline
- 2026-05-23 Pending — BRIGHT MLS
- 2026-05-06 Listing Removed — BRIGHT MLS
- 2026-05-06 Listed $179,900 BRIGHT MLS
- 2026-04-24 Listing Removed — BRIGHT MLS
- 2026-04-24 Listed $188,900 BRIGHT MLS
- 2026-04-21 Contingent — BRIGHT MLS
- 2026-04-03 Price Changed $189,900 BRIGHT MLS
- 2026-04-03 Relisted — BRIGHT MLS
- 2026-04-03 Listing Removed — BRIGHT MLS
- 2026-02-13 Listing Removed — BRIGHT MLS
- 2026-02-13 Listed $198,900 BRIGHT MLS
- 2026-01-08 Listed $209,900 BRIGHT MLS
- 2025-10-14 Sold (Public Records) $146,880 Public Records
- 2025-10-08 Sold (MLS) $146,880 BRIGHT MLS
- 2025-09-11 Pending — BRIGHT MLS
- 2025-09-02 Price Changed $104,900 BRIGHT MLS
- 2025-08-07 Listed $139,900 BRIGHT MLS
- 2025-07-29 Coming Soon $139,900 BRIGHT MLS
Property tax history
+12.6%/yrLatest (2026): $1,293 · +2.9% YoY. Source: county tax records.
Cash-flow waterfall
monthlySold comps — $/sqft
last 12 mo · ≤1 miLoading sold comps…