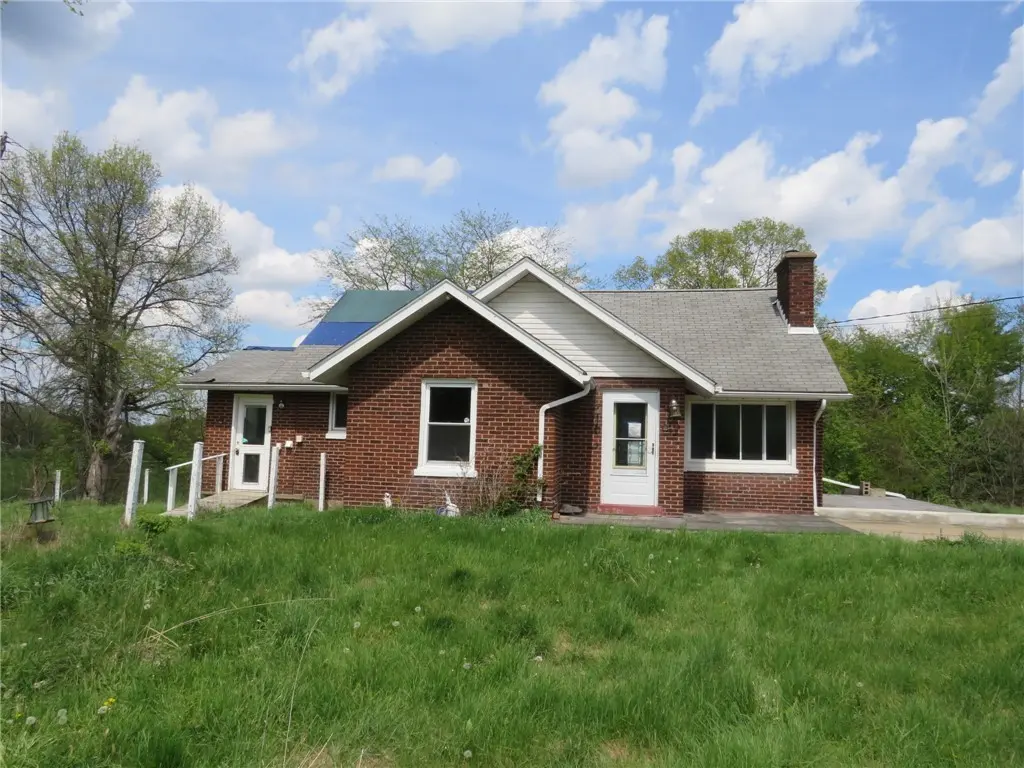
1878 Bakerstown Rd · Tarentum, PA
Flood risk 1/10 · Minimal
- FEMA flood zone
- X (unshaded)
- Chance of flooding over 30 yrs
- 0.0%
- Est. flood insurance / yr
- $473 – $860
Fire risk 1/10 · Minimal
- Est. fire insurance / yr
- $511 – $949
Heat risk 3/10 · Minor
- Hot days now (above 97°F)
- 7 days/yr
- Hot days in 30 yrs
- 17 days/yr
Wind risk 2/10 · Minimal
- Chance of severe wind over 30 yrs
- —
Air-quality risk 4/10 · Minor
- Unhealthy air days now
- 5 days/yr
- Unhealthy air days in 30 yrs
- 6 days/yr
Risk factors via First Street. Map © Google.
Why this score? — see what drove the D grade
The composite is a weighted blend of 9 inputs, each scored 0–100. Each bar is that input's sub-score; the figure is the points it added to the 100-point composite (weight × sub-score).
- ARV discount +15.0/15.0
- Cash flow +5.3/30.0
- Appreciation +5.2/10.0
- Schools +4.3/10.0
- Livability +4.0/5.0
- Rent growth +2.5/5.0
- Condition / age +2.5/5.0
- 1% rule +2.0/10.0
- DSCR +0.0/10.0
$199,900
🖨 Deal sheet 📄 Offer letter ✓ Due diligence
Listing remarks MLS
Spacious brick cape cod style home with three bedrooms. Located on 1.5 acres of private and wooded land. Tons of natural light in the living room with a large picture window and stone fireplace. Formal dining room w/ nice built-ins. Plenty of counter and cabinet space in the kitchen. Convenient first floor laundry room. There is a full, unfinished basement for tons of additional storage space. Plenty of off-street parking in addition to the one car garage. Minutes to Rt 28.
Key facts
- Formal dining room
- Natural light
- Stone fireplace
Tags
Neighborhood map
What this means for you Summary
Snapshot
- This is a 3-bed/1.0-bath single-family listed at $200k.
Deal economics
- At list price, monthly cash flow is $-443 ($-5k/yr) — negative.
- To cash-flow at today's rent, offer at most $122k (39.2% below list).
- To meet the 1% rule (rent ≥ 1% of price), the offer needs to be $140k (29.8% below list).
- Recommended offer: $122k (39.2% below list) — sets the bar for cash-flow.
- Cap rate 3.6% vs local median 9.6% in Tarentum — below-typical yield; the buyer is paying a premium for something (appreciation thesis, condition, location) that the cap rate doesn't capture.
Location & tenants
- Location reads 79/100 on livability (#240 in PA, #2,066 nationally) — a middle-class / working-renter tenant base. Strengths: commute A+, cost of living A+, housing A+; Watch: schools C-, amenities F, employment F.
- Deer Lakes SD (suburban): math 39% / reading 59% proficiency, ranked #182 of 539 in PA (top 34%) — families likely to look elsewhere, expect single-tenant / working-renter base with shorter leases.
- Market conditions: 39 active listings in the ZIP; 2,996 units permitted in Allegheny County in 2024 (1,588 in 5+ unit buildings).
Forward outlook
- In year one you build about $2k of equity ($1k loan paydown + $907 appreciation (0.5% local appreciation)).
Negotiation context
- It's been on market 56 days — a 3% lower offer ($194k) is reasonable based on typical stale-listing flexibility.
- 2 sale attempts since 15y ago with the ask held roughly flat each time — persistent listings suggest the price (not the market) is what's stuck; bring a comps-based counter.
- Current owner paid $59k; list at $200k implies a 238% gain — meaningful room to come down on a strong offer.
Risks & watch-outs
- Watch-outs: property tax is 2.5% of price; built in 1952 — expect roof / HVAC / electrical / plumbing capex.
Questions for the listing agent
- What do current leases actually rent for vs. the listed asking? Can we see a recent rent roll and the last 12 months of T-12 income?
- It's been on market 56 days. Have you received any prior offers? Is the seller open to a 39% concession, seller financing, or rate buy-down credit?
- Built in 1952 — when were the roof, HVAC, electrical panel, plumbing, and water heater last replaced?
- Property tax is high relative to price — has the assessment been appealed recently, and will the sale trigger a re-assessment?
- Is there a deadline driving the sale (1031 exchange, divorce, estate, relocation)? That informs how much negotiation room exists.
- The area grade is low — what's the realistic commute time and amenity access for the typical tenant pool here? Any planned neighborhood developments (good or bad) we should know about?
- What's the average days-on-market for RENTAL listings here right now (not sales)? A rising rental-DOM trend means longer vacancies and softer asking-rent achievability than the comps imply.
- What's the recent tenant-quality profile in this submarket — average credit score on applications, eviction rate, late-payment / NSF rate, and stable-employment percentage? A property-management company in the area should have these aggregated.
- How much new for-sale + rental construction is in the pipeline within 1–3 miles? Heavy new supply typically softens prices + rents 12–24 months out; constrained supply supports both.
Investment metrics
- 1% rule
- 0.70% ✗
- Cap rate
- 3.63%
- Cash-on-cash
- -9.50%
- DSCR
- 0.58
- GRM
- 11.9
CMA / ARV
- ARV (median comp)
- $304,702
- List price
- $199,900
- Delta
- -34.39%
- Verdict
- UNDERPRICED
- Comps
- 5 within 1.0 mi
Show comp detail 2 sales within ~0.75 mi
| Address | Dist | Beds/Ba | Sqft | Sold | Price | $/sf | Match |
|---|---|---|---|---|---|---|---|
| 150 Holsing Ln | 0.71mi | 3/2.5 | 1,905 (-1%) | 0mo | $987,500 | $518 | 58 |
| 124 Miller Dr | 0.62mi | 3/2.0 | 1,710 (-11%) | 7mo | $375,000 | $219 | 42 |
Match score weights: distance 35% · size 25% · config 20% · recency 20%. Top-matched comps best support the ARV.
Projected returns pro-forma
0.45% appreciation · 3.0% rent growth · sell at horizon
- IRR
- -11.0%
- Equity multiple
- 0.47×
- Total profit
- $-29,650
- Equity at exit
- $62,621
- IRR
- -4.8%
- Equity multiple
- 0.46×
- Total profit
- $-30,477
- Equity at exit
- $79,030
Cash invested: $55,972 (down + closing). Projections, not guarantees.
Landlord ↔ Tenant lean methodology
- Overall (STATE)
- 62 Landlord-Friendly
- State Pennsylvania
- 62 Landlord-Friendly · EVEN
- County
- — inherits STATE
- City
- — inherits STATE
ZIP-level market 15084
- Home prices YoY
- 0.2%
- Active inventory
- 39
- Price-to-rent
- 11.9×
Monthly cashflow live
- Estimated rent
- $1,404 medium interval (Pro) →
- Mortgage (P&I)
- −$1,048
- Tax from tax record
- −$420 /mo · $5,045/yr
- Insurance
- −$83
- HOA
- −$0
- Vacancy / Maint / Mgmt
- −$295
- Net cashflow
- $-443
Break-even live
UW: 25.0% down · 7.5% · 30yr · 1.5% tax · 5.0% vac · 8.0% maint · 8.0% mgmt
Financing live
Cash to close
- Down payment
- $49,975
- Closing costs
- $5,997
- Reserves months
- —
- Total cash needed
- —
Loan-product check · same deal, 3 products live
Conventional
25% down · 7.5% · 30yr
- Down + closing
- —
- Monthly P&I
- —
- Monthly cashflow
- —
- DSCR
- —
- Eligible?
- —
Personal DTI + credit; lowest rate.
DSCR
20% down · 8.5% · 30yr
- Down + closing
- —
- Monthly P&I
- —
- Monthly cashflow
- —
- DSCR
- —
- Eligible?
- —
No personal income docs; deal must DSCR.
Hard money
10% down · 12.0% · 12mo
- Down + closing
- —
- Monthly P&I
- —
- Monthly cashflow
- —
- DSCR
- —
- Eligible?
- —
Short-term bridge; refi at stabilization.
Listing history 7 events
-
2026-05-07price $199,900 478-char remark
Show marketing remark (478 chars)
Spacious brick cape cod style home with three bedrooms. Located on 1.5 acres of private and wooded land. Tons of natural light in the living room with a large picture window and stone fireplace. Formal dining room w/ nice built-ins. Plenty of counter and cabinet space in the kitchen. Convenient first floor laundry room. There is a full, unfinished basement for tons of additional storage space. Plenty of off-street parking in addition to the one car garage. Minutes to Rt 28.
-
2026-03-31$209,900 Active 478-char remark
Show marketing remark (478 chars)
Spacious brick cape cod style home with three bedrooms. Located on 1.5 acres of private and wooded land. Tons of natural light in the living room with a large picture window and stone fireplace. Formal dining room w/ nice built-ins. Plenty of counter and cabinet space in the kitchen. Convenient first floor laundry room. There is a full, unfinished basement for tons of additional storage space. Plenty of off-street parking in addition to the one car garage. Minutes to Rt 28.
-
2011-04-01soldstatus $59,100
-
2011-03-29price $54,900 239-char remark
Show marketing remark (239 chars)
Sold as is. Hand money held by listing office, minimum $1000. Addendum #13 at www. libbysosinski.com . Taxes and lot size estimated. Located on 1.5820 acres, this is one you don't want to miss! 3 bedrooms, 1 bathroom = LOADS of potential!
-
2011-03-28soldstatus $59,100 239-char remark
Show marketing remark (239 chars)
Sold as is. Hand money held by listing office, minimum $1000. Addendum #13 at www. libbysosinski.com . Taxes and lot size estimated. Located on 1.5820 acres, this is one you don't want to miss! 3 bedrooms, 1 bathroom = LOADS of potential!
-
2011-02-28$59,100 239-char remark
Show marketing remark (239 chars)
Sold as is. Hand money held by listing office, minimum $1000. Addendum #13 at www. libbysosinski.com . Taxes and lot size estimated. Located on 1.5820 acres, this is one you don't want to miss! 3 bedrooms, 1 bathroom = LOADS of potential!
-
2000-03-03soldstatus $90,000
ⓘ Source: listings_history table (triggers on properties + properties_extension) + one-shot
backfill from property_details.listing_events for pre-trigger history.
Tax reassessment forecast PA · Partial reset (capped growth)
- Current annual tax
- $5,045 · $420/mo
- Projected year-2 tax
- $5,045 · $420/mo
- Expected delta
- $0/yr ($0/mo · 0.0%)
ⓘ Screening estimate from a state-policy table — verify with the county assessor before closing.
Climate risk First Street
- Flood 1/10 Low FEMA zone X (unshaded) · 0% chance over 30 yrs
- Wildfire 1/10 Low
- Heat 3/10 Moderate 7 d/yr ≥97°F today · 17 d/yr by 30 yrs out
- Wind 2/10 Low
- Air quality 4/10 Moderate 5 unhealthy d/yr today · 6 by 30 yrs out
Nearby sold comps map
Loading sold comps map…
Walkable amenities ~0.75 mi
Loading nearby amenities…
Taxation est. · year 1
- Rental income
- $16,842
- − Mortgage interest
- −$11,198
- − Property taxes
- −$5,045
- − Insurance
- −$1,000
- − Repairs & maintenance
- −$1,347
- − Management
- −$1,347
- − Depreciation
- −$5,815
- Taxable loss
- −$8,910
- Est. tax savings @ 24.0%
- +$2,138
- After-tax cash flow
- $-3,180/yr
For passive investors: Depreciation is non-cash, so a rental often shows a tax loss while cash-flowing — sheltering income. Rental losses are passive: they offset passive income freely, and up to $25,000/yr can offset ordinary (W-2) income if you actively participate and your MAGI is under $100k (phasing out to $0 by $150k); unused losses carry forward. On sale, claimed depreciation is recaptured at up to 25%, and gains may owe capital-gains tax (a 1031 exchange can defer both). Figures are a year-1 estimate at your 24.0% rate — not tax advice; consult a CPA.
Schools (NCES district)
- District
- Deer Lakes SD
- NCES district ID
- 4207540
- Math proficiency
- 39% ▼ -13.00%
- Reading proficiency
- 59% ▼ -10.00%
- Median HH income
- $57,944
- Composite
- 42.64/100
- National rank
- #3183
- State rank
- #182 of 539 in PA
Livability — Tarentum
- Score
- 79/100
- State rank
- #240
- US rank
- #2066
Category grades
Schools grade is shown separately in the Schools card above.
Census & demographics
- Population (ZIP)
- 9,884
Population outlook (Allegheny County) Hauer SSP2
- Today (2025)
- 1,250,282 people
- By 2030
- 1,256,482 · +0.5%
- By 2040
- 1,256,318 · +0.5%
- By 2050
- 1,244,169 · -0.5%
- By 2075
- 1,197,693 · -4.2%
- By 2100
- 1,093,187 · -12.6%
Race, ethnicity, and origin ACS 2023
- Neighborhood character
- Predominantly White (92%)
- Race & ethnicity
- White 92% Two or more races 4% Black 3% Hispanic / Latino 1%
- Common ancestry
- Romanian 14% Lithuanian 2% Serbian 2%
- Foreign-born
- 1%
- Languages at home
- 98% English-only · French/Haitian/Cajun 1%
Political lean MEDSL · Allegheny
- 2024 margin
- Strong D (+20.3) · D 59.7% · R 39.4%
- 2008→2024 swing
- +4.8pp toward D · 2008: 15.5pp · 2024: 20.3pp
- All cycles
- 2024: D+20.3 2020: D+20.4 2016: D+16.4 2012: D+14.4 2008: D+15.5
Not yet ingested
- Civics
- —
Market trends
- HPI YoY
- ▲ 0.45%
- Current HPI
- 230.7532
- Rent YoY
- —
- Metro
- —
- State GDP YoY
- ▲ 1.68%
- F500 in state
- 34
Industry mix (Fortune 500 HQ in PA)
| Industry | F500 HQs | Revenue |
|---|---|---|
| Healthcare | 2 | $309B |
|
||
| Insurance | 2 | $27B |
|
||
| Telecommunications / Media | 1 | $124B |
|
||
| Industrial Distribution | 1 | $22B |
|
||
| Financial Services | 1 | $20B |
|
||
| Chemicals / Materials | 1 | $18B |
|
||
Price history
+122.1% since first listed7 events — show timeline
- 2026-05-07 Price Changed $199,900 West Penn MLS
- 2026-03-31 Listed $209,900 West Penn MLS
- 2011-04-01 Sold (Public Records) $59,100 Public Records
- 2011-03-29 Price Changed $54,900 West Penn MLS
- 2011-03-28 Sold (MLS) $59,100 West Penn MLS
- 2011-02-28 Listed $59,100 West Penn MLS
- 2000-03-03 Sold (Public Records) $90,000 Public Records
Property tax history
+2.9%/yrLatest (2026): $5,045 · +13.9% YoY. Source: county tax records.
Cash-flow waterfall
monthlySold comps — $/sqft
last 12 mo · ≤1 miLoading sold comps…