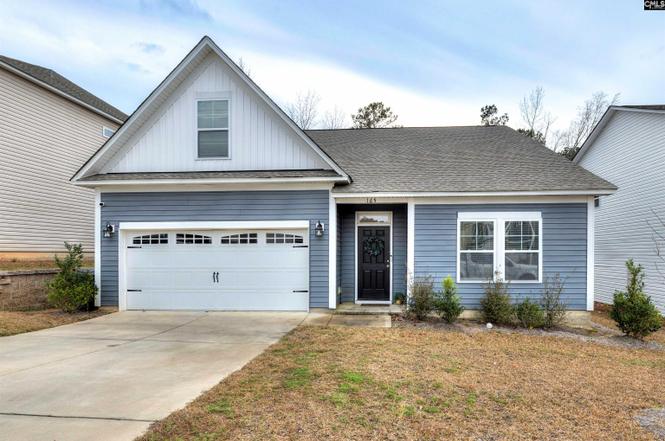
165 Shady Spot Rd · Gilbert, SC
Flood risk 1/10 · Minimal
- FEMA flood zone
- X (unshaded)
- Chance of flooding over 30 yrs
- 0.0%
- Est. flood insurance / yr
- $507 – $1,088
Fire risk 4/10 · Minor
- Est. fire insurance / yr
- $783 – $1,453
Heat risk 6/10 · Moderate
- Hot days now (above 107°F)
- 7 days/yr
- Hot days in 30 yrs
- 15 days/yr
Wind risk 6/10 · Moderate
- Chance of severe wind over 30 yrs
- 59.0%
Air-quality risk 3/10 · Minor
- Unhealthy air days now
- 3 days/yr
- Unhealthy air days in 30 yrs
- 3 days/yr
Risk factors via First Street. Map © Google.
Why this score? — see what drove the D- grade
The composite is a weighted blend of 9 inputs, each scored 0–100. Each bar is that input's sub-score; the figure is the points it added to the 100-point composite (weight × sub-score).
- Cash flow +10.9/30.0
- ARV discount +6.3/15.0
- Schools +4.2/10.0
- Livability +3.6/5.0
- Rent growth +3.3/5.0
- DSCR +3.2/10.0
- 1% rule +2.5/10.0
- Condition / age +2.5/5.0
- Appreciation +0.0/10.0
$305,000
🖨 Deal sheet (PDF) 📄 Offer letter ✓ Due diligence
Listing remarks
Welcome home to The Julie A, a beautifully designed 4-bedroom split-level home that blends comfort and modern style. The spacious kitchen features a center island, white cabinets, and Luna Pearl granite, opening seamlessly to the great room and dining area, perfect for entertaining. The main-level owner’s suite is a true retreat with a large walk-in closet, double vanities, oversized shower, garden tub, and private water closet. Upstairs, a large finished 4th bedroom completes the layout. Enjoy luxury vinyl flooring throughout main living areas, baths, and laundry, plus a covered porch for relaxing outdoors. This home also includes a home automation system, Bluetooth speakers in the k
Key facts
- Oversized shower
- Large walk-in closet
- Double vanities
Tags
Neighborhood map
What this means for you Summary
Snapshot
- This is a 4-bed/2.0-bath single-family listed at $305k.
Deal economics
- At list price, monthly cash flow is $-131 ($-2k/yr) — negative.
- To cash-flow at today's rent, offer at most $282k (7.6% below list).
- To meet the 1% rule (rent ≥ 1% of price), the offer needs to be $228k (25.3% below list).
- Recommended offer: $228k (25.3% below list) — sets the bar for 1% rule.
Location & tenants
- Location reads 71/100 on livability (#52 in SC) — a middle-class / working-renter tenant base. Strengths: cost of living A+, housing A+, crime B; Watch: amenities F, commute F, health & safety F.
- Lexington 01 (suburban): math 42% / reading 53% proficiency, ranked #11 of 80 in SC (top 14%) — families likely to look elsewhere, expect single-tenant / working-renter base with shorter leases.
- Zoned schools: Rocky Creek Elementary (math 56% / reading 54%, grade C, #119 of 597 statewide, top 20%, 863 students, 18% FRL); Pleasant Hill Middle (math 50% / reading 58%, grade B-, #27 of 229 statewide, top 12%, 748 students, 21% FRL); Lexington High (math 69% / reading 92%, grade A, #23 of 196 statewide, top 11%, 2,410 students, 17% FRL).
- Zoned-school proficiency averages 63% at this address vs 48% district-wide (+16 pts) — the actual schools serving this property are materially stronger than the Lexington 01 average implies; a family-tenant draw the district grade alone would hide.
- Market conditions: Rents rising (+3.2%/yr); 714 active listings in the ZIP; 3 comparable units currently listed for rent nearby; rentals leasing fast (median 5d on market — plan ~1-2 weeks tenant-placement turnaround); solid renter incomes; 1,712 units permitted in Lexington County in 2024 (0 in 5+ unit buildings).
Forward outlook
- Local home prices are declining (-3.0%/yr); year-one equity from $2k of loan paydown is wiped out by about $9k of value loss. Plan a longer hold.
- Lexington County population projected at +26% by 2050 — long-run rental-demand tailwind backs the buy-and-hold thesis.
Negotiation context
- It's been on market 61 days — a 6% lower offer ($287k) is reasonable based on typical stale-listing flexibility.
- 2 sale attempts since 4y ago; this cycle's ask has dropped $35k (10%) from the opening price — seller is motivated, your offer sets the floor, not the list.
Risks & watch-outs
- Climate carrying-cost: major wind risk, 59% chance of damaging wind over 30y; extreme-heat days projected 7→15/yr by 2055 (HVAC capex compounding) — expect insurance premiums to compound above CPI over the hold.
Questions for the listing agent
- What do current leases actually rent for vs. the listed asking? Can we see a recent rent roll and the last 12 months of T-12 income?
- It's been on market 61 days. Have you received any prior offers? Is the seller open to a 25% concession, seller financing, or rate buy-down credit?
- What does the HOA fee cover, when was the last increase, and are there any pending special assessments or reserve-fund shortfalls?
- Why hasn't it sold? Are there any deal-killer items the seller is aware of (foundation, flood, title, zoning, code violations)?
- Is there a deadline driving the sale (1031 exchange, divorce, estate, relocation)? That informs how much negotiation room exists.
- Schools are D-rated, which usually means shorter tenancies and higher turnover. Who's the typical renter profile here, and what's been the actual vacancy rate?
- The area grade is low — what's the realistic commute time and amenity access for the typical tenant pool here? Any planned neighborhood developments (good or bad) we should know about?
- What's the average days-on-market for RENTAL listings here right now (not sales)? A rising rental-DOM trend means longer vacancies and softer asking-rent achievability than the comps imply.
- What's the recent tenant-quality profile in this submarket — average credit score on applications, eviction rate, late-payment / NSF rate, and stable-employment percentage? A property-management company in the area should have these aggregated.
- How much new for-sale + rental construction is in the pipeline within 1–3 miles? Heavy new supply typically softens prices + rents 12–24 months out; constrained supply supports both.
Investment metrics
- 1% rule
- 0.75% ✗
- Cap rate
- 5.78%
- Cash-on-cash
- -1.85%
- DSCR
- 0.92
- GRM
- 11.2
CMA / ARV
- ARV (on-the-fly)
- $297,312
- Comps found
- 1
Show comp detail 1 sale within ~0.75 mi
| Address | Dist | Beds/Ba | Sqft | Sold | Price | $/sf | Match |
|---|---|---|---|---|---|---|---|
| 676 Cloudreach Rd | 0.21mi | 4/2.5 | 2,008 (+3%) | 19mo | $305,000 | $152 | 68 |
Match score weights: distance 35% · size 25% · config 20% · recency 20%. Top-matched comps best support the ARV.
Projected returns pro-forma
-3.0% appreciation · 3.23% rent growth · sell at horizon
- IRR
- -19.2%
- Equity multiple
- 0.33×
- Total profit
- $-57,341
- Equity at exit
- $45,476
- IRR
- -11.4%
- Equity multiple
- 0.31×
- Total profit
- $-58,835
- Equity at exit
- $26,371
Cash invested: $85,400 (down + closing). Projections, not guarantees.
Landlord ↔ Tenant lean methodology
- Overall (STATE)
- 90 Strongly Landlord-Friendly
- State South Carolina
- 90 Strongly Landlord-Friendly · R+6
- County
- — inherits STATE
- City
- — inherits STATE
ZIP-level market 29072
- Rents YoY
- 3.2%
- Active inventory
- 714
- Price-to-rent
- 11.2×
Monthly cashflow live
- Estimated rent
- $2,279 medium interval (Pro) →
- Mortgage (P&I)
- −$1,599
- Tax from tax record
- −$165 /mo · $1,980/yr
- Insurance
- −$127
- HOA
- −$40
- Vacancy / Maint / Mgmt
- −$479
- Net cashflow
- $-131
Break-even live
Sensitivity live
| Price | -10% $41 | -5% $-45 | +0% $-131 | +5% $-218 | +10% $-304 |
|---|---|---|---|---|---|
| Rent | -10% $-311 | -5% $-221 | +0% $-131 | +5% $-41 | +10% $49 |
| Rate | -1.0pp $22 | -0.5pp $-54 | base $-131 | +0.5pp $-210 | +1.0pp $-291 |
UW: 25.0% down · 7.5% · 30yr · 1.5% tax · 5.0% vac · 8.0% maint · 8.0% mgmt
Financing live
Cash to close
- Down payment
- $76,250
- Closing costs
- $9,150
- Reserves months
- —
- Total cash needed
- —
Loan-product check · same deal, 3 products live
Conventional
25% down · 7.5% · 30yr
- Down + closing
- —
- Monthly P&I
- —
- Monthly cashflow
- —
- DSCR
- —
- Eligible?
- —
Personal DTI + credit; lowest rate.
DSCR
20% down · 8.5% · 30yr
- Down + closing
- —
- Monthly P&I
- —
- Monthly cashflow
- —
- DSCR
- —
- Eligible?
- —
No personal income docs; deal must DSCR.
Hard money
10% down · 12.0% · 12mo
- Down + closing
- —
- Monthly P&I
- —
- Monthly cashflow
- —
- DSCR
- —
- Eligible?
- —
Short-term bridge; refi at stabilization.
Rent comps 3 comps
| Address | Beds | Baths | Sqft | Rent | $/sqft | DOM | Units | Dist |
|---|---|---|---|---|---|---|---|---|
| 216 Sundrop St Lexington, SC | 4.0 | 2.5 | 2321 | $2,295 | $0.99 | 5d | 1 | 0.18mi |
| 607 Wild Tulip Ct Gilbert, SC | 4.0 | 2.5 | 2358 | $2,145 | $0.91 | 5d | 1 | 1.06mi |
| 622 Wild Tulip Ct Gilbert, SC | 3.0 | 2.5 | 1800 | $1,875 | $1.04 | 13d | 1 | 1.07mi |
HOA detail
- Monthly dues
- $40 · $480/yr
- Likely covers
- water
Listing history 10 events
-
2026-03-15status Pending
-
2026-02-28historical Active - Contingent
-
2026-02-27price $305,000
-
2026-02-11price $315,000
-
2026-01-29price $325,000
-
2026-01-13$340,000 Active
-
2022-09-09historical
-
2022-08-24price $331,429
-
2022-07-05$356,429 Active
-
2022-05-31soldstatus $471,600
ⓘ Source: listings_history table (triggers on properties + properties_extension) + one-shot
backfill from property_details.listing_events for pre-trigger history.
Tax reassessment forecast SC · Resets to sale price
- Current annual tax
- $1,980 · $165/mo
- Projected year-2 tax
- $1,980 · $165/mo
- Expected delta
- $0/yr ($0/mo · 0.0%)
ⓘ Screening estimate from a state-policy table — verify with the county assessor before closing.
Climate risk First Street
- Flood 1/10 Low FEMA zone X (unshaded) · 0% chance over 30 yrs
- Wildfire 4/10 Moderate
- Heat 6/10 Major 7 d/yr ≥107°F today · 15 d/yr by 30 yrs out
- Wind 6/10 Major 59% chance of damaging wind over 30 yrs
- Air quality 3/10 Moderate 3 unhealthy d/yr today · 3 by 30 yrs out
Nearby sold comps map
Loading sold comps map…
Walkable amenities ~0.75 mi
Loading nearby amenities…
Taxation est. · year 1
- Rental income
- $27,343
- − Mortgage interest
- −$17,085
- − Property taxes
- −$1,980
- − Insurance
- −$1,525
- − Repairs & maintenance
- −$2,187
- − Management
- −$2,187
- − HOA
- −$480
- − Depreciation
- −$8,873
- Taxable loss
- −$6,974
- Est. tax savings @ 24.0%
- +$1,674
- After-tax cash flow
- $96/yr
For passive investors: Depreciation is non-cash, so a rental often shows a tax loss while cash-flowing — sheltering income. Rental losses are passive: they offset passive income freely, and up to $25,000/yr can offset ordinary (W-2) income if you actively participate and your MAGI is under $100k (phasing out to $0 by $150k); unused losses carry forward. On sale, claimed depreciation is recaptured at up to 25%, and gains may owe capital-gains tax (a 1031 exchange can defer both). Figures are a year-1 estimate at your 24.0% rate — not tax advice; consult a CPA.
Schools (NCES district)
- District
- Lexington 01
- NCES district ID
- 4502700
- Math proficiency
- 42% ▼ -12.00%
- Reading proficiency
- 53% ▼ -2.00%
- Median HH income
- $61,298
- Composite
- 41.75/100
- National rank
- #3399
- State rank
- #11 of 80 in SC
Livability — Gilbert
- Score
- 71/100
- State rank
- #52
- US rank
- #7008
Category grades
Schools grade is shown separately in the Schools card above.
Census & demographics
- County
- Lexington County · 232,571 people
- Metro
- Columbia, SC
- Population (ZIP)
- 69,407
- Household income
- $106,382
- Rent vs Own
- Severe rent burden
- 858.0
Population outlook (Lexington County) Hauer SSP2
- Today (2025)
- 322,999 people
- By 2030
- 342,356 · +6.0%
- By 2040
- 377,715 · +16.9%
- By 2050
- 406,984 · +26.0%
- By 2075
- 465,447 · +44.1%
- By 2100
- 485,674 · +50.4%
Race, ethnicity, and origin ACS 2023
- Neighborhood character
- Predominantly White (80%)
- Race & ethnicity
- White 80% Black 7% Hispanic / Latino 5% Two or more races 5% Asian 4%
- Hispanic origin (detail)
- Mexican 1%
- Common ancestry
- Italian 4% Serbian 3% Romanian 3%
- Foreign-born
- 7% · Canada, Jamaica, China
- Languages at home
- 91% English-only · Spanish 4% Other Indo-European 1% Other Asian/Pacific 1%
Political lean MEDSL · Lexington
- 2024 margin
- Solid R (+33.5) · D 32.5% · R 66.0% · Other 1.4%
- 2008→2024 swing
- +4.6pp toward D · 2008: -38.0pp · 2024: -33.5pp
- All cycles
- 2024: R+33.5 2020: R+30.1 2016: R+36.7 2012: R+37.8 2008: R+38.0
Not yet ingested
- Civics
- —
Market trends
- HPI YoY
- ▼ -197.53%
- Current HPI
- 212.3235
- Rent YoY
- ▲ 3.23%
- Metro
- Columbia, SC
- State GDP YoY
- ▲ 4.51%
- F500 in state
- 2
Industry mix (Fortune 500 HQ in SC)
| Industry | F500 HQs | Revenue |
|---|---|---|
| Packaging | 1 | $7B |
|
||
Price history
-35.3% since first listed10 events — show timeline
- 2026-03-15 Pending — Consolidated MLS
- 2026-02-28 Contingent — Consolidated MLS
- 2026-02-27 Price Changed $305,000 Consolidated MLS
- 2026-02-11 Price Changed $315,000 Consolidated MLS
- 2026-01-29 Price Changed $325,000 Consolidated MLS
- 2026-01-13 Listed $340,000 Consolidated MLS
- 2022-09-09 Delisted — Consolidated MLS
- 2022-08-24 Price Changed $331,429 Consolidated MLS
- 2022-07-05 Listed $356,429 Consolidated MLS
- 2022-05-31 Sold (Public Records) $471,600 Public Records
Cash-flow waterfall
monthlySold comps — $/sqft
last 12 mo · ≤1 miLoading sold comps…