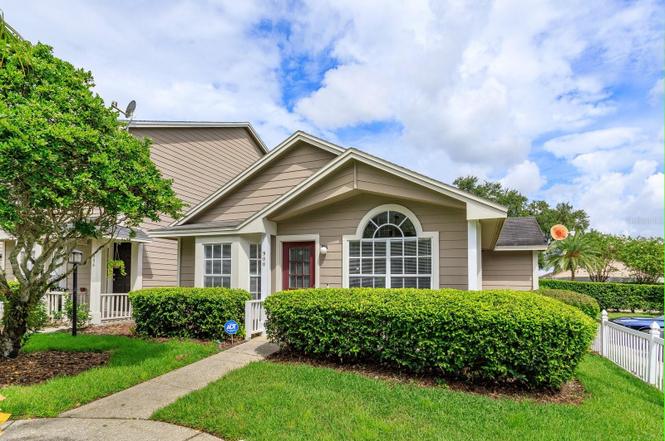
900 Sykes Ct #108 · Alafaya, FL
Flood risk 1/10 · Minimal
- FEMA flood zone
- X (unshaded)
- Chance of flooding over 30 yrs
- 0.0%
- Est. flood insurance / yr
- $507 – $1,088
Fire risk 5/10 · Moderate
- Est. fire insurance / yr
- $947 – $1,759
Heat risk 9/10 · Severe
- Hot days now (above 108°F)
- 7 days/yr
- Hot days in 30 yrs
- 22 days/yr
Wind risk 9/10 · Severe
- Chance of severe wind over 30 yrs
- 99.0%
Air-quality risk 2/10 · Minimal
- Unhealthy air days now
- 1 days/yr
- Unhealthy air days in 30 yrs
- 1 days/yr
Risk factors via First Street. Map © Google.
Why this score? — see what drove the D- grade
The composite is a weighted blend of 9 inputs, each scored 0–100. Each bar is that input's sub-score; the figure is the points it added to the 100-point composite (weight × sub-score).
- Cash flow +7.7/30.0
- ARV discount +7.5/15.0
- Appreciation +4.8/10.0
- 1% rule +4.4/10.0
- Schools +4.1/10.0
- Livability +4.1/5.0
- Rent growth +2.7/5.0
- Condition / age +2.5/5.0
- DSCR +1.8/10.0
$209,900
🖨 Deal sheet 📄 Offer letter ✓ Due diligence
Listing remarks
Step inside this charming villa-style condo perfectly situated just minutes from UCF, offering a blend of comfort, convenience, and low-maintenance living. The open layout creates a seamless flow between the spacious living and dining areas, with natural light pouring through large windows and glass doors that open to a private patio, ideal for morning coffee or evening relaxation. The kitchen is thoughtfully designed with ample cabinet space and a breakfast bar that makes entertaining easy. Each of the two bedrooms is generously sized, with the primary suite featuring its own en-suite bath and walk-in closet for added privacy. The second bedroom and full bath provide the perfect setup for
Key facts
- Private patio
- Ample cabinet space
- En suite bath
Tags
Property features AI
Finance
- Other: Total monthly fees reported $388; Total annual fees reported $4,656
- Financial info: Lease restrictions apply
- HOA & community: HOA managed by Empire Management; Monthly HOA fee approximately $83; Quarterly association fee ($249); Condo fee $90 per month; Association fee includes pool; Additional monthly maintenance amount $215; Community amenities: clubhouse, dog park, fitness center, park, pool, sidewalks, tennis courts; Pets allowed with breed restrictions
Exterior
- Parking: Attached garage
- Utilities: Public water; Public sewer; Electricity connected; Cable available; Broadband/High-speed internet available; Water connected; Sewer available
- Home design: Condominium; Single-story; Faces northwest; Unit on floor 1
- Construction: Frame construction; Shingle roof; Built on slab
- Exterior features: Covered patio; Screened patio; Patio; Rain gutters; Sliding doors; Outdoor storage; Corner lot; Landscaped; Asphalt road access
Interior
- Kitchen: Cooktop; Microwave; Disposal; Electric water heater
- Bedrooms: 2 bedrooms (first floor)
- Flooring: Tile; Slab foundation
- Bathrooms: 2 full bathrooms
- Heating & cooling: Central heating; Central air conditioning
- Interior features: Ceiling fans; Living room / dining room combo; Programmable thermostat; Walk-in closet(s); Window treatments
- Laundry & utility: Washer and dryer included; Inside laundry
Neighborhood map
What this means for you Summary
Snapshot
- This is a 2-bed/2.0-bath condo listed at $210k.
Deal economics
- At list price, monthly cash flow is $-238 ($-3k/yr) — negative.
- To cash-flow at today's rent, offer at most $168k (20.1% below list).
- To meet the 1% rule (rent ≥ 1% of price), the offer needs to be $197k (6.3% below list).
- Recommended offer: $168k (20.1% below list) — sets the bar for cash-flow.
- Cap rate 4.9% vs local median 3.5% in Alafaya — top-decile yield for the area; either an underpriced asset or a hidden risk that comps aren't pricing in. Stress-test before assuming the spread holds.
Location & tenants
- Location reads 82/100 on livability (#60 in FL, #1,076 nationally) — a professional / high-income tenant draw. Strengths: housing A+, health & safety A+, crime A; Watch: cost of living C-, schools D+.
- Orange (suburban): math 46% / reading 51% proficiency, ranked #43 of 73 in FL (top 59%) — families likely to look elsewhere, expect single-tenant / working-renter base with shorter leases.
- Market conditions: Rents flat; 320 active listings in the ZIP; 11 comparable units currently listed for rent nearby; rentals at typical pace (median 15d on market — plan ~3-4 weeks tenant-placement turnaround); solid renter incomes; 8,053 units permitted in Orange County in 2024 (3,133 in 5+ unit buildings).
Forward outlook
- In year one you build about $681 of equity ($1k loan paydown + $-770 appreciation (-0.4% local appreciation)).
- Orange County population projected at +52% by 2050 — long-run rental-demand tailwind backs the buy-and-hold thesis.
Negotiation context
- It's been on market 228 days — a 12% lower offer ($185k) is reasonable based on typical stale-listing flexibility.
- 2 sale attempts; this cycle's ask has dropped $50k (19%) from the opening price — seller is motivated, your offer sets the floor, not the list.
- Current owner paid $165k; 27% above their basis — modest negotiation headroom, anchor on the comps not their cost.
Risks & watch-outs
- Climate carrying-cost: severe wind risk, 99% chance of damaging wind over 30y; moderate wildfire risk; extreme-heat days projected 7→22/yr by 2055 (HVAC capex compounding) — expect insurance premiums to compound above CPI over the hold.
Questions for the listing agent
- What do current leases actually rent for vs. the listed asking? Can we see a recent rent roll and the last 12 months of T-12 income?
- It's been on market 228 days. Have you received any prior offers? Is the seller open to a 20% concession, seller financing, or rate buy-down credit?
- What does the HOA fee cover, when was the last increase, and are there any pending special assessments or reserve-fund shortfalls?
- Any open or pending special assessments — roof, HVAC, plumbing, elevator, façade? What's the per-unit balance and payoff schedule, and is the seller paying it off at close or rolling it to the buyer?
- Why hasn't it sold? Are there any deal-killer items the seller is aware of (foundation, flood, title, zoning, code violations)?
- Is there a deadline driving the sale (1031 exchange, divorce, estate, relocation)? That informs how much negotiation room exists.
- Schools are D-rated, which usually means shorter tenancies and higher turnover. Who's the typical renter profile here, and what's been the actual vacancy rate?
- The area grade is low — what's the realistic commute time and amenity access for the typical tenant pool here? Any planned neighborhood developments (good or bad) we should know about?
- What's the average days-on-market for RENTAL listings here right now (not sales)? A rising rental-DOM trend means longer vacancies and softer asking-rent achievability than the comps imply.
- What's the recent tenant-quality profile in this submarket — average credit score on applications, eviction rate, late-payment / NSF rate, and stable-employment percentage? A property-management company in the area should have these aggregated.
- How much new apartment / multifamily construction is in the pipeline within 1–3 miles? Heavy new supply (>2% of stock underway) typically softens rents 12–24 months out; light construction supports rent growth.
Investment metrics
- 1% rule
- 0.94% ✗
- Cap rate
- 4.93%
- Cash-on-cash
- -4.87%
- DSCR
- 0.78
- GRM
- 8.9
CMA / ARV
No comps found within radius.
Projected returns pro-forma
-0.37% appreciation · 0.82% rent growth · sell at horizon
- IRR
- -11.0%
- Equity multiple
- 0.51×
- Total profit
- $-28,893
- Equity at exit
- $57,125
- IRR
- -6.6%
- Equity multiple
- 0.37×
- Total profit
- $-36,767
- Equity at exit
- $65,686
Cash invested: $58,772 (down + closing). Projections, not guarantees.
Landlord ↔ Tenant lean methodology
- Overall (STATE)
- 87 Strongly Landlord-Friendly
- State Florida
- 87 Strongly Landlord-Friendly · R+3
- County
- — inherits STATE
- City
- — inherits STATE
ZIP-level market 32828
- Home prices YoY
- -0.1%
- Rents YoY
- 0.8%
- Active inventory
- 320
- Price-to-rent
- 8.9×
Monthly cashflow live
- Estimated rent
- $1,966 high interval (Pro) →
- Mortgage (P&I)
- −$1,101
- Tax from tax record
- −$216 /mo · $2,587/yr
- Insurance
- −$87
- HOA
- −$388
- Vacancy / Maint / Mgmt
- −$413
- Net cashflow
- $-238
Break-even live
UW: 25.0% down · 7.5% · 30yr · 1.5% tax · 5.0% vac · 8.0% maint · 8.0% mgmt
Financing live
Cash to close
- Down payment
- $52,475
- Closing costs
- $6,297
- Reserves months
- —
- Total cash needed
- —
Loan-product check · same deal, 3 products live
Conventional
25% down · 7.5% · 30yr
- Down + closing
- —
- Monthly P&I
- —
- Monthly cashflow
- —
- DSCR
- —
- Eligible?
- —
Personal DTI + credit; lowest rate.
DSCR
20% down · 8.5% · 30yr
- Down + closing
- —
- Monthly P&I
- —
- Monthly cashflow
- —
- DSCR
- —
- Eligible?
- —
No personal income docs; deal must DSCR.
Hard money
10% down · 12.0% · 12mo
- Down + closing
- —
- Monthly P&I
- —
- Monthly cashflow
- —
- DSCR
- —
- Eligible?
- —
Short-term bridge; refi at stabilization.
Rent comps 11 comps
| Address | Beds | Baths | Sqft | Rent | $/sqft | DOM | Units | Dist |
|---|---|---|---|---|---|---|---|---|
| 11701 Heritage Estates Ave Orlando, FL | 1.0–3.0 | 1.0–2.0 | 1059 | $1,990 | $1.88 | 1d | 10 | 0.51mi |
| 12101 Fountainbrook Blvd Orlando, FL | 1.0–3.0 | 1.0–2.0 | 968 | $1,996 | $2.06 | 2d | 17 | 0.89mi |
| 713 Crest Pines Dr #217 Orlando, FL | 2.0 | 2.0 | 1013 | $1,850 | $1.83 | 21d | 1 | 0.95mi |
| 725 Crest Pines Dr Orlando, FL | 2.0–3.0 | 2.0 | 1100 | $1,895 | $1.72 | 23d | 2 | 0.99mi |
| 725 Crest Pines Dr Unit 1 Orlando, FL | 2.0 | 2.0 | 1013 | $1,895 | $1.87 | 7d | 1 | 0.99mi |
| 12602 Crest Springs Ln #1318 Orlando, FL | 2.0 | 2.0 | 1013 | $1,975 | $1.95 | 14d | 1 | 1.03mi |
| 12500 Crest Springs Ln #1023 Orlando, FL | 2.0 | 2.0 | 1013 | $1,599 | $1.58 | 21d | 1 | 1.12mi |
| 12500 Crest Springs Ln #1014 Orlando, FL | 2.0 | 2.0 | 1013 | $1,700 | $1.68 | 10d | 1 | 1.12mi |
| 12932 Mallory Cir Orlando, FL | 1.0–3.0 | 1.0–2.0 | 1096 | $2,099 | $1.91 | 1d | 39 | 1.15mi |
| 12932 Mallory Cir Orlando, FL | 1.0–3.0 | 1.0–3.0 | 1173 | $2,180 | $1.86 | 16d | 49 | 1.15mi |
| 834 Oberry Hoover Rd Orlando, FL | 2.0 | 1.0 | 1061 | $1,750 | $1.65 | 23d | 1 | 1.31mi |
HOA detail condo
- Monthly dues
- $388 · $4,656/yr
- Assessments
- None detected in remarks — confirm with the listing agent.
Listing history 11 events
-
2026-04-30status Pending
-
2026-04-28price $209,900
-
2026-04-01price $219,900
-
2026-02-24status Active
-
2026-02-09status Pending
-
2025-12-31price $229,900
-
2025-10-15price $239,900
-
2025-09-18price $249,900
-
2025-08-29$259,900 Active
-
2005-06-20soldstatus $165,000
-
2004-07-13soldstatus $118,000
ⓘ Source: listings_history table (triggers on properties + properties_extension) + one-shot
backfill from property_details.listing_events for pre-trigger history.
Tax reassessment forecast FL · Resets to sale price
- Current annual tax
- $2,587 · $216/mo
- Projected year-2 tax
- $2,587 · $216/mo
- Expected delta
- $0/yr ($0/mo · 0.0%)
ⓘ Screening estimate from a state-policy table — verify with the county assessor before closing.
Climate risk First Street
- Flood 1/10 Low FEMA zone X (unshaded) · 0% chance over 30 yrs
- Wildfire 5/10 Major
- Heat 9/10 Extreme 7 d/yr ≥108°F today · 22 d/yr by 30 yrs out
- Wind 9/10 Extreme 99% chance of damaging wind over 30 yrs
- Air quality 2/10 Low 1 unhealthy d/yr today · 1 by 30 yrs out
Nearby sold comps map
Loading sold comps map…
Walkable amenities ~0.75 mi
Loading nearby amenities…
Taxation est. · year 1
- Rental income
- $23,597
- − Mortgage interest
- −$11,758
- − Property taxes
- −$2,587
- − Insurance
- −$1,050
- − Repairs & maintenance
- −$1,888
- − Management
- −$1,888
- − HOA
- −$4,656
- − Depreciation
- −$6,106
- Taxable loss
- −$6,334
- Est. tax savings @ 24.0%
- +$1,520
- After-tax cash flow
- $-1,339/yr
For passive investors: Depreciation is non-cash, so a rental often shows a tax loss while cash-flowing — sheltering income. Rental losses are passive: they offset passive income freely, and up to $25,000/yr can offset ordinary (W-2) income if you actively participate and your MAGI is under $100k (phasing out to $0 by $150k); unused losses carry forward. On sale, claimed depreciation is recaptured at up to 25%, and gains may owe capital-gains tax (a 1031 exchange can defer both). Figures are a year-1 estimate at your 24.0% rate — not tax advice; consult a CPA.
Schools (NCES district)
- District
- Orange
- NCES district ID
- 1201440
- Math proficiency
- 46% ▼ -9.00%
- Reading proficiency
- 51% ▼ -2.00%
- Median HH income
- $49,350
- Composite
- 41.47/100
- National rank
- #3461
- State rank
- #43 of 73 in FL
Livability — Alafaya
- Score
- 82/100
- State rank
- #60
- US rank
- #1076
Category grades
Schools grade is shown separately in the Schools card above.
Census & demographics
- Census place
- Alafaya, FL
- County
- Orange County · 1,471,359 people
- City population
- 131,972
- Metro
- Orlando-Kissimmee-Sanford, FL
- Population (ZIP)
- 69,202
- Household income
- $101,767
- Rent vs Own
- Severe rent burden
- 2213.0
Population outlook (Orange County) Hauer SSP2
- Today (2025)
- 1,618,226 people
- By 2030
- 1,787,404 · +10.5%
- By 2040
- 2,125,621 · +31.4%
- By 2050
- 2,454,016 · +51.6%
- By 2075
- 3,173,711 · +96.1%
- By 2100
- 3,607,781 · +122.9%
Race, ethnicity, and origin ACS 2023
- Neighborhood character
- Diverse neighborhood (Simpson 0.67)
- Race & ethnicity
- White 42% Hispanic / Latino 37% Two or more races 23% Black 9% Asian 7%
- Hispanic origin (detail)
- Mexican 1% Puerto Rican 19% Cuban 4% Dominican 3%
- Common ancestry
- Slovak 2% Romanian 1% Lithuanian 1%
- Foreign-born
- 20% · Canada, Jamaica, Vietnam
- Languages at home
- 63% English-only · Spanish 27% Other Indo-European 3% Arabic 1%
Political lean MEDSL · Orange
- 2024 margin
- D (+13.6) · D 56.1% · R 42.5% · Other 1.3%
- 2008→2024 swing
- -5.0pp toward R · 2008: 18.6pp · 2024: 13.6pp
- All cycles
- 2024: D+13.6 2020: D+23.1 2016: D+24.6 2012: D+18.2 2008: D+18.6
Not yet ingested
- Civics
- —
Market trends
- HPI YoY
- ▼ -0.37%
- Current HPI
- 284.5182
- Rent YoY
- ▲ 0.82%
- Metro
- Orlando-Kissimmee-Sanford, FL
- State GDP YoY
- ▲ 3.28%
- F500 in state
- 36
Industry mix (Fortune 500 HQ in FL)
| Industry | F500 HQs | Revenue |
|---|---|---|
| Industrial Technology | 2 | $29B |
|
||
| Insurance | 2 | $17B |
|
||
| Retail | 1 | $60B |
|
||
| Technology Distribution | 1 | $58B |
|
||
| Homebuilding | 1 | $35B |
|
||
| Technology Manufacturing | 1 | $35B |
|
||
Price history
+77.9% since first listed11 events — show timeline
- 2026-04-30 Pending — Stellar MLS as Distributed by MLS Grid
- 2026-04-28 Price Changed $209,900 Stellar MLS as Distributed by MLS Grid
- 2026-04-01 Price Changed $219,900 Stellar MLS as Distributed by MLS Grid
- 2026-02-24 Relisted — Stellar MLS as Distributed by MLS Grid
- 2026-02-09 Pending — Stellar MLS as Distributed by MLS Grid
- 2025-12-31 Price Changed $229,900 Stellar MLS as Distributed by MLS Grid
- 2025-10-15 Price Changed $239,900 Stellar MLS as Distributed by MLS Grid
- 2025-09-18 Price Changed $249,900 Stellar MLS as Distributed by MLS Grid
- 2025-08-29 Listed $259,900 Stellar MLS as Distributed by MLS Grid
- 2005-06-20 Sold (Public Records) $165,000 Public Records
- 2004-07-13 Sold (Public Records) $118,000 Public Records
Property tax history
+10.2%/yrLatest (2025): $2,587 · +11.1% YoY. Source: county tax records.
Cash-flow waterfall
monthlySold comps — $/sqft
last 12 mo · ≤1 miLoading sold comps…