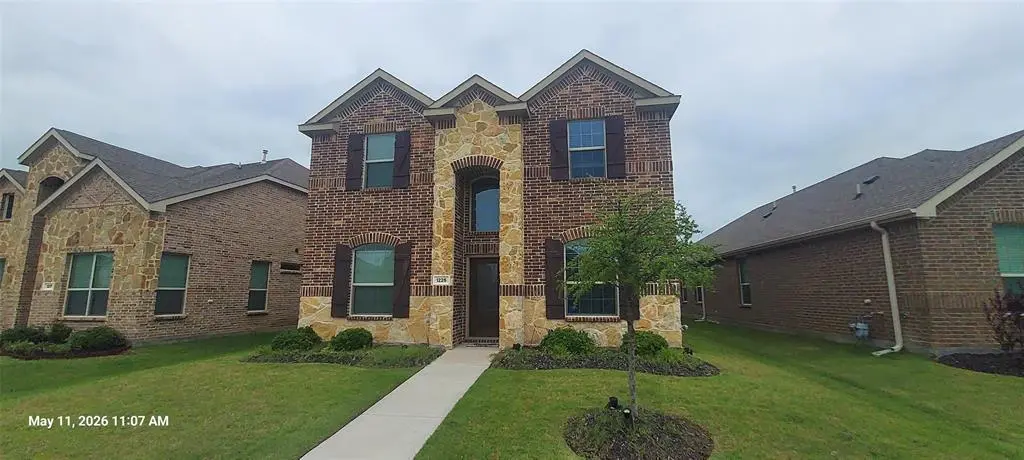
1225 Milfoil Dr · Fort Worth, TX
Flood risk 1/10 · Minimal
- FEMA flood zone
- X (unshaded)
- Chance of flooding over 30 yrs
- 0.0%
- Est. flood insurance / yr
- $507 – $1,088
Fire risk 3/10 · Minor
- Est. fire insurance / yr
- $1,222 – $2,270
Heat risk 8/10 · Major
- Hot days now (above 109°F)
- 7 days/yr
- Hot days in 30 yrs
- 23 days/yr
Wind risk 6/10 · Moderate
- Chance of severe wind over 30 yrs
- 27.0%
Air-quality risk 3/10 · Minor
- Unhealthy air days now
- 3 days/yr
- Unhealthy air days in 30 yrs
- 4 days/yr
Risk factors via First Street. Map © Google.
Why this score? — see what drove the C- grade
The composite is a weighted blend of 9 inputs, each scored 0–100. Each bar is that input's sub-score; the figure is the points it added to the 100-point composite (weight × sub-score).
- ARV discount +15.0/15.0
- Cash flow +12.8/30.0
- 1% rule +5.1/10.0
- Schools +4.6/10.0
- Livability +4.0/5.0
- Condition / age +4.0/5.0
- DSCR +3.8/10.0
- Rent growth +2.4/5.0
- Appreciation +0.0/10.0
$273,000
🖨 Deal sheet 📄 Offer letter ✓ Due diligence
Listing remarks
The list price is not indicative of seller's final reserve amount. This property is part of an online bidding event. Inspections of this property and contact with occupants are strictly prohibited. Property is sold as is and no for sale sign allowed.
Key facts
- 4,922 sq ft lot
- 2 garage spots
- Pool
Property features AI
Finance
- Other: Community features include clubhouse, community pool, greenbelt, jogging/bike path, and playground; Property restrictions: deed; Will subdivide: subdivided; Directions: From 114 head north on Winding Meadows Dr, right on Canyon Maple, right on Post Cedar, left on Milfoil. House on left.
- HOA & community: Mandatory HOA; Annual HOA fee; HOA covers full use of facilities, grounds maintenance, and management fees; HOA managed by Vision Community Management
Exterior
- Parking: Detached alley access and driveway available; Garage faces rear; Attached 2-car garage; 2 covered parking spaces
- Utilities: City water; City sewer; Cable available; Co-op electric; Not in a municipal utility district
- Home design: Single-family residence; Property attached (yes); Preowned home built in 2022; Brick construction; Composition roof; Slab foundation; Subdivision: Tradition Ph 1b
- Construction: Brick exterior; Composition roof; Slab foundation; Built in 2022
- Exterior features: Covered patio/porch; Wood fencing; Above-ground pool; Interior lot; Easements for utilities
Interior
- Kitchen: Granite countertops; Breakfast bar; Built-in cabinets; Pantry; Water line to refrigerator; Disposal
- Bedrooms: 4 bedrooms (primary bedroom on main level; additional bedrooms on second level)
- Flooring: Carpet; Ceramic tile
- Bathrooms: 3 full bathrooms
- Heating & cooling: Central heating; Ceiling fan(s)
- Interior features: Decorative lighting; Eat-in kitchen; Granite counters; Window coverings; Two living areas; Two dining areas; 5 total rooms; Two levels
- Laundry & utility: Utility room
Neighborhood map
What this means for you Summary
Snapshot
- This is a 4-bed/3.0-bath single-family listed at $273k. Condition is rated good.
Deal economics
- At list price, monthly cash flow is $-25 ($-303/yr) — negative.
- To cash-flow at today's rent, offer at most $269k (1.6% below list).
- Meets the 1% rule at list price ($3k rent vs $273k).
- Recommended offer: $265k (3.0% below list) — sets the bar for market timing.
- Cap rate 6.2% vs local median 3.9% in Fort Worth — top-decile yield for the area; either an underpriced asset or a hidden risk that comps aren't pricing in. Stress-test before assuming the spread holds.
Location & tenants
- Location reads 80/100 on livability (#49 in TX, #1,954 nationally) — a professional / high-income tenant draw. Strengths: amenities A+, cost of living A+, housing A+; Watch: schools D+, crime F.
- Northwest ISD (rural): math 48% / reading 52% proficiency, ranked #120 of 826 in TX (top 14%) — acceptable for families but not a draw, mixed tenant base, ~2y average lease.
- Market conditions: Rents soft (-0.5%/yr); 1498 active listings in the ZIP; 39 comparable units currently listed for rent nearby; rentals at typical pace (median 19d on market — plan ~3-4 weeks tenant-placement turnaround); high-income renter base; 10,531 units permitted in Denton County in 2024 (2,713 in 5+ unit buildings).
Forward outlook
- Local home prices are declining (-3.0%/yr); year-one equity from $2k of loan paydown is wiped out by about $8k of value loss. Plan a longer hold.
- Denton County population projected at +66% by 2050 — long-run rental-demand tailwind backs the buy-and-hold thesis.
Negotiation context
- It's been on market 34 days — a 3% lower offer ($265k) is reasonable based on typical stale-listing flexibility.
- 4 sale attempts; this cycle's ask is 173% above the opening price — seller raised mid-cycle; expect resistance to lowballs.
Risks & watch-outs
- Watch-outs: property tax is 2.6% of price.
- Climate carrying-cost: major wind risk, 27% chance of damaging wind over 30y; extreme-heat days projected 7→23/yr by 2055 (HVAC capex compounding) — expect insurance premiums to compound above CPI over the hold.
Questions for the listing agent
- What do current leases actually rent for vs. the listed asking? Can we see a recent rent roll and the last 12 months of T-12 income?
- It's been on market 34 days. Have you received any prior offers? Is the seller open to a 3% concession, seller financing, or rate buy-down credit?
- Property tax is high relative to price — has the assessment been appealed recently, and will the sale trigger a re-assessment?
- What does the HOA fee cover, when was the last increase, and are there any pending special assessments or reserve-fund shortfalls?
- Is there a deadline driving the sale (1031 exchange, divorce, estate, relocation)? That informs how much negotiation room exists.
- Schools are D-rated, which usually means shorter tenancies and higher turnover. Who's the typical renter profile here, and what's been the actual vacancy rate?
- Crime grade is F in this area — have there been break-ins, vandalism, or insurance claims at this property in the last 3 years? What carrier currently insures it and at what premium?
- What's the average days-on-market for RENTAL listings here right now (not sales)? A rising rental-DOM trend means longer vacancies and softer asking-rent achievability than the comps imply.
- What's the recent tenant-quality profile in this submarket — average credit score on applications, eviction rate, late-payment / NSF rate, and stable-employment percentage? A property-management company in the area should have these aggregated.
- How much new for-sale + rental construction is in the pipeline within 1–3 miles? Heavy new supply typically softens prices + rents 12–24 months out; constrained supply supports both.
Investment metrics
- 1% rule
- 1.01% ✓
- Cap rate
- 6.18%
- Cash-on-cash
- -0.40%
- DSCR
- 0.98
- GRM
- 8.2
CMA / ARV
- ARV (median comp)
- $391,670
- List price
- $273,000
- Delta
- -30.30%
- Verdict
- UNDERPRICED
- Comps
- 20 within 1.0 mi
Show comp detail 12 sales within ~0.75 mi
| Address | Dist | Beds/Ba | Sqft | Sold | Price | $/sf | Match |
|---|---|---|---|---|---|---|---|
| 1361 Dillard Creek Dr | 0.49mi | 4/3.0 | 2,215 (+2%) | 0mo | $399,000 | $180 | 74 |
| 16529 Woodside Dr | 0.43mi | 4/2.0 | 2,093 (-4%) | 1mo | $295,000 | $141 | 69 |
| 1801 Kittredge Way | 0.64mi | 4/2.5 | 2,136 (-2%) | 1mo | $310,000 | $145 | 64 |
| 921 Schuberts Rd | 0.75mi | 4/3.0 | 2,241 (+3%) | 2mo | $485,000 | $216 | 58 |
| 15936 Stableford Rd | 0.69mi | 4/2.0 | 2,039 (-6%) | 1mo | $409,970 | $201 | 53 |
| 1345 Elkford Ln | 0.58mi | 3/2.0 (-1) | 2,021 (-7%) | 0mo | $320,000 | $158 | 52 |
| 937 Schuberts Rd | 0.73mi | 4/2.0 | 2,016 (-7%) | 1mo | $389,390 | $193 | 49 |
| 812 Mountain Aloe Dr | 0.70mi | 3/2.5 (-1) | 1,992 (-8%) | 0mo | $449,000 | $225 | 46 |
| 949 Schuberts Rd | 0.72mi | 3/2.0 (-1) | 2,016 (-7%) | 0mo | $399,590 | $198 | 45 |
| 1360 Castlegar Ln | 0.67mi | 3/2.0 (-1) | 2,355 (+8%) | 1mo | $360,000 | $153 | 45 |
| 825 Mountain Aloe | 0.65mi | 4/3.0 | 2,476 (+14%) | 2mo | $469,000 | $189 | 45 |
| 1052 Alberta Spruce Rd | 0.72mi | 4/3.0 | 2,487 (+14%) | 2mo | $449,890 | $181 | 41 |
Match score weights: distance 35% · size 25% · config 20% · recency 20%. Top-matched comps best support the ARV.
Projected returns pro-forma
-3.0% appreciation · 0.0% rent growth · sell at horizon
- IRR
- -20.9%
- Equity multiple
- 0.30×
- Total profit
- $-53,701
- Equity at exit
- $40,705
- IRR
- -25.3%
- Equity multiple
- -0.04×
- Total profit
- $-79,137
- Equity at exit
- $23,604
Cash invested: $76,440 (down + closing). Projections, not guarantees.
Landlord ↔ Tenant lean methodology
- Overall (STATE)
- 87 Strongly Landlord-Friendly
- State Texas
- 87 Strongly Landlord-Friendly · R+5
- County
- — inherits STATE
- City
- — inherits STATE
ZIP-level market 76247
- Home prices YoY
- -13.3%
- Rents YoY
- -0.5%
- Active inventory
- 1498
- Price-to-rent
- 8.2×
Monthly cashflow live
- Estimated rent
- $2,761 high interval (Pro) →
- Mortgage (P&I)
- −$1,432
- Tax from tax record
- −$594 /mo · $7,128/yr
- Insurance
- −$114
- HOA
- −$67
- Vacancy / Maint / Mgmt
- −$580
- Net cashflow
- $-25
Break-even live
UW: 25.0% down · 7.5% · 30yr · 1.5% tax · 5.0% vac · 8.0% maint · 8.0% mgmt
Financing live
Cash to close
- Down payment
- $68,250
- Closing costs
- $8,190
- Reserves months
- —
- Total cash needed
- —
Loan-product check · same deal, 3 products live
Conventional
25% down · 7.5% · 30yr
- Down + closing
- —
- Monthly P&I
- —
- Monthly cashflow
- —
- DSCR
- —
- Eligible?
- —
Personal DTI + credit; lowest rate.
DSCR
20% down · 8.5% · 30yr
- Down + closing
- —
- Monthly P&I
- —
- Monthly cashflow
- —
- DSCR
- —
- Eligible?
- —
No personal income docs; deal must DSCR.
Hard money
10% down · 12.0% · 12mo
- Down + closing
- —
- Monthly P&I
- —
- Monthly cashflow
- —
- DSCR
- —
- Eligible?
- —
Short-term bridge; refi at stabilization.
Rent comps 39 comps
| Address | Beds | Baths | Sqft | Rent | $/sqft | DOM | Units | Dist |
|---|---|---|---|---|---|---|---|---|
| 1237 Milfoil Dr Justin, TX | 4.0 | 3.5 | 2561 | $2,950 | $1.15 | 5d | 1 | 0.06mi |
| 1275 Western Yarrow Ave Justin, TX | 3.0 | 3.0 | 2099 | $2,750 | $1.31 | 24d | 1 | 0.11mi |
| 1104 Milfoil Dr Justin, TX | 3.0 | 2.0 | 1745 | $2,500 | $1.43 | 1d | 1 | 0.12mi |
| 1133 Canuela Way Justin, TX | 4.0 | 3.0 | 2371 | $3,000 | $1.27 | 3d | 1 | 0.15mi |
| 16933 Sophora Ave Justin, TX | 4.0 | 3.5 | 2574 | $2,999 | $1.17 | 43d | 1 | 0.17mi |
| 1104 Superbloom Ave Justin, TX | 4.0 | 2.0 | 1992 | $3,000 | $1.51 | 24d | 1 | 0.25mi |
| 1073 Canuela Way Fort Worth, TX | 4.0 | 3.0 | 2519 | $2,795 | $1.11 | 2d | 1 | 0.26mi |
| 1448 Sun Garden Way Justin, TX | 4.0 | 2.5 | 2514 | $3,000 | $1.19 | 16d | 1 | 0.35mi |
| 1309 Water Canna Dr Northlake, TX | 3.0–4.0 | 2.0–3.0 | 1833 | $3,350 | $1.83 | 1d | 18 | 0.35mi |
| 1329 Water Canna Dr Northlake, TX | 3.0 | 2.0 | 1600 | $2,403 | $1.50 | 43d | 1 | 0.35mi |
| 1336 Water Canna Dr Justin, TX | 4.0 | 3.0 | 1914 | $2,819 | $1.47 | 43d | 1 | 0.38mi |
| 1444 Indian Mallow Ct Northlake, TX | 4.0 | 3.0 | 2066 | $3,020 | $1.46 | 12d | 1 | 0.44mi |
| 1617 Rialto Way Justin, TX | 3.0 | 2.0 | 1701 | $1,940 | $1.14 | 12d | 1 | 0.44mi |
| 16453 Severn Ln Justin, TX | 4.0 | 2.0 | 1839 | $2,400 | $1.31 | 1d | 1 | 0.46mi |
| 1440 Native Blooms Way Northlake, TX | 3.0 | 2.0 | 1706 | $2,760 | $1.62 | 7d | 1 | 0.48mi |
| 1713 Baxter Springs Dr Justin, TX | 4.0 | 2.0 | 2093 | $2,200 | $1.05 | 43d | 1 | 0.51mi |
| 16408 Severn Ln Justin, TX | 4.0 | 2.0 | 1839 | $2,475 | $1.35 | 24d | 1 | 0.51mi |
| 1705 Carolina Ridge Way Justin, TX | 3.0 | 2.0 | 1507 | $1,945 | $1.29 | 43d | 1 | 0.51mi |
| 1453 Native Blooms Way Northlake, TX | 3.0 | 2.0 | 1707 | $2,760 | $1.62 | 21d | 1 | 0.52mi |
| 1724 Trego Dr Justin, TX | 3.0 | 2.0 | 1710 | $1,900 | $1.11 | 43d | 1 | 0.55mi |
| 1708 Sierra Meadow Ln Justin, TX | 3.0 | 2.0 | 1647 | $2,125 | $1.29 | 21d | 1 | 0.56mi |
| 1401 Elkford Ln Justin, TX | 3.0 | 2.0 | 1872 | $2,400 | $1.28 | 24d | 1 | 0.58mi |
| 1724 Arbuckle Dr Justin, TX | 3.0 | 2.0 | 1647 | $1,850 | $1.12 | 18d | 1 | 0.59mi |
| 845 Ranchland Rd Justin, TX | 4.0 | 3.0 | 2673 | $3,400 | $1.27 | 24d | 1 | 0.61mi |
| 16329 Severn Ln Justin, TX | 4.0 | 2.0 | 2093 | $2,550 | $1.22 | 17d | 1 | 0.62mi |
| 1325 Amazon Dr Justin, TX | 3.0 | 2.0 | 1616 | $2,050 | $1.27 | 11d | 1 | 0.66mi |
| 949 Schuberts Rd Fort Worth, TX | 3.0 | 2.0 | 2016 | $2,900 | $1.44 | 4d | 1 | 0.68mi |
| 949 Schuberts Rd Fort Worth, TX | 3.0 | 2.0 | 2016 | $2,900 | $1.44 | 1d | 1 | 0.68mi |
| 1212 Amazon Dr Justin, TX | 3.0 | 2.0 | 1507 | $1,950 | $1.29 | 43d | 1 | 0.69mi |
| 16028 Bronte Ln Justin, TX | 4.0 | 2.0 | 2127 | $2,595 | $1.22 | 24d | 1 | 0.89mi |
| 16028 Bronte Ln Justin, TX | 4.0 | 2.0 | 2099 | $2,550 | $1.21 | 43d | 1 | 0.89mi |
| 16012 Bronte Ln Justin, TX | 4.0 | 2.0 | 2142 | $2,600 | $1.21 | 43d | 1 | 0.90mi |
| 1973 Lariat Dr Justin, TX | 3.0 | 2.0 | 1507 | $1,895 | $1.26 | 18d | 1 | 0.92mi |
| 2036 Navada Way Justin, TX | 4.0 | 2.5 | 2609 | $2,260 | $0.87 | 15d | 1 | 1.22mi |
| 1224 Napier Way Justin, TX | 4.0 | 2.0 | 2185 | $2,650 | $1.21 | 43d | 1 | 1.23mi |
| 1009 Croxley Way Justin, TX | 4.0 | 2.0 | 2100 | $2,600 | $1.24 | 18d | 1 | 1.36mi |
| 15736 Hazelhurst Ln Justin, TX | 4.0 | 2.0 | 2186 | $2,600 | $1.19 | 11d | 1 | 1.37mi |
| 15537 Putney Way Northlake, TX | 5.0 | 3.0 | 2093 | $2,650 | $1.27 | 18d | 1 | 1.42mi |
| 1033 Southwark Dr , TX | 4.0 | 2.0 | 2014 | $2,600 | $1.29 | 43d | 1 | 1.50mi |
HOA detail
- Monthly dues
- $67 · $804/yr
Listing history 26 events
-
2026-06-18days on market $273,000 Active 34 DOM
-
2026-06-17days on market $273,000 Active 33 DOM
-
2026-06-16days on market $273,000 Active 32 DOM
-
2026-06-15days on market $273,000 Active 31 DOM
-
2026-06-13pricedays on market $273,000 Active 29 DOM
-
2026-06-09days on market $100,000 Active 25 DOM
-
2026-06-08days on market $100,000 Active 24 DOM
-
2026-06-07days on market $100,000 Active 23 DOM
-
2026-06-04days on market $100,000 Active 20 DOM
-
2026-06-03days on market $100,000 Active 19 DOM
-
2026-06-02days on market $100,000 Active 18 DOM
-
2026-06-01days on market $100,000 Active 17 DOM
-
2026-05-31days on market $100,000 Active 16 DOM
-
2026-05-15$100,000 Active 250-char remark
-
2026-05-15historical
-
2026-04-11price $369,500
-
2025-12-28$379,500 Active
-
2025-12-19historical
-
2025-10-30price $379,500
-
2025-10-03price $389,900
-
2025-09-19$399,990 Active
-
2025-09-17historical
-
2025-08-30price $399,990
-
2025-07-05price $409,900
-
2025-06-08$424,500 Active
-
2022-10-25soldstatus
ⓘ Source: listings_history table (triggers on properties + properties_extension) + one-shot
backfill from property_details.listing_events for pre-trigger history.
Tax reassessment forecast TX · Resets to sale price
- Current annual tax
- $7,128 · $594/mo
- Projected year-2 tax
- $7,128 · $594/mo
- Expected delta
- $0/yr ($0/mo · 0.0%)
ⓘ Screening estimate from a state-policy table — verify with the county assessor before closing.
Climate risk First Street
- Flood 1/10 Low FEMA zone X (unshaded) · 0% chance over 30 yrs
- Wildfire 3/10 Moderate
- Heat 8/10 Severe 7 d/yr ≥109°F today · 23 d/yr by 30 yrs out
- Wind 6/10 Major 27% chance of damaging wind over 30 yrs
- Air quality 3/10 Moderate 3 unhealthy d/yr today · 4 by 30 yrs out
Nearby sold comps map
Loading sold comps map…
Walkable amenities ~0.75 mi
Loading nearby amenities…
Taxation est. · year 1
- Rental income
- $33,131
- − Mortgage interest
- −$15,292
- − Property taxes
- −$7,128
- − Insurance
- −$1,365
- − Repairs & maintenance
- −$2,650
- − Management
- −$2,650
- − HOA
- −$804
- − Depreciation
- −$7,942
- Taxable loss
- −$4,701
- Est. tax savings @ 24.0%
- +$1,128
- After-tax cash flow
- $825/yr
For passive investors: Depreciation is non-cash, so a rental often shows a tax loss while cash-flowing — sheltering income. Rental losses are passive: they offset passive income freely, and up to $25,000/yr can offset ordinary (W-2) income if you actively participate and your MAGI is under $100k (phasing out to $0 by $150k); unused losses carry forward. On sale, claimed depreciation is recaptured at up to 25%, and gains may owe capital-gains tax (a 1031 exchange can defer both). Figures are a year-1 estimate at your 24.0% rate — not tax advice; consult a CPA.
Condition & rehab AI · 13 photos
This home is in good condition with a good condition score of 80. It has a cosmetic rehab level and is move-in ready with minor maintenance items to address. The highest-ROI updates would be to paint the exterior and clean the gutters to enhance curb appeal and resale value.
Value-add opportunities
- Both Paint exterior — Enhances curb appeal and resale value
- Both Clean gutters — Improves drainage and aesthetics
- Both Replace light fixtures — Modernizes and improves energy efficiency
- Both Install smart home devices — Enhances convenience and energy efficiency
Renovation cost estimate screening
Value-add ROI direction
- Both Paint exterior — Enhances curb appeal and resale value ↑
- Both Clean gutters — Improves drainage and aesthetics ↑
- Both Replace light fixtures — Modernizes and improves energy efficiency ↑
- Both Install smart home devices — Enhances convenience and energy efficiency ↑
ⓘ Cost ranges are severity-bucket heuristics (US national rule-of-thumb). Get contractor quotes + a written scope before underwriting a rehab budget.
Schools (NCES district)
- District
- Northwest ISD
- NCES district ID
- 4833180
- Math proficiency
- 48% ▼ -15.00%
- Reading proficiency
- 52% ▼ -8.00%
- Median HH income
- $85,315
- Composite
- 46.15/100
- National rank
- #2504
- State rank
- #120 of 826 in TX
Livability — Fort Worth
- Score
- 80/100
- State rank
- #49
- US rank
- #1954
Category grades
Schools grade is shown separately in the Schools card above.
Census & demographics
- County
- Denton County · 901,654 people
- City population
- 10,200
- Metro
- Dallas-Fort Worth-Arlington, TX
- Population (ZIP)
- 21,726
- Household income
- $124,383
- Rent vs Own
- Severe rent burden
- 91.0
Population outlook (Denton County) Hauer SSP2
- Today (2025)
- 1,053,010 people
- By 2030
- 1,192,269 · +13.2%
- By 2040
- 1,472,920 · +39.9%
- By 2050
- 1,746,506 · +65.9%
- By 2075
- 2,358,497 · +124.0%
- By 2100
- 2,779,183 · +163.9%
Race, ethnicity, and origin ACS 2023
- Neighborhood character
- Predominantly White (74%)
- Race & ethnicity
- White 74% Hispanic / Latino 15% Two or more races 13% Black 3% Asian 3%
- Hispanic origin (detail)
- Mexican 8% Puerto Rican 4%
- Common ancestry
- Serbian 2% Romanian 1% Italian 1%
- Foreign-born
- 4% · Canada
- Languages at home
- 93% English-only · Spanish 4% Other Indo-European 1% Tagalog/Filipino 1%
Political lean MEDSL · Denton
- 2024 margin
- R (+13.2) · D 42.7% · R 55.8% · Other 1.5%
- 2008→2024 swing
- +11.0pp toward D · 2008: -24.2pp · 2024: -13.2pp
- All cycles
- 2024: R+13.2 2020: R+8.1 2016: R+20.2 2012: R+31.7 2008: R+24.2
Not yet ingested
- Civics
- —
Market trends
- HPI YoY
- ▼ -42.16%
- Current HPI
- 274.368
- Rent YoY
- ▼ -0.46%
- Metro
- Dallas-Fort Worth-Arlington, TX
- State GDP YoY
- ▲ 3.95%
- F500 in state
- 110
Industry mix (Fortune 500 HQ in TX)
| Industry | F500 HQs | Revenue |
|---|---|---|
| Energy | 16 | $1,198B |
|
||
| Technology | 5 | $198B |
|
||
| Engineering / Construction | 4 | $72B |
|
||
| Energy Services | 3 | $60B |
|
||
| Utilities | 3 | $41B |
|
||
| Healthcare | 2 | $330B |
|
||
Price history
-35.7% since first listed14 events — show timeline
- 2026-06-10 Price Changed $273,000 NTREIS
- 2026-05-15 Listing Removed — NTREIS
- 2026-05-15 Listed $100,000 NTREIS
- 2026-04-11 Price Changed $369,500 NTREIS
- 2025-12-28 Listed $379,500 NTREIS
- 2025-12-19 Listing Removed — NTREIS
- 2025-10-30 Price Changed $379,500 NTREIS
- 2025-10-03 Price Changed $389,900 NTREIS
- 2025-09-19 Listed $399,990 NTREIS
- 2025-09-17 Listing Removed — NTREIS
- 2025-08-30 Price Changed $399,990 NTREIS
- 2025-07-05 Price Changed $409,900 NTREIS
- 2025-06-08 Listed $424,500 NTREIS
- 2022-10-25 Sold (Public Records) — Public Records
Property tax history
+60.9%/yrLatest (2025): $7,128 · -13.6% YoY. Source: county tax records.
Cash-flow waterfall
monthlySold comps — $/sqft
last 12 mo · ≤1 miLoading sold comps…