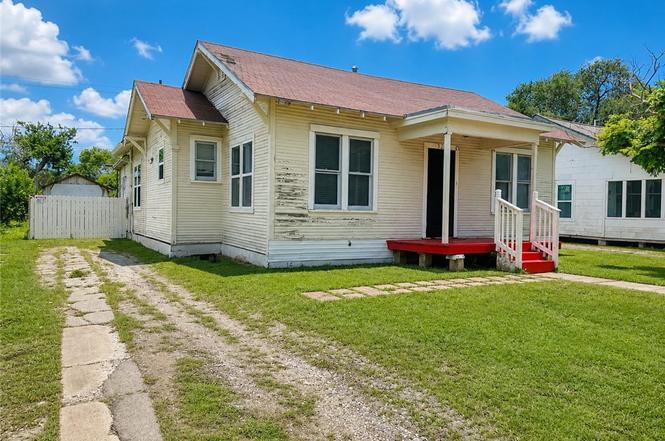
542 Mcintyre Ave · Taft, TX
Flood risk 1/10 · Minimal
- FEMA flood zone
- X (unshaded)
- Chance of flooding over 30 yrs
- 0.0%
- Est. flood insurance / yr
- $507 – $1,088
Fire risk 1/10 · Minimal
- Est. fire insurance / yr
- $1,222 – $2,270
Heat risk 10/10 · Severe
- Hot days now (above 107°F)
- 7 days/yr
- Hot days in 30 yrs
- 25 days/yr
Wind risk 9/10 · Severe
- Chance of severe wind over 30 yrs
- 99.0%
Air-quality risk 1/10 · Minimal
- Unhealthy air days now
- 0 days/yr
- Unhealthy air days in 30 yrs
- 0 days/yr
Risk factors via First Street. Map © Google.
Why this score? — see what drove the C grade
The composite is a weighted blend of 9 inputs, each scored 0–100. Each bar is that input's sub-score; the figure is the points it added to the 100-point composite (weight × sub-score).
- Cash flow +16.0/30.0
- ARV discount +15.0/15.0
- Appreciation +7.2/10.0
- 1% rule +5.6/10.0
- DSCR +4.9/10.0
- Livability +3.2/5.0
- Rent growth +2.5/5.0
- Condition / age +2.5/5.0
- Schools +2.0/10.0
$145,000
🖨 Deal sheet 📄 Offer letter ✓ Due diligence
Listing remarks MLS
Don’t pass up this PRICE ADJUSTMENT! Charming 2-bedroom home with a little mix of vintage & modern updates. Step inside to an open living & dining room & immediately be greeted by a decorative gas fireplace; followed by a spacious kitchen with a walk-in pantry & supply closet, original kitchen cabinets and a built-in 4-drawer cabinet with shelves on top. Modern updates include HVAC system installed approximately three years ago, partial re-roof in 2018 & water heater was installed prior to seller's purchased in 2018. The jack & jill bathroom features a modern vanity, countertop & light fixture. The primary bedroom leads into an enclosed bonus room featuring lots of windows, plumbing & off to the side is the washer/dryer connections in its own separate room. Step outside to an oversized backyard w/ plenty of room to entertain & a wood fence to allow those fur babies to roam. This home could use some TLC, but don’t let that stop you from taking a tour. Being sold AS-IS!
Key facts
- Two dining areas
- Decorative fireplace
- Dry bar
Tags
Property features AI
Finance
- HOA & community: Short term rentals allowed
Exterior
- Parking: Gravel parking; Rear/side off-street parking; RV access/parking; 4 parking spaces
- Security: Smoke detectors
- Utilities: Natural gas available; Electricity available; Public water; Public sewer; Phone service available
- Home design: Single-story home; Wood siding; Shingle roof; Pillar/post/pier foundation
- Construction: Wood siding construction; Shingle roof; Pillar/Post/Pier foundation
- Exterior features: Deck; Open deck/patio; Storage; Workshop; Wood fencing; Landscaped, interior lot
Interior
- Kitchen: Gas oven; Gas range; Kitchen island
- Bedrooms: Primary bedroom on the main level
- Flooring: Hardwood flooring
- Bathrooms: 2 full bathrooms
- Heating & cooling: Central heating (gas); Central air conditioning
- Interior features: Dry bar; Split bedroom layout; Cable TV available; Ceiling fans; Kitchen island; Decorative fireplace
- Laundry & utility: Washer hookup; Dryer hookup
Neighborhood map
What this means for you Summary
Snapshot
- This is a 2-bed/2.0-bath single-family listed at $145k.
Deal economics
- At list price, monthly cash flow is $71 ($849/yr) — positive.
- The deal already cash-flows at list — no discount required.
- Meets the 1% rule at list price ($2k rent vs $145k).
Location & tenants
- Location reads 65/100 on livability (#673 in TX) — a middle-class / working-renter tenant base. Strengths: crime A+, cost of living A+, housing A+; Watch: schools F, amenities F, commute F.
- Taft ISD (town): math 24% / reading 24% proficiency, ranked #727 of 826 in TX (top 88%) — low school quality limits family demand, transient renter base, plan for 1-2y turnover; 77% free/reduced lunch — lower-income household profile, screen leases tightly.
- Market conditions: 60 active listings in the ZIP; 3 comparable units currently listed for rent nearby; rentals at typical pace (median 14d on market — plan ~3-4 weeks tenant-placement turnaround); 344 units permitted in San Patricio County in 2024 (0 in 5+ unit buildings).
Forward outlook
- In year one you build about $7k of equity ($1k loan paydown + $6k appreciation (4.4% local appreciation)).
- San Patricio County population projected at +27% by 2050 — long-run rental-demand tailwind backs the buy-and-hold thesis.
- At projected returns (4.4% appreciation + 3.0% rent growth), your $41k cash investment doubles in ~5 years — after that, you're playing with house money.
- By year 5, paydown + projected appreciation supports a ~$32k cash-out refi (75% LTV) — recoverable capital for the next deal without selling this one.
Negotiation context
- Only 4 days on market — expect competitive offers; lowballing is unlikely to land.
- 3 sale attempts since 9y ago with the ask held roughly flat each time — persistent listings suggest the price (not the market) is what's stuck; bring a comps-based counter.
Risks & watch-outs
- Watch-outs: property tax is 2.7% of price; built in 1936 — expect roof / HVAC / electrical / plumbing capex.
- Climate carrying-cost: severe wind risk, 99% chance of damaging wind over 30y; extreme-heat days projected 7→25/yr by 2055 (HVAC capex compounding) — expect insurance premiums to compound above CPI over the hold.
Questions for the listing agent
- Built in 1936 — when were the roof, HVAC, electrical panel, plumbing, and water heater last replaced?
- Property tax is high relative to price — has the assessment been appealed recently, and will the sale trigger a re-assessment?
- Is there a deadline driving the sale (1031 exchange, divorce, estate, relocation)? That informs how much negotiation room exists.
- Schools are F-rated, which usually means shorter tenancies and higher turnover. Who's the typical renter profile here, and what's been the actual vacancy rate?
- What's the average days-on-market for RENTAL listings here right now (not sales)? A rising rental-DOM trend means longer vacancies and softer asking-rent achievability than the comps imply.
- What's the recent tenant-quality profile in this submarket — average credit score on applications, eviction rate, late-payment / NSF rate, and stable-employment percentage? A property-management company in the area should have these aggregated.
- How much new for-sale + rental construction is in the pipeline within 1–3 miles? Heavy new supply typically softens prices + rents 12–24 months out; constrained supply supports both.
Investment metrics
- 1% rule
- 1.06% ✓
- Cap rate
- 6.88%
- Cash-on-cash
- 2.09%
- DSCR
- 1.09
- GRM
- 7.9
CMA / ARV
- ARV (on-the-fly)
- $192,318
- Comps found
- 12
Show comp detail 12 sales within ~0.75 mi
| Address | Dist | Beds/Ba | Sqft | Sold | Price | $/sf | Match |
|---|---|---|---|---|---|---|---|
| 808 Fetick Ave | 0.31mi | 2/2.0 | 1,432 (-1%) | 2mo | $163,900 | $114 | 83 |
| 714 Reynolds Ave | 0.33mi | 2/2.0 | 1,472 (+2%) | 1mo | $165,000 | $112 | 81 |
| 401 Field Ave | 0.25mi | 3/2.0 (+1) | 1,396 (-4%) | 5mo | $159,900 | $115 | 74 |
| 621 Tutt Ave | 0.13mi | 3/2.0 (+1) | 1,324 (-8%) | 6mo | $189,000 | $143 | 70 |
| 623 Field Ave | 0.20mi | 3/2.0 (+1) | 1,571 (+9%) | 6mo | $174,900 | $111 | 67 |
| 407 Reynolds Ave | 0.30mi | 3/2.0 (+1) | 1,318 (-9%) | 4mo | $244,900 | $186 | 63 |
| 202 Reynolds Ave | 0.40mi | 2/2.0 | 1,568 (+8%) | 7mo | $149,900 | $96 | 61 |
| 914 Fetick Ave | 0.45mi | 3/2.0 (+1) | 1,412 (-2%) | 16mo | $239,900 | $170 | 57 |
| 7092 County Road 4121 | 0.52mi | 3/2.0 (+1) | 1,537 (+6%) | 5mo | $205,000 | $133 | 56 |
| 402 Reynolds Ave | 0.33mi | 3/1.0 (+1) | 1,389 (-4%) | 16mo | $219,000 | $158 | 56 |
| 327 Field Ave | 0.27mi | 3/2.0 (+1) | 1,624 (+12%) | 13mo | $139,900 | $86 | 51 |
| 918 Tutt Ave | 0.45mi | 3/2.0 (+1) | 1,652 (+14%) | 12mo | $225,900 | $137 | 40 |
Match score weights: distance 35% · size 25% · config 20% · recency 20%. Top-matched comps best support the ARV.
Projected returns pro-forma
4.44% appreciation · 3.0% rent growth · sell at horizon
- IRR
- 13.3%
- Equity multiple
- 1.82×
- Total profit
- $33,417
- Equity at exit
- $77,255
- IRR
- 14.4%
- Equity multiple
- 3.46×
- Total profit
- $99,690
- Equity at exit
- $129,435
Cash invested: $40,600 (down + closing). Projections, not guarantees.
Landlord ↔ Tenant lean methodology
- Overall (STATE)
- 87 Strongly Landlord-Friendly
- State Texas
- 87 Strongly Landlord-Friendly · R+5
- County
- — inherits STATE
- City
- — inherits STATE
ZIP-level market 78390
- Home prices YoY
- 3.7%
- Active inventory
- 60
- Price-to-rent
- 7.9×
Monthly cashflow live
- Estimated rent
- $1,535 medium interval (Pro) →
- Mortgage (P&I)
- −$760
- Tax from tax record
- −$321 /mo · $3,855/yr
- Insurance
- −$60
- HOA
- −$0
- Vacancy / Maint / Mgmt
- −$322
- Net cashflow
- $71
Break-even live
UW: 25.0% down · 7.5% · 30yr · 1.5% tax · 5.0% vac · 8.0% maint · 8.0% mgmt
Financing live
Cash to close
- Down payment
- $36,250
- Closing costs
- $4,350
- Reserves months
- —
- Total cash needed
- —
Loan-product check · same deal, 3 products live
Conventional
25% down · 7.5% · 30yr
- Down + closing
- —
- Monthly P&I
- —
- Monthly cashflow
- —
- DSCR
- —
- Eligible?
- —
Personal DTI + credit; lowest rate.
DSCR
20% down · 8.5% · 30yr
- Down + closing
- —
- Monthly P&I
- —
- Monthly cashflow
- —
- DSCR
- —
- Eligible?
- —
No personal income docs; deal must DSCR.
Hard money
10% down · 12.0% · 12mo
- Down + closing
- —
- Monthly P&I
- —
- Monthly cashflow
- —
- DSCR
- —
- Eligible?
- —
Short-term bridge; refi at stabilization.
Rent comps 3 comps
| Address | Beds | Baths | Sqft | Rent | $/sqft | DOM | Units | Dist |
|---|---|---|---|---|---|---|---|---|
| 508 Tutt Ave Taft, TX | 2.0 | 1.0 | 936 | $1,150 | $1.23 | 44d | 1 | 0.15mi |
| 620 Reynolds Ave Taft, TX | 3.0 | 2.0 | 1482 | $1,900 | $1.28 | 14d | 1 | 0.28mi |
| 414 3rd St Taft, TX | 3.0 | 2.0 | 1476 | $1,800 | $1.22 | 14d | 1 | 0.67mi |
Listing history 5 events
-
2026-06-18days on market $145,000 Active 4 DOM
-
2026-06-17days on market $145,000 Active 3 DOM
-
2026-06-16days on market $145,000 Active 2 DOM
-
2026-06-15remarks 699-char remark
-
2026-06-15$145,000 Active 1 DOM
ⓘ Source: listings_history table (triggers on properties + properties_extension) + one-shot
backfill from property_details.listing_events for pre-trigger history.
Tax reassessment forecast TX · Resets to sale price
- Current annual tax
- $3,855 · $321/mo
- Projected year-2 tax
- $3,855 · $321/mo
- Expected delta
- $0/yr ($0/mo · -0.0%)
ⓘ Screening estimate from a state-policy table — verify with the county assessor before closing.
Climate risk First Street
- Flood 1/10 Low FEMA zone X (unshaded) · 0% chance over 30 yrs
- Wildfire 1/10 Low
- Heat 10/10 Extreme 7 d/yr ≥107°F today · 25 d/yr by 30 yrs out
- Wind 9/10 Extreme 99% chance of damaging wind over 30 yrs
- Air quality 1/10 Low 0 unhealthy d/yr today · 0 by 30 yrs out
Nearby sold comps map
Loading sold comps map…
Walkable amenities ~0.75 mi
Loading nearby amenities…
Taxation est. · year 1
- Rental income
- $18,423
- − Mortgage interest
- −$8,122
- − Property taxes
- −$3,855
- − Insurance
- −$725
- − Repairs & maintenance
- −$1,474
- − Management
- −$1,474
- − Depreciation
- −$4,218
- Taxable loss
- −$1,445
- Est. tax savings @ 24.0%
- +$347
- After-tax cash flow
- $1,196/yr
For passive investors: Depreciation is non-cash, so a rental often shows a tax loss while cash-flowing — sheltering income. Rental losses are passive: they offset passive income freely, and up to $25,000/yr can offset ordinary (W-2) income if you actively participate and your MAGI is under $100k (phasing out to $0 by $150k); unused losses carry forward. On sale, claimed depreciation is recaptured at up to 25%, and gains may owe capital-gains tax (a 1031 exchange can defer both). Figures are a year-1 estimate at your 24.0% rate — not tax advice; consult a CPA.
Schools (NCES district)
- District
- Taft ISD
- NCES district ID
- 4842060
- Math proficiency
- 24% ▼ -6.00%
- Reading proficiency
- 24% ▲ 2.00%
- Median HH income
- $40,110
- Composite
- 20.29/100
- National rank
- #8618
- State rank
- #727 of 826 in TX
Livability — Taft
- Score
- 65/100
- State rank
- #673
- US rank
- #12651
Category grades
Schools grade is shown separately in the Schools card above.
Census & demographics
- Census place
- Taft, TX
- Population (ZIP)
- 5,620
Population outlook (San Patricio County) Hauer SSP2
- Today (2025)
- 75,538 people
- By 2030
- 79,575 · +5.3%
- By 2040
- 87,670 · +16.1%
- By 2050
- 96,107 · +27.2%
- By 2075
- 117,984 · +56.2%
- By 2100
- 130,010 · +72.1%
Race, ethnicity, and origin ACS 2023
- Neighborhood character
- Predominantly Hispanic (78%)
- Race & ethnicity
- Hispanic / Latino 78% Two or more races 52% White 21%
- Hispanic origin (detail)
- Mexican 75%
- Common ancestry
- Slovak 1% Lithuanian 1%
- Foreign-born
- 3% · Canada
- Languages at home
- 61% English-only · Spanish 39%
Political lean MEDSL · San Patricio
- 2024 margin
- Solid R (+36.4) · D 31.4% · R 67.8%
- 2008→2024 swing
- -19.8pp toward R · 2008: -16.6pp · 2024: -36.4pp
- All cycles
- 2024: R+36.4 2020: R+29.1 2016: R+24.1 2012: R+20.6 2008: R+16.6
Not yet ingested
- Civics
- —
Market trends
- HPI YoY
- ▲ 4.44%
- Current HPI
- 123.4461
- Rent YoY
- —
- Metro
- —
- State GDP YoY
- ▲ 3.95%
- F500 in state
- 110
Industry mix (Fortune 500 HQ in TX)
| Industry | F500 HQs | Revenue |
|---|---|---|
| Energy | 16 | $1,198B |
|
||
| Technology | 5 | $198B |
|
||
| Engineering / Construction | 4 | $72B |
|
||
| Energy Services | 3 | $60B |
|
||
| Utilities | 3 | $41B |
|
||
| Healthcare | 2 | $330B |
|
||
Price history
+38.1% since first listed14 events — show timeline
- 2026-06-12 Listed $145,000 CBMLS
- 2024-12-31 Sold (Public Records) — Public Records
- 2024-12-31 Sold (Public Records) — Public Records
- 2024-12-30 Sold (MLS) — CBMLS
- 2024-12-14 Pending — CBMLS
- 2024-12-03 Contingent — CBMLS
- 2024-10-15 Price Changed $95,000 CBMLS
- 2024-09-06 Listed $110,000 CBMLS
- 2018-02-23 Sold (Public Records) — Public Records
- 2018-02-21 Delisted — CBMLS
- 2018-02-20 Sold (MLS) — CBMLS
- 2018-01-19 Pending — CBMLS
- 2017-11-16 Price Changed $99,900 CBMLS
- 2017-11-01 Listed $105,000 CBMLS
Property tax history
+12.0%/yrLatest (2025): $3,855 · +17.5% YoY. Source: county tax records.
Cash-flow waterfall
monthlySold comps — $/sqft
last 12 mo · ≤1 miLoading sold comps…