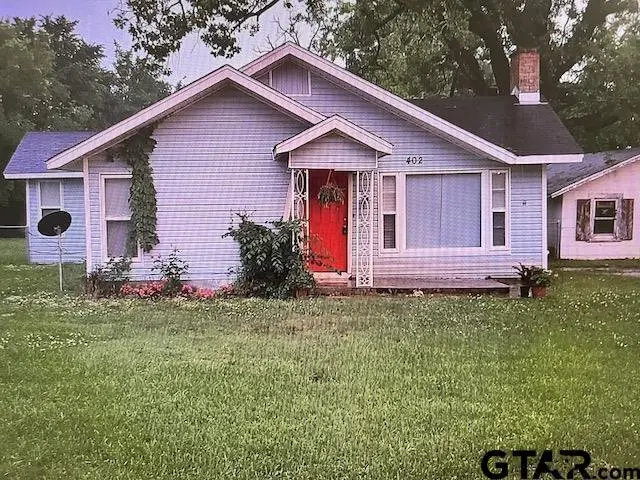
402 Clarksville · Bogata, TX
Flood risk 1/10 · Minimal
- FEMA flood zone
- X
- Chance of flooding over 30 yrs
- 0.0%
- Est. flood insurance / yr
- $507 – $1,088
Fire risk 8/10 · Major
- Est. fire insurance / yr
- $1,222 – $2,270
Heat risk 7/10 · Major
- Hot days now (above 110°F)
- 7 days/yr
- Hot days in 30 yrs
- 23 days/yr
Wind risk 6/10 · Moderate
- Chance of severe wind over 30 yrs
- 27.0%
Air-quality risk 1/10 · Minimal
- Unhealthy air days now
- 0 days/yr
- Unhealthy air days in 30 yrs
- 0 days/yr
Risk factors via First Street. Map © Google.
Why this score? — see what drove the C grade
The composite is a weighted blend of 9 inputs, each scored 0–100. Each bar is that input's sub-score; the figure is the points it added to the 100-point composite (weight × sub-score).
- ARV discount +13.9/15.0
- Cash flow +12.4/30.0
- Appreciation +9.9/10.0
- Schools +4.1/10.0
- DSCR +3.7/10.0
- 1% rule +3.1/10.0
- Livability +3.1/5.0
- Rent growth +2.5/5.0
- Condition / age +2.5/5.0
$139,900
🖨 Deal sheet 📄 Offer letter ✓ Due diligence
Listing remarks MLS
Welcome to this charming 3-bedroom, 1-bath home situated on a spacious corner ½-acre lot, offering the perfect blend of comfort and convenience. Recently updated and leveled, this home features an open-concept living and dining area that feels bright and inviting, highlighted by a cozy fireplace and a huge picture window that fills the space with natural light. The thoughtful layout makes everyday living and entertaining both easy and enjoyable. Step outside to a fenced yard with plenty of room to relax, garden, or let pets play freely. Located within walking distance from town, you’ll enjoy the benefits of small-town living with easy access to local shops, dining, and amenities. With its recent updates, generous lot size, and welcoming atmosphere, this property is a wonderful place to call home. Don’t miss your chance to see it!
Key facts
- Huge picture window
- Fenced yard
- Open-concept living
Tags
Neighborhood map
What this means for you Summary
Snapshot
- This is a 3-bed/1.0-bath single-family listed at $140k.
Deal economics
- At list price, monthly cash flow is $-23 ($-277/yr) — negative.
- To cash-flow at today's rent, offer at most $136k (2.9% below list).
- To meet the 1% rule (rent ≥ 1% of price), the offer needs to be $113k (19.3% below list).
- Recommended offer: $113k (19.3% below list) — sets the bar for 1% rule.
Location & tenants
- Location reads 62/100 on livability (#915 in TX) — a middle-class / working-renter tenant base. Strengths: crime A+, cost of living A+, housing A+; Watch: schools D-, amenities F, commute F.
- Rivercrest ISD (rural): math 50% / reading 48% proficiency, ranked #212 of 826 in TX (top 26%) — families likely to look elsewhere, expect single-tenant / working-renter base with shorter leases.
- Market conditions: 25 active listings in the ZIP; 14 units permitted in Red River County in 2024 (0 in 5+ unit buildings).
Forward outlook
- In year one you build about $15k of equity ($967 loan paydown + $14k appreciation (9.8% local appreciation)).
- Red River County population projected at -25% by 2050 — secular population decline; favor cash flow + early exit over multi-decade hold.
- At projected returns (9.8% appreciation + 3.0% rent growth), your $39k cash investment doubles in ~3 years — after that, you're playing with house money.
- By year 3, paydown + projected appreciation supports a ~$37k cash-out refi (75% LTV) — recoverable capital for the next deal without selling this one.
Negotiation context
- It's been on market 63 days — a 6% lower offer ($132k) is reasonable based on typical stale-listing flexibility.
- 5 sale attempts since 2y ago; this cycle's ask is 9893% above the opening price — seller raised mid-cycle; expect resistance to lowballs.
Risks & watch-outs
- Watch-outs: built in 1931 — expect roof / HVAC / electrical / plumbing capex.
- Climate carrying-cost: major wind risk, 27% chance of damaging wind over 30y; severe wildfire risk; extreme-heat days projected 7→23/yr by 2055 (HVAC capex compounding) — expect insurance premiums to compound above CPI over the hold.
Questions for the listing agent
- What do current leases actually rent for vs. the listed asking? Can we see a recent rent roll and the last 12 months of T-12 income?
- It's been on market 63 days. Have you received any prior offers? Is the seller open to a 19% concession, seller financing, or rate buy-down credit?
- Built in 1931 — when were the roof, HVAC, electrical panel, plumbing, and water heater last replaced?
- Why hasn't it sold? Are there any deal-killer items the seller is aware of (foundation, flood, title, zoning, code violations)?
- Is there a deadline driving the sale (1031 exchange, divorce, estate, relocation)? That informs how much negotiation room exists.
- Schools are D-rated, which usually means shorter tenancies and higher turnover. Who's the typical renter profile here, and what's been the actual vacancy rate?
- What's the average days-on-market for RENTAL listings here right now (not sales)? A rising rental-DOM trend means longer vacancies and softer asking-rent achievability than the comps imply.
- What's the recent tenant-quality profile in this submarket — average credit score on applications, eviction rate, late-payment / NSF rate, and stable-employment percentage? A property-management company in the area should have these aggregated.
- How much new for-sale + rental construction is in the pipeline within 1–3 miles? Heavy new supply typically softens prices + rents 12–24 months out; constrained supply supports both.
Investment metrics
- 1% rule
- 0.81% ✗
- Cap rate
- 6.09%
- Cash-on-cash
- -0.71%
- DSCR
- 0.97
- GRM
- 10.3
CMA / ARV
- ARV (median comp)
- $163,027
- List price
- $139,900
- Delta
- -14.19%
- Verdict
- UNDERPRICED
- Comps
- 16 within 1.0 mi
Show comp detail 5 sales within ~0.75 mi
| Address | Dist | Beds/Ba | Sqft | Sold | Price | $/sf | Match |
|---|---|---|---|---|---|---|---|
| 332 S Lawson St | 0.53mi | 3/2.0 | 1,484 (-0%) | 9mo | $112,000 | $75 | 63 |
| 195 S Howison | 0.40mi | 3/1.0 | 1,629 (+9%) | 6mo | $58,000 | $36 | 61 |
| 714 Clarksville Rd | 0.42mi | 3/2.0 | 1,376 (-8%) | 11mo | $170,000 | $124 | 55 |
| 115 Brooks Dr | 0.68mi | 3/1.5 | 1,682 (+13%) | 7mo | $169,900 | $101 | 39 |
| 637 S Bryson St | 0.50mi | 3/2.0 | 1,678 (+12%) | 20mo | $204,500 | $122 | 36 |
Match score weights: distance 35% · size 25% · config 20% · recency 20%. Top-matched comps best support the ARV.
Projected returns pro-forma
9.79% appreciation · 3.0% rent growth · sell at horizon
- IRR
- 23.3%
- Equity multiple
- 2.86×
- Total profit
- $72,718
- Equity at exit
- $123,916
- IRR
- 20.8%
- Equity multiple
- 6.48×
- Total profit
- $214,750
- Equity at exit
- $265,008
Cash invested: $39,172 (down + closing). Projections, not guarantees.
Landlord ↔ Tenant lean methodology
- Overall (STATE)
- 87 Strongly Landlord-Friendly
- State Texas
- 87 Strongly Landlord-Friendly · R+5
- County
- — inherits STATE
- City
- — inherits STATE
ZIP-level market 75417
- Home prices YoY
- 6.2%
- Active inventory
- 25
- Price-to-rent
- 10.3×
Monthly cashflow live
- Estimated rent
- $1,129 medium interval (Pro) →
- Mortgage (P&I)
- −$734
- Tax from tax record
- −$123 /mo · $1,474/yr
- Insurance
- −$58
- HOA
- −$0
- Vacancy / Maint / Mgmt
- −$237
- Net cashflow
- $-23
Break-even live
UW: 25.0% down · 7.5% · 30yr · 1.5% tax · 5.0% vac · 8.0% maint · 8.0% mgmt
Financing live
Cash to close
- Down payment
- $34,975
- Closing costs
- $4,197
- Reserves months
- —
- Total cash needed
- —
Loan-product check · same deal, 3 products live
Conventional
25% down · 7.5% · 30yr
- Down + closing
- —
- Monthly P&I
- —
- Monthly cashflow
- —
- DSCR
- —
- Eligible?
- —
Personal DTI + credit; lowest rate.
DSCR
20% down · 8.5% · 30yr
- Down + closing
- —
- Monthly P&I
- —
- Monthly cashflow
- —
- DSCR
- —
- Eligible?
- —
No personal income docs; deal must DSCR.
Hard money
10% down · 12.0% · 12mo
- Down + closing
- —
- Monthly P&I
- —
- Monthly cashflow
- —
- DSCR
- —
- Eligible?
- —
Short-term bridge; refi at stabilization.
Listing history 26 events
-
2026-06-19days on market $139,900 Active 63 DOM
-
2026-06-18days on market $139,900 Active 62 DOM
-
2026-06-17days on market $139,900 Active 61 DOM
-
2026-06-16days on market $139,900 Active 60 DOM
-
2026-06-15days on market $139,900 Active 59 DOM
-
2026-06-14days on market $139,900 Active 57 DOM
-
2026-06-12days on market $139,900 Active 56 DOM
-
2026-06-09days on market $139,900 Active 53 DOM
-
2026-06-08days on market $139,900 Active 52 DOM
-
2026-06-07days on market $139,900 Active 51 DOM
-
2026-06-05days on market $139,900 Active 49 DOM
-
2026-06-02days on market $139,900 Active 46 DOM
-
2026-06-01days on market $139,900 Active 45 DOM
-
2026-05-31days on market $139,900 Active 44 DOM
-
2026-05-30days on market $139,900 Active 43 DOM
-
2026-05-14historical $1,400
-
2026-05-12$1,400
-
2026-05-11historical $1,450
-
2026-04-17$139,900 Active 860-char remark
Show marketing remark (860 chars)
Welcome to this charming 3-bedroom, 1-bath home situated on a spacious corner ½-acre lot, offering the perfect blend of comfort and convenience. Recently updated and leveled, this home features an open-concept living and dining area that feels bright and inviting, highlighted by a cozy fireplace and a huge picture window that fills the space with natural light. The thoughtful layout makes everyday living and entertaining both easy and enjoyable. Step outside to a fenced yard with plenty of room to relax, garden, or let pets play freely. Located within walking distance from town, you’ll enjoy the benefits of small-town living with easy access to local shops, dining, and amenities. With its recent updates, generous lot size, and welcoming atmosphere, this property is a wonderful place to call home. Don’t miss your chance to see it!
-
2026-04-16$1,450
-
2025-03-01historical $1,300
-
2025-02-28historical $1,300
-
2024-12-03$1,300
-
2024-12-03$1,300
-
2022-05-19price $1,300
-
2021-05-19soldstatus
ⓘ Source: listings_history table (triggers on properties + properties_extension) + one-shot
backfill from property_details.listing_events for pre-trigger history.
Tax reassessment forecast TX · Resets to sale price
- Current annual tax
- $1,474 · $123/mo
- Projected year-2 tax
- $2,560 · $213/mo
- Expected delta
- +$1,086/yr (+$91/mo · 73.7%)
ⓘ Screening estimate from a state-policy table — verify with the county assessor before closing.
Climate risk First Street
- Flood 1/10 Low FEMA zone X · 0% chance over 30 yrs
- Wildfire 8/10 Severe
- Heat 7/10 Severe 7 d/yr ≥110°F today · 23 d/yr by 30 yrs out
- Wind 6/10 Major 27% chance of damaging wind over 30 yrs
- Air quality 1/10 Low 0 unhealthy d/yr today · 0 by 30 yrs out
Nearby sold comps map
Loading sold comps map…
Walkable amenities ~0.75 mi
Loading nearby amenities…
Taxation est. · year 1
- Rental income
- $13,545
- − Mortgage interest
- −$7,837
- − Property taxes
- −$1,474
- − Insurance
- −$700
- − Repairs & maintenance
- −$1,084
- − Management
- −$1,084
- − Depreciation
- −$4,070
- Taxable loss
- −$2,702
- Est. tax savings @ 24.0%
- +$649
- After-tax cash flow
- $372/yr
For passive investors: Depreciation is non-cash, so a rental often shows a tax loss while cash-flowing — sheltering income. Rental losses are passive: they offset passive income freely, and up to $25,000/yr can offset ordinary (W-2) income if you actively participate and your MAGI is under $100k (phasing out to $0 by $150k); unused losses carry forward. On sale, claimed depreciation is recaptured at up to 25%, and gains may owe capital-gains tax (a 1031 exchange can defer both). Figures are a year-1 estimate at your 24.0% rate — not tax advice; consult a CPA.
Schools (NCES district)
- District
- Rivercrest ISD
- NCES district ID
- 4842120
- Math proficiency
- 50% ▼ -7.00%
- Reading proficiency
- 48% ▲ 5.00%
- Median HH income
- $39,064
- Composite
- 40.93/100
- National rank
- #3611
- State rank
- #212 of 826 in TX
Livability — Bogata
- Score
- 62/100
- State rank
- #915
- US rank
- #16355
Category grades
Schools grade is shown separately in the Schools card above.
Census & demographics
- Census place
- Bogata, TX
- Population (ZIP)
- 2,204
Population outlook (Red River County) Hauer SSP2
- Today (2025)
- 11,454 people
- By 2030
- 10,874 · -5.1%
- By 2040
- 9,715 · -15.2%
- By 2050
- 8,552 · -25.3%
- By 2075
- 6,042 · -47.2%
- By 2100
- 4,037 · -64.8%
Race, ethnicity, and origin ACS 2023
- Neighborhood character
- Predominantly White (81%)
- Race & ethnicity
- White 81% Hispanic / Latino 13% Native American 7% Two or more races 2% Black 1%
- Hispanic origin (detail)
- Mexican 13%
- Common ancestry
- Italian 1% Lithuanian 1% Serbian 1%
- Foreign-born
- 2% · Canada
- Languages at home
- 98% English-only · Spanish 2%
Political lean MEDSL · Red River
- 2024 margin
- Solid R (+61.8) · D 19.0% · R 80.8%
- 2008→2024 swing
- -23.7pp toward R · 2008: -38.0pp · 2024: -61.8pp
- All cycles
- 2024: R+61.8 2020: R+56.3 2016: R+53.9 2012: R+40.7 2008: R+38.0
Not yet ingested
- Civics
- —
Market trends
- HPI YoY
- ▲ 9.79%
- Current HPI
- 166.851
- Rent YoY
- —
- Metro
- —
- State GDP YoY
- ▲ 3.95%
- F500 in state
- 110
Industry mix (Fortune 500 HQ in TX)
| Industry | F500 HQs | Revenue |
|---|---|---|
| Energy | 16 | $1,198B |
|
||
| Technology | 5 | $198B |
|
||
| Engineering / Construction | 4 | $72B |
|
||
| Energy Services | 3 | $60B |
|
||
| Utilities | 3 | $41B |
|
||
| Healthcare | 2 | $330B |
|
||
Price history
+7.7% since first listed11 events — show timeline
- 2026-05-14 Rental Removed $1,400 Simplifyem
- 2026-05-12 Listed for Rent $1,400 Simplifyem
- 2026-05-11 Rental Removed $1,450 GTAR
- 2026-04-17 Listed $139,900 GTAR
- 2026-04-16 Listed for Rent $1,450 GTAR
- 2025-03-01 Rental Removed $1,300 RENT.
- 2025-02-28 Rental Removed $1,300 GTAR
- 2024-12-03 Listed for Rent $1,300 RENT.
- 2024-12-03 Listed for Rent $1,300 GTAR
- 2022-05-19 Price Changed $1,300 RENT.
- 2021-05-19 Sold (Public Records) — Public Records
Property tax history
+3.3%/yrLatest (2025): $1,474 · -43.5% YoY. Source: county tax records.
Cash-flow waterfall
monthlySold comps — $/sqft
last 12 mo · ≤1 miLoading sold comps…