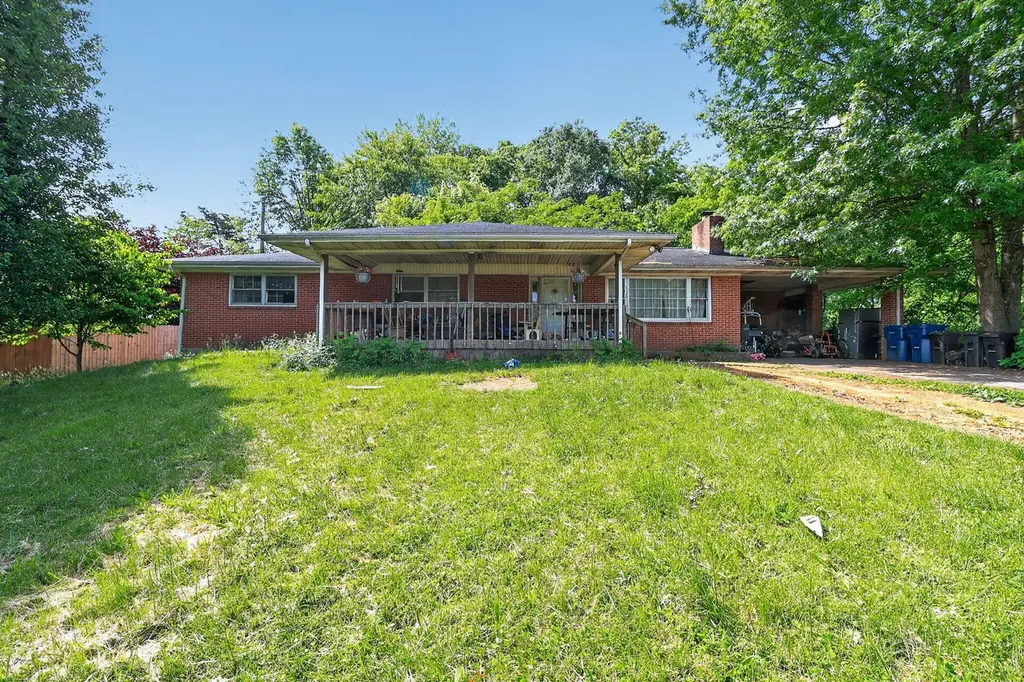
906 Horseshoe Dr · Burnside, KY
Flood risk 5/10 · Moderate
- FEMA flood zone
- X (unshaded)
- Chance of flooding over 30 yrs
- 0.24%
- Est. flood insurance / yr
- $507 – $1,088
Fire risk 3/10 · Minor
- Est. fire insurance / yr
- $839 – $1,559
Heat risk 5/10 · Moderate
- Hot days now (above 103°F)
- 7 days/yr
- Hot days in 30 yrs
- 20 days/yr
Wind risk 3/10 · Minor
- Chance of severe wind over 30 yrs
- 5.0%
Air-quality risk 1/10 · Minimal
- Unhealthy air days now
- 0 days/yr
- Unhealthy air days in 30 yrs
- 0 days/yr
Risk factors via First Street. Map © Google.
Why this score? — see what drove the C+ grade
The composite is a weighted blend of 9 inputs, each scored 0–100. Each bar is that input's sub-score; the figure is the points it added to the 100-point composite (weight × sub-score).
- Cash flow +24.9/30.0
- ARV discount +13.8/15.0
- DSCR +8.1/10.0
- 1% rule +5.5/10.0
- Schools +4.0/10.0
- Livability +3.6/5.0
- Rent growth +2.5/5.0
- Condition / age +2.5/5.0
- Appreciation +0.0/10.0
$167,000
🖨 Deal sheet (PDF) 📄 Offer letter ✓ Due diligence
Listing remarks
Opportunity awaits at 906 Horseshoe Drive in Somerset, KY! This spacious home offers multiple living areas, generously sized bedrooms, and a flexible layout ready for your personal touch. The large living room features plenty of natural light and opens into a roomy kitchen and dining area with abundant cabinet space. With several spacious bedrooms and a functional floor plan, this property provides plenty of room for everyday living, entertaining, or investment potential. Hardwood-style flooring throughout much of the home adds character, while the layout offers flexibility for a variety of needs.
Key facts
- 4 acre lot
- Parking
- Built 1970
Property features AI
Exterior
- Parking: Carport
- Utilities: Septic tank sewer
- Home design: Rural subdivision
- Construction: 1,711 total building area
- Exterior features: Brick veneer exterior; Block foundation; Public water
Interior
- Bedrooms: Total rooms: 7
- Flooring: Hardwood; Tile
- Bathrooms: 1 full bathroom; 1 half bathroom
- Heating & cooling: Electric heating; Central air conditioning
- Interior features: Hardwood and tile flooring; Central air
Neighborhood map
What this means for you Summary
Snapshot
- This is a 2-bed/1.0-bath single-family listed at $167k.
Deal economics
- At list price, monthly cash flow is $359 ($4k/yr) — positive.
- The deal already cash-flows at list — no discount required.
- Meets the 1% rule at list price ($2k rent vs $167k).
- Recommended offer: $162k (3.0% below list) — sets the bar for market timing.
- Cap rate 8.9% vs local median 2.9% in Burnside — top-decile yield for the area; either an underpriced asset or a hidden risk that comps aren't pricing in. Stress-test before assuming the spread holds.
Location & tenants
- Location reads 71/100 on livability (#141 in KY) — a middle-class / working-renter tenant base. Strengths: crime A+, cost of living A+, health & safety A+; Watch: amenities F, commute F.
- Pulaski County (town): math 43% / reading 53% proficiency, ranked #17 of 165 in KY (top 10%) — families likely to look elsewhere, expect single-tenant / working-renter base with shorter leases.
- Zoned schools: Southern Elementary School (math 46% / reading 51%, grade D, #110 of 676 statewide, top 17%, 655 students, 74% FRL); Southern Middle School (math 41% / reading 50%, grade D+, #32 of 217 statewide, top 15%, 941 students, 68% FRL); Southwestern High School (math 33% / reading 43%, grade F, #55 of 254 statewide, top 22%, 1,265 students, 64% FRL).
- Market conditions: 192 active listings in the ZIP; 1 comparable units currently listed for rent nearby; 117 units permitted in Pulaski County in 2024 (50 in 5+ unit buildings).
Forward outlook
- Local home prices are declining (-3.0%/yr); year-one equity from $1k of loan paydown is wiped out by about $5k of value loss. Plan a longer hold.
Negotiation context
- It's been on market 40 days — a 3% lower offer ($162k) is reasonable based on typical stale-listing flexibility.
- Current owner paid $75k; list at $167k implies a 123% gain — meaningful room to come down on a strong offer.
Risks & watch-outs
- Climate carrying-cost: moderate flood risk; extreme-heat days projected 7→20/yr by 2055 (HVAC capex compounding) — expect insurance premiums to compound above CPI over the hold.
Questions for the listing agent
- It's been on market 40 days. Have you received any prior offers? Is the seller open to a 3% concession, seller financing, or rate buy-down credit?
- Built in 1970 — when were the roof, HVAC, electrical panel, plumbing, and water heater last replaced?
- Is there a deadline driving the sale (1031 exchange, divorce, estate, relocation)? That informs how much negotiation room exists.
- Schools are D-rated, which usually means shorter tenancies and higher turnover. Who's the typical renter profile here, and what's been the actual vacancy rate?
- What's the average days-on-market for RENTAL listings here right now (not sales)? A rising rental-DOM trend means longer vacancies and softer asking-rent achievability than the comps imply.
- What's the recent tenant-quality profile in this submarket — average credit score on applications, eviction rate, late-payment / NSF rate, and stable-employment percentage? A property-management company in the area should have these aggregated.
- How much new for-sale + rental construction is in the pipeline within 1–3 miles? Heavy new supply typically softens prices + rents 12–24 months out; constrained supply supports both.
Investment metrics
- 1% rule
- 1.05% ✓
- Cap rate
- 8.87%
- Cash-on-cash
- 9.21%
- DSCR
- 1.41
- GRM
- 8.0
CMA / ARV
- ARV (median comp)
- $194,022
- List price
- $167,000
- Delta
- -13.93%
- Verdict
- UNDERPRICED
- Comps
- 20 within 1.0 mi
Show comp detail 6 sales within ~0.75 mi
| Address | Dist | Beds/Ba | Sqft | Sold | Price | $/sf | Match |
|---|---|---|---|---|---|---|---|
| 848 Horseshoe Dr | 0.06mi | 3/2.0 (+1) | 1,811 (+6%) | 20mo | $225,000 | $124 | 62 |
| 115 Waycross St | 0.25mi | 3/1.5 (+1) | 1,836 (+7%) | 23mo | $208,000 | $113 | 50 |
| 110 Starlite Dr | 0.28mi | 3/2.0 (+1) | 1,496 (-13%) | 11mo | $230,000 | $154 | 48 |
| 60 Ironwood Dr | 0.47mi | 3/2.5 (+1) | 1,850 (+8%) | 12mo | $285,000 | $154 | 43 |
| 175 Sycamore Trl | 0.67mi | 3/2.0 (+1) | 1,500 (-12%) | 17mo | $149,000 | $99 | 25 |
| 317 Woodland Trl | 0.61mi | 3/2.0 (+1) | 1,475 (-14%) | 19mo | $175,000 | $119 | 23 |
Match score weights: distance 35% · size 25% · config 20% · recency 20%. Top-matched comps best support the ARV.
Projected returns pro-forma
-3.0% appreciation · 3.0% rent growth · sell at horizon
- IRR
- -2.4%
- Equity multiple
- 0.91×
- Total profit
- $-4,263
- Equity at exit
- $24,900
- IRR
- 7.2%
- Equity multiple
- 1.55×
- Total profit
- $25,496
- Equity at exit
- $14,439
Cash invested: $46,760 (down + closing). Projections, not guarantees.
Landlord ↔ Tenant lean methodology
- Overall (STATE)
- 83 Strongly Landlord-Friendly
- State Kentucky
- 83 Strongly Landlord-Friendly · R+16
- County
- — inherits STATE
- City
- — inherits STATE
ZIP-level market 42501
- Home prices YoY
- -19.8%
- Active inventory
- 192
- Price-to-rent
- 8.0×
Monthly cashflow live
- Estimated rent
- $1,750 medium interval (Pro) →
- Mortgage (P&I)
- −$876
- Tax from tax record
- −$78 /mo · $940/yr
- Insurance
- −$70
- HOA
- −$0
- Vacancy / Maint / Mgmt
- −$368
- Net cashflow
- $359
Break-even live
Sensitivity live
| Price | -10% $453 | -5% $406 | +0% $359 | +5% $312 | +10% $264 |
|---|---|---|---|---|---|
| Rent | -10% $221 | -5% $290 | +0% $359 | +5% $428 | +10% $497 |
| Rate | -1.0pp $443 | -0.5pp $401 | base $359 | +0.5pp $316 | +1.0pp $272 |
UW: 25.0% down · 7.5% · 30yr · 1.5% tax · 5.0% vac · 8.0% maint · 8.0% mgmt
Financing live
Cash to close
- Down payment
- $41,750
- Closing costs
- $5,010
- Reserves months
- —
- Total cash needed
- —
Loan-product check · same deal, 3 products live
Conventional
25% down · 7.5% · 30yr
- Down + closing
- —
- Monthly P&I
- —
- Monthly cashflow
- —
- DSCR
- —
- Eligible?
- —
Personal DTI + credit; lowest rate.
DSCR
20% down · 8.5% · 30yr
- Down + closing
- —
- Monthly P&I
- —
- Monthly cashflow
- —
- DSCR
- —
- Eligible?
- —
No personal income docs; deal must DSCR.
Hard money
10% down · 12.0% · 12mo
- Down + closing
- —
- Monthly P&I
- —
- Monthly cashflow
- —
- DSCR
- —
- Eligible?
- —
Short-term bridge; refi at stabilization.
Rent comps 1 comps
| Address | Beds | Baths | Sqft | Rent | $/sqft | DOM | Units | Dist |
|---|---|---|---|---|---|---|---|---|
| 931 Hidden Loop Dr Somerset, KY | 3.0 | 2.0 | 1750 | $1,750 | $1.00 | 45d | 1 | 1.14mi |
Listing history 15 events
-
2026-06-16status $167,000 Pending 40 DOM
-
2026-06-15days on market $167,000 Active 40 DOM
-
2026-06-13days on market $167,000 Active 38 DOM
-
2026-06-12days on market $167,000 Active 37 DOM
-
2026-06-09days on market $167,000 Active 34 DOM
-
2026-06-08days on market $167,000 Active 33 DOM
-
2026-06-07days on market $167,000 Active 32 DOM
-
2026-06-07pricedays on market $167,000 Active 31 DOM
-
2026-06-04days on market $170,000 Active 28 DOM
-
2026-06-02days on market $170,000 Active 27 DOM
-
2026-06-01days on market $170,000 Active 26 DOM
-
2026-05-31days on market $170,000 Active 25 DOM
-
2026-05-31days on market $170,000 Active 24 DOM
-
2026-05-05$175,000 Active 605-char remark
-
2017-03-10soldstatus $75,000
ⓘ Source: listings_history table (triggers on properties + properties_extension) + one-shot
backfill from property_details.listing_events for pre-trigger history.
Tax reassessment forecast KY · Resets to sale price
- Current annual tax
- $940 · $78/mo
- Projected year-2 tax
- $1,436 · $120/mo
- Expected delta
- +$496/yr (+$41/mo · 52.8%)
ⓘ Screening estimate from a state-policy table — verify with the county assessor before closing.
Climate risk First Street
- Flood 5/10 Major FEMA zone X (unshaded) · 24% chance over 30 yrs
- Wildfire 3/10 Moderate
- Heat 5/10 Major 7 d/yr ≥103°F today · 20 d/yr by 30 yrs out
- Wind 3/10 Moderate 5% chance of damaging wind over 30 yrs
- Air quality 1/10 Low 0 unhealthy d/yr today · 0 by 30 yrs out
Nearby sold comps map
Loading sold comps map…
Walkable amenities ~0.75 mi
Loading nearby amenities…
Taxation est. · year 1
- Rental income
- $21,000
- − Mortgage interest
- −$9,355
- − Property taxes
- −$940
- − Insurance
- −$835
- − Repairs & maintenance
- −$1,680
- − Management
- −$1,680
- − Depreciation
- −$4,858
- Taxable income
- $1,652
- Est. tax owed @ 24.0%
- −$396
- After-tax cash flow
- $3,909/yr
For passive investors: Depreciation is non-cash, so a rental often shows a tax loss while cash-flowing — sheltering income. Rental losses are passive: they offset passive income freely, and up to $25,000/yr can offset ordinary (W-2) income if you actively participate and your MAGI is under $100k (phasing out to $0 by $150k); unused losses carry forward. On sale, claimed depreciation is recaptured at up to 25%, and gains may owe capital-gains tax (a 1031 exchange can defer both). Figures are a year-1 estimate at your 24.0% rate — not tax advice; consult a CPA.
Schools (NCES district)
- District
- Pulaski County
- NCES district ID
- 2104950
- Math proficiency
- 43% ▼ -18.00%
- Reading proficiency
- 53% ▼ -13.00%
- Median HH income
- $35,366
- Composite
- 39.69/100
- National rank
- #3906
- State rank
- #17 of 165 in KY
Livability — Burnside
- Score
- 71/100
- State rank
- #141
- US rank
- #6774
Category grades
Schools grade is shown separately in the Schools card above.
Census & demographics
- Population (ZIP)
- 17,441
Population outlook (Pulaski County) Hauer SSP2
- Today (2025)
- 65,414 people
- By 2030
- 65,828 · +0.6%
- By 2040
- 65,972 · +0.9%
- By 2050
- 65,108 · -0.5%
- By 2075
- 61,647 · -5.8%
- By 2100
- 53,613 · -18.0%
Race, ethnicity, and origin ACS 2023
- Neighborhood character
- Predominantly White (91%)
- Race & ethnicity
- White 91% Two or more races 3% Hispanic / Latino 3% Black 2%
- Common ancestry
- Slovak 3% Serbian 2% Italian 2%
- Foreign-born
- 1%
Political lean MEDSL · Pulaski
- 2024 margin
- Solid R (+65.2) · D 16.9% · R 82.1% · Other 1.0%
- 2008→2024 swing
- -9.9pp toward R · 2008: -55.4pp · 2024: -65.2pp
- All cycles
- 2024: R+65.2 2020: R+62.7 2016: R+66.7 2012: R+60.5 2008: R+55.4
Not yet ingested
- Civics
- —
Market trends
- HPI YoY
- ▼ -70.04%
- Current HPI
- 284.0445
- Rent YoY
- —
- Metro
- —
- State GDP YoY
- ▲ 1.81%
- F500 in state
- 4
Industry mix (Fortune 500 HQ in KY)
| Industry | F500 HQs | Revenue |
|---|---|---|
| Healthcare | 1 | $118B |
|
||
| Food / Beverage | 1 | $7B |
|
||
Price history
+122.7% since first listed5 events — show timeline
- 2026-06-15 Pending — ImagineMLS
- 2026-06-04 Price Changed $167,000 ImagineMLS
- 2026-05-29 Price Changed $170,000 ImagineMLS
- 2026-05-05 Listed $175,000 ImagineMLS
- 2017-03-10 Sold (Public Records) $75,000 Public Records
Property tax history
+6.2%/yrLatest (2025): $940 · -2.3% YoY. Source: county tax records.
Cash-flow waterfall
monthlySold comps — $/sqft
last 12 mo · ≤1 miLoading sold comps…