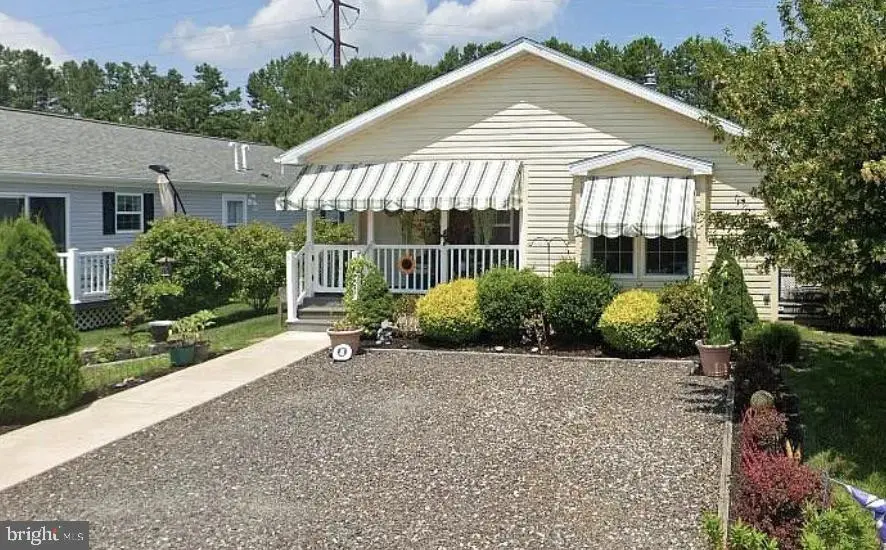
29 Redwood Ln · Weymouth, NJ
Flood risk 7/10 · Major
- FEMA flood zone
- AE
- Chance of flooding over 30 yrs
- 0.98%
- Est. flood insurance / yr
- $1,737 – $8,500
Fire risk 5/10 · Moderate
- Est. fire insurance / yr
- $526 – $976
Heat risk 7/10 · Major
- Hot days now (above 102°F)
- 7 days/yr
- Hot days in 30 yrs
- 15 days/yr
Wind risk 8/10 · Major
- Chance of severe wind over 30 yrs
- 80.0%
Air-quality risk 3/10 · Minor
- Unhealthy air days now
- 1 days/yr
- Unhealthy air days in 30 yrs
- 4 days/yr
Risk factors via First Street. Map © Google.
Why this score? — see what drove the C grade
The composite is a weighted blend of 9 inputs, each scored 0–100. Each bar is that input's sub-score; the figure is the points it added to the 100-point composite (weight × sub-score).
- ARV discount +15.0/15.0
- Appreciation +10.0/10.0
- Cash flow +9.5/30.0
- 1% rule +6.8/10.0
- Schools +4.7/10.0
- DSCR +2.7/10.0
- Rent growth +2.5/5.0
- Livability +2.5/5.0
- Condition / age +2.5/5.0
$219,900
🖨 Deal sheet (PDF) 📄 Offer letter ✓ Due diligence
Listing remarks
Listing Description – Oaks of Weymouth | Mays Landing, NJ Pre-Manufactured 3-bedroom, 2-bath lovely rancher. This home offers front and side porches. Custom crown molding throughout, tacky ceilings, new Pergo flooring, brand new bedroom carpeting, and a brand new washer. Enjoy a totally updated black stainless steel kitchen upgrade complete with an under-sink water filtration system. Custom wood blinds in all windows, new drapes, and upgraded landscaping add to the pride of ownership. All appliances are currently serviced and in working “as-is” condition. Includes shed. Privately situated backing up to wooded pines for added privacy. Land Lease includes water, sewer, trash
Key facts
- Upgraded landscaping
- Custom crown molding
- Custom wood blinds
Tags
Property features AI
Finance
- Other: Property manager present; Accessibility: 36+ inch wide halls; Pets allowed with restrictions (dogs and cats OK; number, size/weight and breed limits)
- Financial info: Ground rent exists (approximately 100 years remaining)
- HOA & community: HOA fee of $685.61 per month; Community amenities include a pool and maintained grounds
Exterior
- Parking: Stone driveway; Driveway parking
- Utilities: Public water; Public sewer; Natural gas available; Natural gas heating, hot water and cooling; Cable TV available
- Home design: Manufactured / modular home; Senior community (55+); Fee simple ownership; Excellent condition; Above-grade living space (finished)
- Construction: Vinyl siding; Shingle roof; Pilings foundation; Double-pane windows; Above-grade other structures
- Exterior features: Gutter system; Lawn sprinkler / underground lawn sprinkler; Sidewalks; Deck(s); Porch(es); Community pool
Interior
- Kitchen: Built-in microwave; Microwave; Oven/Range - gas; Self-cleaning oven; Stove; Dishwasher; Refrigerator; Energy Star refrigerator; Stainless steel appliances; Energy efficient appliances
- Bedrooms: 3 bedrooms on the main level
- Flooring: Carpet; Vinyl
- Bathrooms: 2 full bathrooms on the main level
- Heating & cooling: Forced air heating (natural gas); Central air conditioning (natural gas)
- Interior features: Tub/shower; Ceiling fans; Combination kitchen/dining and kitchen/living areas; Crown molding; Dining area; Eat-in kitchen; Master bath; Recessed lighting; Sprinkler system; Water treatment system; Window treatments; Storm and six-panel doors; Dry wall walls/ceilings
- Laundry & utility: Washer and dryer in unit; Main-floor laundry; Electric dryer; Water heater
Neighborhood map
What this means for you Summary
Snapshot
- This is a 3-bed/2.0-bath single-family listed at $220k.
Deal economics
- At list price, monthly cash flow is $-579 ($-7k/yr) — negative.
- To cash-flow at today's rent, offer at most $136k (38.1% below list).
- Meets the 1% rule at list price ($3k rent vs $220k).
- Recommended offer: $136k (38.1% below list) — sets the bar for cash-flow.
Location & tenants
- Location reads: area grade C — affects rentability + tenant quality, not the cash-flow math above.
- Weymouth Township School District (rural): math 50% / reading 55% proficiency, ranked #351 of 612 in NJ (top 57%) — acceptable for families but not a draw, mixed tenant base, ~2y average lease.
- Zoned schools: Weymouth Township Elementary School (math 27% / reading 47%, grade F, #528 of 1,303 statewide, top 43%, 156 students, 45% FRL).
- Zoned-school proficiency averages 37% at this address vs 52% district-wide (-16 pts) — the specific schools serving this property underperform the Weymouth Township School District average; the district grade overstates school quality for this exact location.
- Market conditions: 244 active listings in the ZIP; 1 comparable units currently listed for rent nearby; solid renter incomes; 672 units permitted in Atlantic County in 2024 (258 in 5+ unit buildings).
- This rent runs 40% of the median local income ($77k/yr) — at the standard rent-burdened threshold; future hikes will face affordability resistance.
Forward outlook
- In year one you build about $24k of equity ($2k loan paydown + $22k appreciation (10.0% local appreciation)).
- Atlantic County population projected at -12% by 2050 — secular population decline; favor cash flow + early exit over multi-decade hold.
- By year 2, paydown + projected appreciation supports a ~$38k cash-out refi (75% LTV) — recoverable capital for the next deal without selling this one.
Negotiation context
- It's been on market 42 days — a 3% lower offer ($213k) is reasonable based on typical stale-listing flexibility.
- 3 sale attempts since 11y ago with the ask held roughly flat each time — persistent listings suggest the price (not the market) is what's stuck; bring a comps-based counter.
Risks & watch-outs
- Watch-outs: flood insurance adds $427/mo; HOA is 26% of rent.
- Climate carrying-cost: in FEMA flood zone AE (mandatory federal flood insurance); severe wind risk, 80% chance of damaging wind over 30y; moderate wildfire risk; extreme-heat days projected 7→15/yr by 2055 (HVAC capex compounding) — expect insurance premiums to compound above CPI over the hold.
Questions for the listing agent
- What do current leases actually rent for vs. the listed asking? Can we see a recent rent roll and the last 12 months of T-12 income?
- It's been on market 42 days. Have you received any prior offers? Is the seller open to a 38% concession, seller financing, or rate buy-down credit?
- What's the actual annual flood-insurance premium (NFIP or private), and is the property in a SFHA with mandatory coverage?
- What does the HOA fee cover, when was the last increase, and are there any pending special assessments or reserve-fund shortfalls?
- Is there a deadline driving the sale (1031 exchange, divorce, estate, relocation)? That informs how much negotiation room exists.
- What's the average days-on-market for RENTAL listings here right now (not sales)? A rising rental-DOM trend means longer vacancies and softer asking-rent achievability than the comps imply.
- What's the recent tenant-quality profile in this submarket — average credit score on applications, eviction rate, late-payment / NSF rate, and stable-employment percentage? A property-management company in the area should have these aggregated.
- How much new for-sale + rental construction is in the pipeline within 1–3 miles? Heavy new supply typically softens prices + rents 12–24 months out; constrained supply supports both.
Investment metrics
- 1% rule
- 1.18% ✓
- Cap rate
- 5.46%
- Cash-on-cash
- -2.97%
- DSCR
- 0.87
- GRM
- 7.1
CMA / ARV
- ARV (median comp)
- $304,879
- List price
- $219,900
- Delta
- -27.87%
- Verdict
- UNDERPRICED
- Comps
- 20 within 1.0 mi
Show comp detail 2 sales within ~0.75 mi
| Address | Dist | Beds/Ba | Sqft | Sold | Price | $/sf | Match |
|---|---|---|---|---|---|---|---|
| 934 Grant St | 0.23mi | 3/1.5 | 1,408 (+4%) | 16mo | $222,920 | $158 | 67 |
| 3 Lafayette Ave | 0.50mi | 2/1.0 (-1) | 1,285 (-5%) | 1mo | $195,000 | $152 | 59 |
Match score weights: distance 35% · size 25% · config 20% · recency 20%. Top-matched comps best support the ARV.
Projected returns pro-forma
10.0% appreciation · 3.0% rent growth · sell at horizon
- IRR
- 16.5%
- Equity multiple
- 2.36×
- Total profit
- $83,618
- Equity at exit
- $198,103
- IRR
- 15.9%
- Equity multiple
- 5.49×
- Total profit
- $276,670
- Equity at exit
- $427,217
Cash invested: $61,572 (down + closing). Projections, not guarantees.
Landlord ↔ Tenant lean methodology
- Overall (STATE)
- 21 Tenant-Leaning
- State New Jersey
- 21 Tenant-Leaning · D+6
- County
- — inherits STATE
- City
- — inherits STATE
ZIP-level market 08330
- Home prices YoY
- 3.9%
- Active inventory
- 244
- Price-to-rent
- 7.1×
Monthly cashflow live
- Estimated rent
- $2,598 medium interval (Pro) →
- Mortgage (P&I)
- −$1,153
- Tax est. 1.5%
- −$275 /mo · $3,298/yr
- Insurance
- −$92
- Flood insurance flood zone
- −$427 /mo · $5,118/yr
- HOA
- −$685
- Vacancy / Maint / Mgmt
- −$546
- Net cashflow
- $-579
Break-even live
Sensitivity live
| Price | -10% $-427 | -5% $-503 | +0% $-579 | +5% $-655 | +10% $-731 |
|---|---|---|---|---|---|
| Rent | -10% $-784 | -5% $-681 | +0% $-579 | +5% $-476 | +10% $-374 |
| Rate | -1.0pp $-468 | -0.5pp $-523 | base $-579 | +0.5pp $-636 | +1.0pp $-694 |
UW: 25.0% down · 7.5% · 30yr · 1.5% tax · 5.0% vac · 8.0% maint · 8.0% mgmt
Financing live
Cash to close
- Down payment
- $54,975
- Closing costs
- $6,597
- Reserves months
- —
- Total cash needed
- —
Loan-product check · same deal, 3 products live
Conventional
25% down · 7.5% · 30yr
- Down + closing
- —
- Monthly P&I
- —
- Monthly cashflow
- —
- DSCR
- —
- Eligible?
- —
Personal DTI + credit; lowest rate.
DSCR
20% down · 8.5% · 30yr
- Down + closing
- —
- Monthly P&I
- —
- Monthly cashflow
- —
- DSCR
- —
- Eligible?
- —
No personal income docs; deal must DSCR.
Hard money
10% down · 12.0% · 12mo
- Down + closing
- —
- Monthly P&I
- —
- Monthly cashflow
- —
- DSCR
- —
- Eligible?
- —
Short-term bridge; refi at stabilization.
Rent comps 1 comps
| Address | Beds | Baths | Sqft | Rent | $/sqft | DOM | Units | Dist |
|---|---|---|---|---|---|---|---|---|
| 6200 Old Harding Hwy Mays Landing, NJ | 1.0–2.0 | 1.0–2.0 | 987 | $2,239 | $2.27 | 0d | 1 | 1.13mi |
HOA detail
- Monthly dues
- $685 · $8,220/yr
- Likely covers
- watersewertrashlandscaping
Listing history 24 events
-
2026-06-22days on market $219,900 Active 42 DOM
-
2026-06-19days on market $219,900 Active 40 DOM
-
2026-06-18days on market $219,900 Active 39 DOM
-
2026-06-17days on market $219,900 Active 38 DOM
-
2026-06-16days on market $219,900 Active 37 DOM
-
2026-06-15days on market $219,900 Active 36 DOM
-
2026-06-14days on market $219,900 Active 34 DOM
-
2026-06-13days on market $219,900 Active 33 DOM
-
2026-06-10days on market $219,900 Active 31 DOM
-
2026-06-09days on market $219,900 Active 30 DOM
-
2026-06-08days on market $219,900 Active 29 DOM
-
2026-06-07days on market $219,900 Active 28 DOM
-
2026-06-05days on market $219,900 Active 25 DOM
-
2026-06-03days on market $219,900 Active 24 DOM
-
2026-06-02days on market $219,900 Active 23 DOM
-
2026-06-01days on market $219,900 Active 22 DOM
-
2026-05-31days on market $219,900 Active 21 DOM
-
2026-05-30days on market $219,900 Active 20 DOM
-
2026-05-10$219,900 Active 2624-char remark
-
2026-05-01historical
-
2026-04-02price $229,900
-
2026-03-02$230,000 Active
-
2016-11-06historical
-
2015-11-16$105,900
ⓘ Source: listings_history table (triggers on properties + properties_extension) + one-shot
backfill from property_details.listing_events for pre-trigger history.
Climate risk First Street
- Flood 7/10 Severe FEMA zone AE · 98% chance over 30 yrs
- Wildfire 5/10 Major
- Heat 7/10 Severe 7 d/yr ≥102°F today · 15 d/yr by 30 yrs out
- Wind 8/10 Severe 80% chance of damaging wind over 30 yrs
- Air quality 3/10 Moderate 1 unhealthy d/yr today · 4 by 30 yrs out
Nearby sold comps map
Loading sold comps map…
Walkable amenities ~0.75 mi
Loading nearby amenities…
Taxation est. · year 1
- Rental income
- $31,175
- − Mortgage interest
- −$12,318
- − Property taxes
- −$3,298
- − Insurance
- −$6,218
- − Repairs & maintenance
- −$2,494
- − Management
- −$2,494
- − HOA
- −$8,220
- − Depreciation
- −$6,397
- Taxable loss
- −$10,264
- Est. tax savings @ 24.0%
- +$2,463
- After-tax cash flow
- $-4,483/yr
For passive investors: Depreciation is non-cash, so a rental often shows a tax loss while cash-flowing — sheltering income. Rental losses are passive: they offset passive income freely, and up to $25,000/yr can offset ordinary (W-2) income if you actively participate and your MAGI is under $100k (phasing out to $0 by $150k); unused losses carry forward. On sale, claimed depreciation is recaptured at up to 25%, and gains may owe capital-gains tax (a 1031 exchange can defer both). Figures are a year-1 estimate at your 24.0% rate — not tax advice; consult a CPA.
Schools (NCES district)
- District
- Weymouth Township School District
- NCES district ID
- 3417850
- Math proficiency
- 50% ▲ 5.00%
- Reading proficiency
- 55% ▲ 10.00%
- Median HH income
- $54,908
- Composite
- 47.23/100
- National rank
- #5081
- State rank
- #351 of 612 in NJ
Livability — Weymouth
No livability data for this city. (Only ~50 U.S. cities are tracked.)
Census & demographics
- County
- Atlantic County · 143,611 people
- Metro
- Atlantic City-Hammonton, NJ
- Population (ZIP)
- 29,972
- Household income
- $77,167
- Rent vs Own
- Severe rent burden
- 1003.0
Population outlook (Atlantic County) Hauer SSP2
- Today (2025)
- 268,948 people
- By 2030
- 264,497 · -1.7%
- By 2040
- 252,261 · -6.2%
- By 2050
- 237,846 · -11.6%
- By 2075
- 210,650 · -21.7%
- By 2100
- 180,234 · -33.0%
Race, ethnicity, and origin ACS 2023
- Neighborhood character
- Diverse neighborhood (Simpson 0.62)
- Race & ethnicity
- White 58% Hispanic / Latino 16% Black 14% Two or more races 13% Asian 4%
- Hispanic origin (detail)
- Puerto Rican 7% Dominican 4%
- Common ancestry
- Romanian 3% Italian 2% Lithuanian 1%
- Foreign-born
- 9% · Canada, Vietnam, Guatemala
- Languages at home
- 84% English-only · Spanish 10% Tagalog/Filipino 1% Other Indo-European 1%
Political lean MEDSL · Atlantic
- 2024 margin
- Toss-up / Even · D 47.7% · R 50.7% · Other 1.6%
- 2008→2024 swing
- -18.1pp toward R · 2008: 15.1pp · 2024: -3.0pp
- All cycles
- 2024: R+3.0 2020: D+6.7 2016: D+6.2 2012: D+17.2 2008: D+15.1
Not yet ingested
- Civics
- —
Market trends
- HPI YoY
- ▲ 11.58%
- Current HPI
- 308.5148
- Rent YoY
- —
- Metro
- Atlantic City-Hammonton, NJ
- State GDP YoY
- ▲ 2.05%
- F500 in state
- 34
Industry mix (Fortune 500 HQ in NJ)
| Industry | F500 HQs | Revenue |
|---|---|---|
| Consumer Goods | 3 | $31B |
|
||
| Pharmaceuticals | 2 | $153B |
|
||
| Technology | 2 | $21B |
|
||
| Insurance | 2 | $20B |
|
||
| Healthcare | 2 | $19B |
|
||
| Financial Services | 1 | $70B |
|
||
Price history
+107.6% since first listed6 events — show timeline
- 2026-05-10 Listed $219,900 BRIGHT MLS
- 2026-05-01 Listing Removed — BRIGHT MLS
- 2026-04-02 Price Changed $229,900 BRIGHT MLS
- 2026-03-02 Listed $230,000 BRIGHT MLS
- 2016-11-06 Listing Removed — BRIGHT MLS
- 2015-11-16 Listed $105,900 BRIGHT MLS
Cash-flow waterfall
monthlySold comps — $/sqft
last 12 mo · ≤1 miLoading sold comps…