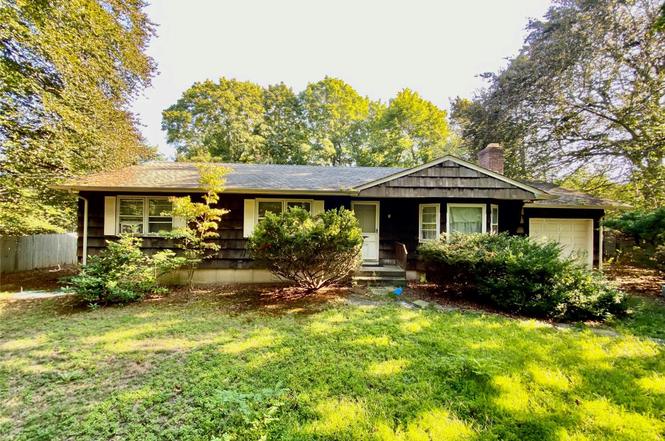
210 Spring Ln · Peconic, NY
Flood risk 1/10 · Minimal
- FEMA flood zone
- X (unshaded)
- Chance of flooding over 30 yrs
- 0.0%
- Est. flood insurance / yr
- $473 – $860
Fire risk 1/10 · Minimal
- Est. fire insurance / yr
- $691 – $1,283
Heat risk 5/10 · Moderate
- Hot days now (above 90°F)
- 7 days/yr
- Hot days in 30 yrs
- 19 days/yr
Wind risk 8/10 · Major
- Chance of severe wind over 30 yrs
- 80.0%
Air-quality risk 3/10 · Minor
- Unhealthy air days now
- 2 days/yr
- Unhealthy air days in 30 yrs
- 3 days/yr
Risk factors via First Street. Map © Google.
Why this score? — see what drove the C- grade
The composite is a weighted blend of 9 inputs, each scored 0–100. Each bar is that input's sub-score; the figure is the points it added to the 100-point composite (weight × sub-score).
- Cash flow +15.0/30.0
- ARV discount +8.3/15.0
- Appreciation +5.7/10.0
- 1% rule +5.0/10.0
- DSCR +5.0/10.0
- Schools +4.8/10.0
- Livability +2.7/5.0
- Rent growth +2.5/5.0
- Condition / age +2.5/5.0
$750,000
🖨 Deal sheet (PDF) 📄 Offer letter ✓ Due diligence
Listing remarks
This ranch home offers 3 bedrooms, 2 full baths, living room with a fireplace, open kitchen floor plan, rear deck, one car garage, and a dry full basement. The property is level and over 1/2 acre (100' X 248') There is water access at the end of Spring Lane and a big, beautiful beach at the end of Indian Neck Lane.
Key facts
- Dry full basement
- Rear deck
- Water access
Tags
Neighborhood map
What this means for you Summary
Snapshot
- This is a 3-bed/2.0-bath single-family listed at $750k.
Deal economics
- At list price, monthly cash flow is $42k ($508k/yr) — positive.
- The deal already cash-flows at list — no discount required.
- Meets the 1% rule at list price ($60k rent vs $750k).
Location & tenants
- Location reads 54/100 on livability (#1,144 in NY) — a working-class tenant base; expect higher turnover. Strengths: crime A+, employment A+; Watch: amenities F, commute F, cost of living F.
- Southold Union Free School District (town): math 46% / reading 59% proficiency, ranked #298 of 590 in NY (top 50%) — acceptable for families but not a draw, mixed tenant base, ~2y average lease; only 17% free/reduced lunch — higher-income household profile.
- Zoned schools: Southold Elementary School (math 37% / reading 62%, grade D, #1,085 of 2,108 statewide, top 56%, 317 students, 35% FRL); Southold Junior-Senior High School (math 52% / reading 52%, grade D+, #946 of 1,100 statewide, top 88%, 380 students, 40% FRL) — zoned schools average 38% FRL vs 17% district-wide (21 pts higher); higher-poverty schools than district average — tighter screening recommended.
- Market conditions: 7 active listings in the ZIP; 2 comparable units currently listed for rent nearby; 1,366 units permitted in Suffolk County in 2024 (216 in 5+ unit buildings).
Forward outlook
- In year one you build about $16k of equity ($5k loan paydown + $11k appreciation (1.5% local appreciation)).
- Suffolk County population projected to shrink 5% by 2050 — rents likely to lag national; underwrite the cash flow, not the appreciation.
- At projected returns (1.5% appreciation + 3.0% rent growth), your $210k cash investment doubles in ~1 year — after that, you're playing with house money.
- By year 3, paydown + projected appreciation supports a ~$42k cash-out refi (75% LTV) — recoverable capital for the next deal without selling this one.
Negotiation context
- Only 7 days on market — expect competitive offers; lowballing is unlikely to land.
Risks & watch-outs
- Climate carrying-cost: severe wind risk, 80% chance of damaging wind over 30y; extreme-heat days projected 7→19/yr by 2055 (HVAC capex compounding) — expect insurance premiums to compound above CPI over the hold.
Questions for the listing agent
- Built in 1976 — when were the roof, HVAC, electrical panel, plumbing, and water heater last replaced?
- Is there a deadline driving the sale (1031 exchange, divorce, estate, relocation)? That informs how much negotiation room exists.
- Schools are F-rated, which usually means shorter tenancies and higher turnover. Who's the typical renter profile here, and what's been the actual vacancy rate?
- What's the average days-on-market for RENTAL listings here right now (not sales)? A rising rental-DOM trend means longer vacancies and softer asking-rent achievability than the comps imply.
- What's the recent tenant-quality profile in this submarket — average credit score on applications, eviction rate, late-payment / NSF rate, and stable-employment percentage? A property-management company in the area should have these aggregated.
- How much new for-sale + rental construction is in the pipeline within 1–3 miles? Heavy new supply typically softens prices + rents 12–24 months out; constrained supply supports both.
Investment metrics
- 1% rule
- 7.99% ✓
- Cap rate
- 74.07%
- Cash-on-cash
- 242.08%
- DSCR
- 11.77
- GRM
- 1.0
CMA / ARV
- ARV (on-the-fly)
- $763,100
- Comps found
- 1
Show comp detail 1 sale within ~0.75 mi
| Address | Dist | Beds/Ba | Sqft | Sold | Price | $/sf | Match |
|---|---|---|---|---|---|---|---|
| 210 Spring Ln | 0.00mi | 3/2.0 | 1,300 (0%) | 0mo | $762,500 | $587 | 100 |
Match score weights: distance 35% · size 25% · config 20% · recency 20%. Top-matched comps best support the ARV.
Projected returns pro-forma
1.5% appreciation · 3.0% rent growth · sell at horizon
- IRR
- —
- Equity multiple
- 14.01×
- Total profit
- $2,731,339
- Equity at exit
- $275,585
- IRR
- —
- Equity multiple
- 29.67×
- Total profit
- $6,019,790
- Equity at exit
- $381,849
Cash invested: $210,000 (down + closing). Projections, not guarantees.
Landlord ↔ Tenant lean methodology
- Overall (STATE)
- 15 Strongly Tenant-Friendly
- State New York
- 15 Strongly Tenant-Friendly · D+10
- County
- — inherits STATE
- City
- — inherits STATE
ZIP-level market 11958
- Home prices YoY
- 0.7%
- Active inventory
- 7
- Price-to-rent
- 1.0×
Monthly cashflow live
- Estimated rent
- $59,905 medium interval (Pro) →
- Mortgage (P&I)
- −$3,933
- Tax from tax record
- −$716 /mo · $8,587/yr
- Insurance
- −$312
- HOA
- −$0
- Vacancy / Maint / Mgmt
- −$12,580
- Net cashflow
- $42,364
Break-even live
Sensitivity live
| Price | -10% $42,788 | -5% $42,576 | +0% $42,364 | +5% $42,152 | +10% $41,939 |
|---|---|---|---|---|---|
| Rent | -10% $37,631 | -5% $39,998 | +0% $42,364 | +5% $44,730 | +10% $47,096 |
| Rate | -1.0pp $42,741 | -0.5pp $42,555 | base $42,364 | +0.5pp $42,169 | +1.0pp $41,972 |
UW: 25.0% down · 7.5% · 30yr · 1.5% tax · 5.0% vac · 8.0% maint · 8.0% mgmt
Financing live
Cash to close
- Down payment
- $187,500
- Closing costs
- $22,500
- Reserves months
- —
- Total cash needed
- —
Loan-product check · same deal, 3 products live
Conventional
25% down · 7.5% · 30yr
- Down + closing
- —
- Monthly P&I
- —
- Monthly cashflow
- —
- DSCR
- —
- Eligible?
- —
Personal DTI + credit; lowest rate.
DSCR
20% down · 8.5% · 30yr
- Down + closing
- —
- Monthly P&I
- —
- Monthly cashflow
- —
- DSCR
- —
- Eligible?
- —
No personal income docs; deal must DSCR.
Hard money
10% down · 12.0% · 12mo
- Down + closing
- —
- Monthly P&I
- —
- Monthly cashflow
- —
- DSCR
- —
- Eligible?
- —
Short-term bridge; refi at stabilization.
Rent comps 2 comps
| Address | Beds | Baths | Sqft | Rent | $/sqft | DOM | Units | Dist |
|---|---|---|---|---|---|---|---|---|
| 3375 Indian Neck Ln Peconic, NY | 4.0 | 4.5 | 1525 | $80,000 | $52.46 | 44d | 1 | 0.37mi |
| 1850 Sterling Rd Cutchogue, NY | 3.0 | 1.0 | 1250 | $3,800 | $3.04 | 44d | 1 | 1.17mi |
Listing history 2 events
-
2026-03-24status Pending
-
2025-09-12$750,000 Active
ⓘ Source: listings_history table (triggers on properties + properties_extension) + one-shot
backfill from property_details.listing_events for pre-trigger history.
Tax reassessment forecast NY · Partial reset (capped growth)
- Current annual tax
- $8,587 · $716/mo
- Projected year-2 tax
- $10,631 · $886/mo
- Expected delta
- +$2,044/yr (+$170/mo · 23.8%)
ⓘ Screening estimate from a state-policy table — verify with the county assessor before closing.
Climate risk First Street
- Flood 1/10 Low FEMA zone X (unshaded) · 0% chance over 30 yrs
- Wildfire 1/10 Low
- Heat 5/10 Major 7 d/yr ≥90°F today · 19 d/yr by 30 yrs out
- Wind 8/10 Severe 80% chance of damaging wind over 30 yrs
- Air quality 3/10 Moderate 2 unhealthy d/yr today · 3 by 30 yrs out
Nearby sold comps map
Loading sold comps map…
Walkable amenities ~0.75 mi
Loading nearby amenities…
Taxation est. · year 1
- Rental income
- $718,860
- − Mortgage interest
- −$42,012
- − Property taxes
- −$8,587
- − Insurance
- −$3,750
- − Repairs & maintenance
- −$57,509
- − Management
- −$57,509
- − Depreciation
- −$21,818
- Taxable income
- $527,676
- Est. tax owed @ 24.0%
- −$126,642
- After-tax cash flow
- $381,723/yr
For passive investors: Depreciation is non-cash, so a rental often shows a tax loss while cash-flowing — sheltering income. Rental losses are passive: they offset passive income freely, and up to $25,000/yr can offset ordinary (W-2) income if you actively participate and your MAGI is under $100k (phasing out to $0 by $150k); unused losses carry forward. On sale, claimed depreciation is recaptured at up to 25%, and gains may owe capital-gains tax (a 1031 exchange can defer both). Figures are a year-1 estimate at your 24.0% rate — not tax advice; consult a CPA.
Schools (NCES district)
- District
- Southold Union Free School District
- NCES district ID
- 3627620
- Math proficiency
- 46% ▼ -10.00%
- Reading proficiency
- 59% ▲ 6.00%
- Median HH income
- $78,622
- Composite
- 47.54/100
- National rank
- #2269
- State rank
- #298 of 590 in NY
Livability — Peconic
- Score
- 54/100
- State rank
- #1144
- US rank
- #23856
Category grades
Schools grade is shown separately in the Schools card above.
Census & demographics
- Census place
- Peconic, NY
- City population
- 864
- Population (ZIP)
- 864
Population outlook (Suffolk County) Hauer SSP2
- Today (2025)
- 1,505,262 people
- By 2030
- 1,498,318 · -0.5%
- By 2040
- 1,471,101 · -2.3%
- By 2050
- 1,424,848 · -5.3%
- By 2075
- 1,337,157 · -11.2%
- By 2100
- 1,217,720 · -19.1%
Race, ethnicity, and origin ACS 2023
- Neighborhood character
- Predominantly White (78%)
- Race & ethnicity
- White 78% Hispanic / Latino 22% Two or more races 10%
- Hispanic origin (detail)
- Common ancestry
- Romanian 28% Iranian 1% Lithuanian 1%
- Foreign-born
- 21% · Canada
- Languages at home
- 80% English-only · Spanish 20%
Political lean MEDSL · Suffolk
- 2024 margin
- Lean R (+10.0) · D 45.0% · R 55.0%
- 2008→2024 swing
- -16.0pp toward R · 2008: 6.0pp · 2024: -10.0pp
- All cycles
- 2024: R+10.0 2020: R+0.0 2016: R+8.2 2012: D+2.9 2008: D+6.0
Not yet ingested
- Civics
- —
Market trends
- HPI YoY
- ▲ 1.50%
- Current HPI
- 219.0019
- Rent YoY
- —
- Metro
- —
- State GDP YoY
- ▲ 2.60%
- F500 in state
- 92
Industry mix (Fortune 500 HQ in NY)
| Industry | F500 HQs | Revenue |
|---|---|---|
| Financial Services | 10 | $950B |
|
||
| Consumer Goods | 9 | $162B |
|
||
| Insurance | 4 | $225B |
|
||
| Telecommunications | 2 | $144B |
|
||
| Pharmaceuticals | 2 | $112B |
|
||
| Media / Entertainment | 2 | $69B |
|
||
Price history
2 events — show timeline
- 2026-03-24 Pending — OneKey® MLS as Distributed by MLS Grid
- 2025-09-12 Listed $750,000 OneKey® MLS as Distributed by MLS Grid
Property tax history
+2.6%/yrLatest (2025): $8,587 · +0.0% YoY. Source: county tax records.
Cash-flow waterfall
monthlySold comps — $/sqft
last 12 mo · ≤1 miLoading sold comps…