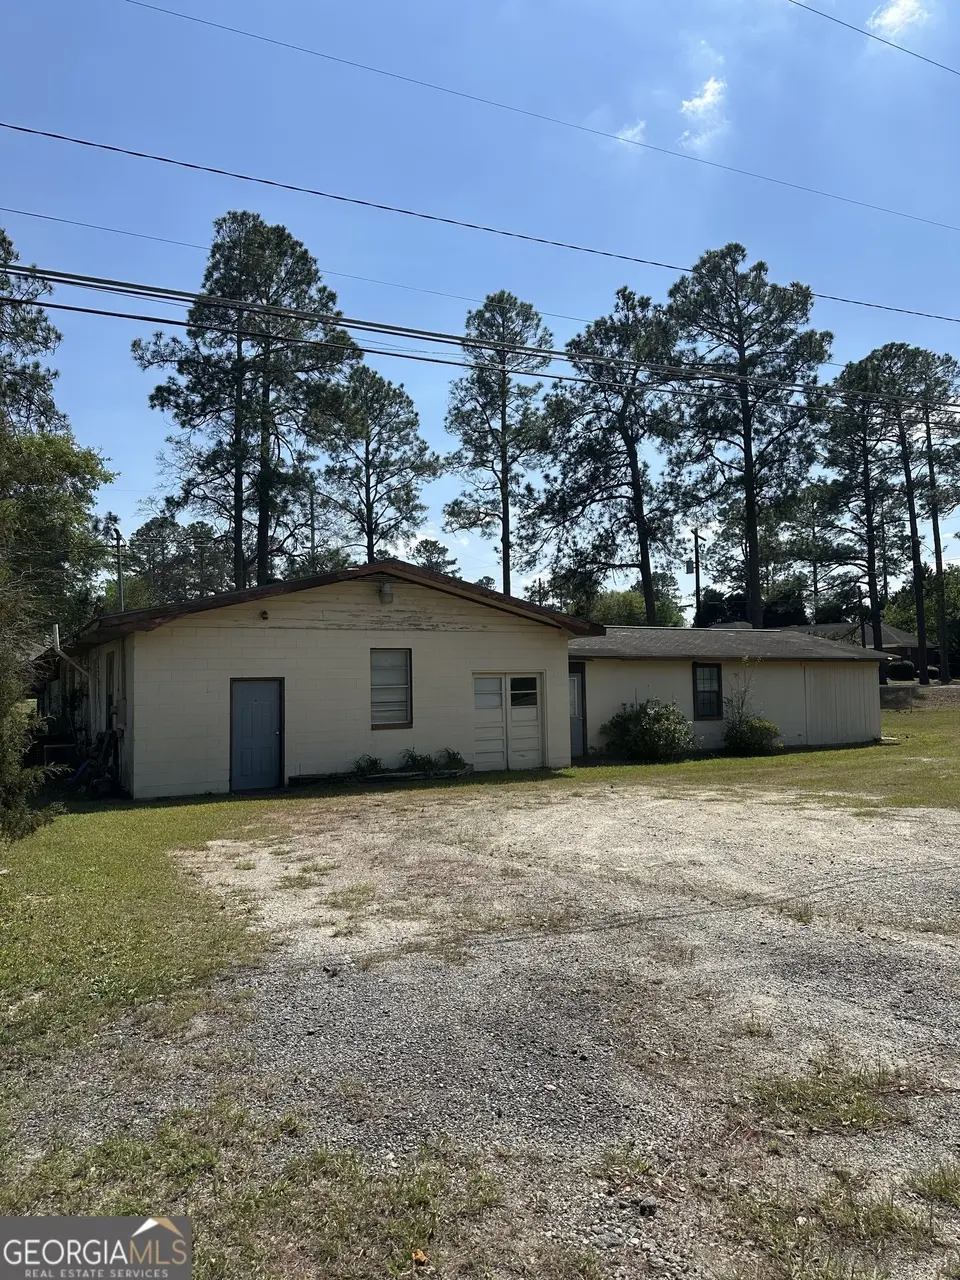
1950 W Elm St · Wrightsville, GA
Flood risk No data
- FEMA flood zone
- —
- Chance of flooding over 30 yrs
- —
- Est. flood insurance / yr
- —
Fire risk No data
- Est. fire insurance / yr
- —
Heat risk No data
- Hot days now (above threshold)
- —
- Hot days in 30 yrs
- —
Wind risk No data
- Chance of severe wind over 30 yrs
- —
Air-quality risk No data
- Unhealthy air days now
- —
- Unhealthy air days in 30 yrs
- —
Risk factors via First Street. Map © Google.
Why this score? — see what drove the C- grade
The composite is a weighted blend of 9 inputs, each scored 0–100. Each bar is that input's sub-score; the figure is the points it added to the 100-point composite (weight × sub-score).
- Cash flow +15.5/30.0
- ARV discount +15.0/15.0
- Appreciation +5.0/10.0
- DSCR +4.8/10.0
- 1% rule +4.3/10.0
- Livability +2.9/5.0
- Schools +2.8/10.0
- Rent growth +2.5/5.0
- Condition / age +1.0/5.0
$140,000
🖨 Deal sheet (PDF) 📄 Offer letter ✓ Due diligence
Listing remarks
Opportunity knocks!! This large space is awaiting its transformation. Sold as-is. Bring your ideas and make it your own!
Key facts
- 8,276 sq ft lot
- Built 1950
- Listed 39 days
Property features AI
Finance
- Other: Corner lot approximately 0.19 acres
- HOA & community: No HOA
Exterior
- Parking: Side/rear entrance parking
- Utilities: Public water; Public sewer; Electricity available on property
- Home design: Residential mixed-use property; One story; Built in 1950; Fixer condition
- Construction: Block construction; Composition roof; Building area 3,630 (public records)
- Exterior features: Corner lot
Interior
- Bedrooms: 5 bedrooms (all on the main level)
- Flooring: Other flooring
- Bathrooms: 5 total bathrooms (4 half, 1 full); 1 bathroom on the main level
- Heating & cooling: Central heating; Central air conditioning
- Interior features: High ceilings; One-level living; No basement; No laundry room (none listed); Other flooring
- Laundry & utility: No laundry features listed
Neighborhood map
What this means for you Summary
Snapshot
- This is a 5-bed/3.0-bath single-family listed at $140k. Condition is rated poor.
Deal economics
- At list price, monthly cash flow is $56 ($670/yr) — positive.
- The deal already cash-flows at list — no discount required.
- To meet the 1% rule (rent ≥ 1% of price), the offer needs to be $130k (7.5% below list).
- Recommended offer: $130k (7.5% below list) — sets the bar for 1% rule.
Location & tenants
- Location reads 58/100 on livability (#419 in GA) — a working-class tenant base; expect higher turnover. Strengths: cost of living A+, housing A, crime B+; Watch: amenities F, commute F, employment F.
- Johnson County (rural): math 34% / reading 33% proficiency, ranked #79 of 174 in GA (top 45%) — families likely to look elsewhere, expect single-tenant / working-renter base with shorter leases; 69% free/reduced lunch — lower-income household profile, screen leases tightly.
- Zoned schools: Johnson County High School (math 5% / reading 24%, grade F, #297 of 424 statewide, top 74%, 303 students, 94% FRL) — zoned schools average 94% FRL vs 69% district-wide (25 pts higher); higher-poverty schools than district average — tighter screening recommended.
- Zoned-school proficiency averages 15% at this address vs 34% district-wide (-19 pts) — the specific schools serving this property underperform the Johnson County average; the district grade overstates school quality for this exact location.
- Market conditions: 17 active listings in the ZIP.
Forward outlook
- In year one you build about $1k of equity ($968 loan paydown + $36 appreciation (0.0% local appreciation)).
- Johnson County population projected at -14% by 2050 — secular population decline; favor cash flow + early exit over multi-decade hold.
Negotiation context
- It's been on market 39 days — a 3% lower offer ($136k) is reasonable based on typical stale-listing flexibility.
Risks & watch-outs
- Watch-outs: built in 1950 — expect roof / HVAC / electrical / plumbing capex.
Questions for the listing agent
- It's been on market 39 days. Have you received any prior offers? Is the seller open to a 7% concession, seller financing, or rate buy-down credit?
- Have any recent inspections been done? Can we get a copy of the seller's disclosures and any deferred-maintenance estimates?
- Built in 1950 — when were the roof, HVAC, electrical panel, plumbing, and water heater last replaced?
- Is there a deadline driving the sale (1031 exchange, divorce, estate, relocation)? That informs how much negotiation room exists.
- Schools are F-rated, which usually means shorter tenancies and higher turnover. Who's the typical renter profile here, and what's been the actual vacancy rate?
- What's the average days-on-market for RENTAL listings here right now (not sales)? A rising rental-DOM trend means longer vacancies and softer asking-rent achievability than the comps imply.
- What's the recent tenant-quality profile in this submarket — average credit score on applications, eviction rate, late-payment / NSF rate, and stable-employment percentage? A property-management company in the area should have these aggregated.
- How much new for-sale + rental construction is in the pipeline within 1–3 miles? Heavy new supply typically softens prices + rents 12–24 months out; constrained supply supports both.
Investment metrics
- 1% rule
- 0.93% ✗
- Cap rate
- 6.77%
- Cash-on-cash
- 1.71%
- DSCR
- 1.08
- GRM
- 9.0
CMA / ARV
- ARV (median comp)
- $270,249
- List price
- $140,000
- Delta
- -48.20%
- Verdict
- UNDERPRICED
- Comps
- 3 within 1.0 mi
Projected returns pro-forma
0.03% appreciation · 3.0% rent growth · sell at horizon
- IRR
- -0.2%
- Equity multiple
- 0.99×
- Total profit
- $-350
- Equity at exit
- $40,832
- IRR
- 5.4%
- Equity multiple
- 1.58×
- Total profit
- $22,913
- Equity at exit
- $49,225
Cash invested: $39,200 (down + closing). Projections, not guarantees.
Landlord ↔ Tenant lean methodology
- Overall (STATE)
- 90 Strongly Landlord-Friendly
- State Georgia
- 90 Strongly Landlord-Friendly · R+3
- County
- — inherits STATE
- City
- — inherits STATE
ZIP-level market 31096
- Home prices YoY
- 0.0%
- Active inventory
- 17
- Price-to-rent
- 9.0×
Monthly cashflow live
- Estimated rent
- $1,295 medium interval (Pro) →
- Mortgage (P&I)
- −$734
- Tax est. 1.5%
- −$175 /mo · $2,100/yr
- Insurance
- −$58
- HOA
- −$0
- Vacancy / Maint / Mgmt
- −$272
- Net cashflow
- $56
Break-even live
Sensitivity live
| Price | -10% $153 | -5% $104 | +0% $56 | +5% $7 | +10% $-41 |
|---|---|---|---|---|---|
| Rent | -10% $-46 | -5% $5 | +0% $56 | +5% $107 | +10% $158 |
| Rate | -1.0pp $126 | -0.5pp $91 | base $56 | +0.5pp $20 | +1.0pp $-17 |
UW: 25.0% down · 7.5% · 30yr · 1.5% tax · 5.0% vac · 8.0% maint · 8.0% mgmt
Financing live
Cash to close
- Down payment
- $35,000
- Closing costs
- $4,200
- Reserves months
- —
- Total cash needed
- —
Loan-product check · same deal, 3 products live
Conventional
25% down · 7.5% · 30yr
- Down + closing
- —
- Monthly P&I
- —
- Monthly cashflow
- —
- DSCR
- —
- Eligible?
- —
Personal DTI + credit; lowest rate.
DSCR
20% down · 8.5% · 30yr
- Down + closing
- —
- Monthly P&I
- —
- Monthly cashflow
- —
- DSCR
- —
- Eligible?
- —
No personal income docs; deal must DSCR.
Hard money
10% down · 12.0% · 12mo
- Down + closing
- —
- Monthly P&I
- —
- Monthly cashflow
- —
- DSCR
- —
- Eligible?
- —
Short-term bridge; refi at stabilization.
Listing history 17 events
-
2026-06-21days on market $140,000 Active 39 DOM
-
2026-06-18days on market $140,000 Active 37 DOM
-
2026-06-17days on market $140,000 Active 36 DOM
-
2026-06-16days on market $140,000 Active 35 DOM
-
2026-06-15days on market $140,000 Active 34 DOM
-
2026-06-13days on market $140,000 Active 32 DOM
-
2026-06-12days on market $140,000 Active 31 DOM
-
2026-06-09days on market $140,000 Active 28 DOM
-
2026-06-08days on market $140,000 Active 27 DOM
-
2026-06-07days on market $140,000 Active 26 DOM
-
2026-06-05days on market $140,000 Active 24 DOM
-
2026-06-04days on market $140,000 Active 22 DOM
-
2026-06-02days on market $140,000 Active 21 DOM
-
2026-06-01days on market $140,000 Active 20 DOM
-
2026-05-31days on market $140,000 Active 19 DOM
-
2026-05-31days on market $140,000 Active 18 DOM
-
2026-05-12$140,000 New 120-char remark
ⓘ Source: listings_history table (triggers on properties + properties_extension) + one-shot
backfill from property_details.listing_events for pre-trigger history.
Nearby sold comps map
Loading sold comps map…
Walkable amenities ~0.75 mi
Loading nearby amenities…
Taxation est. · year 1
- Rental income
- $15,545
- − Mortgage interest
- −$7,842
- − Property taxes
- −$2,100
- − Insurance
- −$700
- − Repairs & maintenance
- −$1,244
- − Management
- −$1,244
- − Depreciation
- −$4,073
- Taxable loss
- −$1,657
- Est. tax savings @ 24.0%
- +$398
- After-tax cash flow
- $1,068/yr
For passive investors: Depreciation is non-cash, so a rental often shows a tax loss while cash-flowing — sheltering income. Rental losses are passive: they offset passive income freely, and up to $25,000/yr can offset ordinary (W-2) income if you actively participate and your MAGI is under $100k (phasing out to $0 by $150k); unused losses carry forward. On sale, claimed depreciation is recaptured at up to 25%, and gains may owe capital-gains tax (a 1031 exchange can defer both). Figures are a year-1 estimate at your 24.0% rate — not tax advice; consult a CPA.
Condition & rehab AI · 13 photos
This property requires extensive repairs and updates to bring it up to a livable condition. Significant work is needed on the roof, exterior siding, interior walls, kitchen, bathrooms, and landscaping. Upgrading these areas will significantly increase its value and make it more attractive to potential buyers and renters.
Repairs flagged
- Major roof — Significant damage visible in aerial view.
- Major exterior siding — Damaged and weathered appearance.
- Major concrete floors — Stained and uneven condition.
- Major paint — Peeling and stained walls.
- Major bathroom fixtures — Old and worn condition.
- Major kitchen appliances — Outdated and in poor condition.
- Major landscaping — Sparse and overgrown appearance.
- Major fencing — In poor condition and falling apart.
Value-add opportunities
- Both New roof and siding — Both will significantly improve the home's appearance and functionality.
- Both Painting and repainting interior walls — Fresh paint will improve the home's appearance and make it more appealing to potential buyers/renters.
- Both Upgrading kitchen appliances — Modern appliances will make the kitchen more functional and attractive.
- Both Landscaping and fencing repair — A well-maintained exterior will enhance the home's curb appeal and make it more attractive to potential buyers/renters.
- Both HVAC and mechanical system replacement — A new HVAC system will improve comfort and energy efficiency, while a new mechanical system will ensure the home's systems are up to date and functioning properly.
- Both Interior updates such as new flooring and cabinetry — These updates will make the interior spaces more functional and attractive, improving the home's overall appeal and value.
- Both New bathroom fixtures and tiling — Upgrading the bathroom will make it more functional and attractive, improving the home's overall appeal and value.
- Both Landscaping and fencing repair — A well-maintained exterior will enhance the home's curb appeal and make it more attractive to potential buyers/renters.
Renovation cost estimate screening
| Repair item | Severity | Est. cost |
|---|---|---|
| roof · Significant damage visible in aerial view. | Major | $15,000–50,000 |
| exterior siding · Damaged and weathered appearance. | Major | $15,000–50,000 |
| concrete floors · Stained and uneven condition. | Major | $15,000–50,000 |
| paint · Peeling and stained walls. | Major | $15,000–50,000 |
| bathroom fixtures · Old and worn condition. | Major | $15,000–50,000 |
| kitchen appliances · Outdated and in poor condition. | Major | $15,000–50,000 |
| landscaping · Sparse and overgrown appearance. | Major | $15,000–50,000 |
| fencing · In poor condition and falling apart. | Major | $15,000–50,000 |
| Total estimated repair cost · 8 items | $120,000–400,000 |
Value-add ROI direction
- Both New roof and siding — Both will significantly improve the home's appearance and functionality. ↑
- Both Painting and repainting interior walls — Fresh paint will improve the home's appearance and make it more appealing to potential buyers/renters. ↑
- Both Upgrading kitchen appliances — Modern appliances will make the kitchen more functional and attractive. ↑
- Both Landscaping and fencing repair — A well-maintained exterior will enhance the home's curb appeal and make it more attractive to potential buyers/renters. ↑
- Both HVAC and mechanical system replacement — A new HVAC system will improve comfort and energy efficiency, while a new mechanical system will ensure the home's systems are up to date and functioning properly. ↑
- Both Interior updates such as new flooring and cabinetry — These updates will make the interior spaces more functional and attractive, improving the home's overall appeal and value. ↑
- Both New bathroom fixtures and tiling — Upgrading the bathroom will make it more functional and attractive, improving the home's overall appeal and value. ↑
- Both Landscaping and fencing repair — A well-maintained exterior will enhance the home's curb appeal and make it more attractive to potential buyers/renters. ↑
ⓘ Cost ranges are severity-bucket heuristics (US national rule-of-thumb). Get contractor quotes + a written scope before underwriting a rehab budget.
Schools (NCES district)
- District
- Johnson County
- NCES district ID
- 1303120
- Math proficiency
- 34% ▼ -7.00%
- Reading proficiency
- 33% ▼ -5.00%
- Median HH income
- $34,082
- Composite
- 27.59/100
- National rank
- #6934
- State rank
- #79 of 174 in GA
Livability — Wrightsville
- Score
- 58/100
- State rank
- #419
- US rank
- #20688
Category grades
Schools grade is shown separately in the Schools card above.
Census & demographics
- Census place
- Wrightsville, GA
- City population
- 7,307
- Population (ZIP)
- 7,307
Population outlook (Johnson County) Hauer SSP2
- Today (2025)
- 9,208 people
- By 2030
- 8,957 · -2.7%
- By 2040
- 8,384 · -8.9%
- By 2050
- 7,889 · -14.3%
- By 2075
- 6,670 · -27.6%
- By 2100
- 5,430 · -41.0%
Race, ethnicity, and origin ACS 2023
- Neighborhood character
- Diverse neighborhood (Simpson 0.55)
- Race & ethnicity
- White 53% Black 40% Two or more races 5% Hispanic / Latino 3%
- Common ancestry
- Lithuanian 1%
- Foreign-born
- 1% · Canada
- Languages at home
- 98% English-only · Spanish 2%
Political lean MEDSL · Johnson
- 2024 margin
- Solid R (+46.4) · D 26.8% · R 73.1%
- 2008→2024 swing
- -12.7pp toward R · 2008: -33.7pp · 2024: -46.4pp
- All cycles
- 2024: R+46.4 2020: R+39.7 2016: R+37.6 2012: R+30.1 2008: R+33.7
Not yet ingested
- Civics
- —
Market trends
- HPI YoY
- ▬ 0.03%
- Current HPI
- 201.8678
- Rent YoY
- —
- Metro
- —
- State GDP YoY
- ▲ 2.66%
- F500 in state
- 28
Industry mix (Fortune 500 HQ in GA)
| Industry | F500 HQs | Revenue |
|---|---|---|
| Paper / Packaging | 2 | $29B |
|
||
| Retail | 1 | $160B |
|
||
| Transportation / Logistics | 1 | $91B |
|
||
| Airlines | 1 | $62B |
|
||
| Consumer Goods | 1 | $47B |
|
||
| Utilities | 1 | $25B |
|
||
Price history
1 event — show timeline
- 2026-05-12 Listed $140,000 GAMLS
Cash-flow waterfall
monthlySold comps — $/sqft
last 12 mo · ≤1 miLoading sold comps…