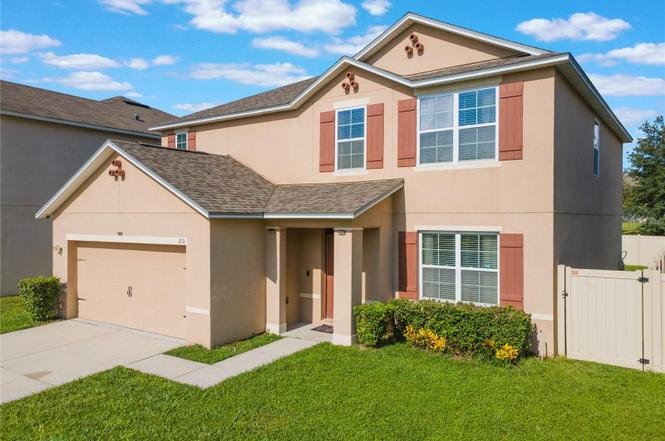
210 Lazy Willow Dr · Four Corners, FL
Flood risk 1/10 · Minimal
- FEMA flood zone
- X (unshaded)
- Chance of flooding over 30 yrs
- 0.0%
- Est. flood insurance / yr
- $507 – $1,088
Fire risk 6/10 · Moderate
- Est. fire insurance / yr
- $947 – $1,759
Heat risk 8/10 · Major
- Hot days now (above 107°F)
- 7 days/yr
- Hot days in 30 yrs
- 24 days/yr
Wind risk 9/10 · Severe
- Chance of severe wind over 30 yrs
- 99.0%
Air-quality risk 1/10 · Minimal
- Unhealthy air days now
- 0 days/yr
- Unhealthy air days in 30 yrs
- 0 days/yr
Risk factors via First Street. Map © Google.
Why this score? — see what drove the D grade
The composite is a weighted blend of 9 inputs, each scored 0–100. Each bar is that input's sub-score; the figure is the points it added to the 100-point composite (weight × sub-score).
- Cash flow +10.8/30.0
- ARV discount +7.5/15.0
- Appreciation +4.7/10.0
- Schools +3.5/10.0
- Livability +3.5/5.0
- DSCR +3.1/10.0
- 1% rule +2.8/10.0
- Condition / age +2.5/5.0
- Rent growth +1.8/5.0
$400,000
🖨 Deal sheet (PDF) 📄 Offer letter ✓ Due diligence
Listing remarks
Welcome to this stunning 5-bedroom, 3.5-bath home nestled on a peaceful cul-de-sac in one of Davenport’s most desirable communities. Situated across from a lush green space with no front neighbors, this home offers both privacy and picturesque views. Step inside to beautiful wood-look tile flooring and an open-concept kitchen that seamlessly flows into the main living area—perfect for entertaining. The master suite is conveniently located on the first floor, offering comfort and convenience, while upstairs you’ll find a spacious bonus room ideal for a playroom, home office, or additional family space. SELLER IS OFFERING $5.000 TOWARDS BUYERS CLOSING COST AND PRE PAIDS OR T
Key facts
- Lush green space
- Open-concept kitchen
- Spacious bonus room
Tags
Property features AI
Finance
- Other: Directions: From Orlando I-4 West Exit 55, turn left onto US 27 N (3.5 miles), left onto Central Grove Rd (0.7 miles), left onto Lazy Willow Dr; house at end of cul-de-sac on left
- Financial info: Total annual fees $960; No lease restrictions indicated
- HOA & community: HOA required (monthly dues $80 / $240 quarterly); Association amenities: clubhouse, playground, pool; Pets allowed
Exterior
- Parking: Attached 2-car garage with garage door opener
- Security: Smoke detectors
- Utilities: Public water; Public sewer; Electricity connected; Cable connected; Sprinkler meter
- Home design: Single-family residence; Two levels; Home faces west; Homestead exempt
- Construction: Stucco exterior; Shingle roof; Slab foundation
- Exterior features: Private mailbox; Sidewalks; Sliding doors; Vinyl fencing; Paved road; Cul-de-sac lot; Private lot
Interior
- Kitchen: Dishwasher; Disposal; Microwave; Range; Refrigerator; Electric water heater
- Bedrooms: 5 bedrooms
- Flooring: Carpet; Tile
- Bathrooms: 3 full bathrooms; 1 half bathroom
- Heating & cooling: Electric heating; Central air conditioning
- Interior features: Ceiling fans; Kitchen open to family room; Thermostat; Walk-in closets; Window treatments (including blinds)
- Laundry & utility: Inside laundry room on upper level
Neighborhood map
What this means for you Summary
Snapshot
- This is a 5-bed/3.0-bath single-family listed at $400k.
Deal economics
- At list price, monthly cash flow is $-185 ($-2k/yr) — negative.
- To cash-flow at today's rent, offer at most $367k (8.2% below list).
- To meet the 1% rule (rent ≥ 1% of price), the offer needs to be $314k (21.5% below list).
- Recommended offer: $314k (21.5% below list) — sets the bar for 1% rule.
- Cap rate 5.7% vs local median 3.2% in Four Corners — top-decile yield for the area; either an underpriced asset or a hidden risk that comps aren't pricing in. Stress-test before assuming the spread holds.
Location & tenants
- Location reads 69/100 on livability (#453 in FL) — a middle-class / working-renter tenant base. Strengths: housing A+, cost of living A-; Watch: amenities F, health & safety F.
- Polk (suburban): math 39% / reading 43% proficiency, ranked #62 of 73 in FL (top 85%) — families likely to look elsewhere, expect single-tenant / working-renter base with shorter leases.
- Zoned schools: Citrus Ridge A Civics Academy (math 35% / reading 37%, grade F, #1,670 of 2,144 statewide, top 78%, 1,457 students, 48% FRL); Lake Alfred Polytech Academy (math 41% / reading 43%, grade D-, #340 of 571 statewide, top 61%, 645 students, 59% FRL); Davenport High School (2,333 students, 37% FRL).
- Market conditions: Rents soft (-2.7%/yr); 648 active listings in the ZIP; 28 comparable units currently listed for rent nearby; rentals at typical pace (median 23d on market — plan ~3-4 weeks tenant-placement turnaround); 10,384 units permitted in Polk County in 2024 (1,716 in 5+ unit buildings).
- At $3,139/mo this rent would consume 53% of the median local household income ($71k/yr) (locally 926% of renters already pay >50% of income on rent) — very limited rent-growth headroom before tenants either downsize or default.
Forward outlook
- In year one you build about $330 of equity ($3k loan paydown + $-2k appreciation (-0.6% local appreciation)).
- Polk County population projected at +33% by 2050 — long-run rental-demand tailwind backs the buy-and-hold thesis.
Negotiation context
- It's been on market 321 days — a 12% lower offer ($352k) is reasonable based on typical stale-listing flexibility.
- 3 sale attempts since 3y ago; this cycle's ask has dropped $50k (11%) from the opening price — seller is motivated, your offer sets the floor, not the list.
Risks & watch-outs
- Climate carrying-cost: severe wind risk, 99% chance of damaging wind over 30y; major wildfire risk; extreme-heat days projected 7→24/yr by 2055 (HVAC capex compounding) — expect insurance premiums to compound above CPI over the hold.
Questions for the listing agent
- What do current leases actually rent for vs. the listed asking? Can we see a recent rent roll and the last 12 months of T-12 income?
- It's been on market 321 days. Have you received any prior offers? Is the seller open to a 22% concession, seller financing, or rate buy-down credit?
- What does the HOA fee cover, when was the last increase, and are there any pending special assessments or reserve-fund shortfalls?
- Why hasn't it sold? Are there any deal-killer items the seller is aware of (foundation, flood, title, zoning, code violations)?
- Is there a deadline driving the sale (1031 exchange, divorce, estate, relocation)? That informs how much negotiation room exists.
- Schools are F-rated, which usually means shorter tenancies and higher turnover. Who's the typical renter profile here, and what's been the actual vacancy rate?
- The area grade is low — what's the realistic commute time and amenity access for the typical tenant pool here? Any planned neighborhood developments (good or bad) we should know about?
- What's the average days-on-market for RENTAL listings here right now (not sales)? A rising rental-DOM trend means longer vacancies and softer asking-rent achievability than the comps imply.
- What's the recent tenant-quality profile in this submarket — average credit score on applications, eviction rate, late-payment / NSF rate, and stable-employment percentage? A property-management company in the area should have these aggregated.
- How much new for-sale + rental construction is in the pipeline within 1–3 miles? Heavy new supply typically softens prices + rents 12–24 months out; constrained supply supports both.
Investment metrics
- 1% rule
- 0.78% ✗
- Cap rate
- 5.74%
- Cash-on-cash
- -1.98%
- DSCR
- 0.91
- GRM
- 10.6
CMA / ARV
No comps found within radius.
Projected returns pro-forma
-0.61% appreciation · 0.0% rent growth · sell at horizon
- IRR
- -9.0%
- Equity multiple
- 0.61×
- Total profit
- $-44,016
- Equity at exit
- $104,113
- IRR
- -4.8%
- Equity multiple
- 0.56×
- Total profit
- $-49,074
- Equity at exit
- $115,908
Cash invested: $112,000 (down + closing). Projections, not guarantees.
Landlord ↔ Tenant lean methodology
- Overall (STATE)
- 87 Strongly Landlord-Friendly
- State Florida
- 87 Strongly Landlord-Friendly · R+3
- County
- — inherits STATE
- City
- — inherits STATE
ZIP-level market 33897
- Home prices YoY
- -0.3%
- Rents YoY
- -2.7%
- Active inventory
- 648
- Price-to-rent
- 10.6×
Monthly cashflow live
- Estimated rent
- $3,139 high interval (Pro) →
- Mortgage (P&I)
- −$2,098
- Tax from tax record
- −$321 /mo · $3,847/yr
- Insurance
- −$167
- HOA
- −$80
- Vacancy / Maint / Mgmt
- −$659
- Net cashflow
- $-185
Break-even live
Sensitivity live
| Price | -10% $41 | -5% $-72 | +0% $-185 | +5% $-298 | +10% $-412 |
|---|---|---|---|---|---|
| Rent | -10% $-433 | -5% $-309 | +0% $-185 | +5% $-61 | +10% $63 |
| Rate | -1.0pp $16 | -0.5pp $-83 | base $-185 | +0.5pp $-289 | +1.0pp $-394 |
UW: 25.0% down · 7.5% · 30yr · 1.5% tax · 5.0% vac · 8.0% maint · 8.0% mgmt
Financing live
Cash to close
- Down payment
- $100,000
- Closing costs
- $12,000
- Reserves months
- —
- Total cash needed
- —
Loan-product check · same deal, 3 products live
Conventional
25% down · 7.5% · 30yr
- Down + closing
- —
- Monthly P&I
- —
- Monthly cashflow
- —
- DSCR
- —
- Eligible?
- —
Personal DTI + credit; lowest rate.
DSCR
20% down · 8.5% · 30yr
- Down + closing
- —
- Monthly P&I
- —
- Monthly cashflow
- —
- DSCR
- —
- Eligible?
- —
No personal income docs; deal must DSCR.
Hard money
10% down · 12.0% · 12mo
- Down + closing
- —
- Monthly P&I
- —
- Monthly cashflow
- —
- DSCR
- —
- Eligible?
- —
Short-term bridge; refi at stabilization.
Rent comps 28 comps
| Address | Beds | Baths | Sqft | Rent | $/sqft | DOM | Units | Dist |
|---|---|---|---|---|---|---|---|---|
| 360 Tupelo Cir Davenport, FL | 6.0 | 4.5 | 2835 | $3,600 | $1.27 | 25d | 1 | 0.32mi |
| 177 Bella Verano Way Davenport, FL | 5.0 | 3.5 | 2768 | $2,900 | $1.05 | 25d | 1 | 0.59mi |
| 3248 Bella Vista Dr Davenport, FL | 4.0 | 2.5 | 2180 | $2,550 | $1.17 | 25d | 1 | 0.72mi |
| 3152 Bella Vista Dr Davenport, FL | 4.0 | 2.5 | 2167 | $2,400 | $1.11 | 25d | 1 | 0.73mi |
| 3079 Bella Vista Dr Davenport, FL | 4.0 | 3.0 | 2627 | $2,550 | $0.97 | 5d | 1 | 0.77mi |
| 3079 Bella Vista Dr Davenport, FL | 4.0 | 2.5 | 2627 | $2,550 | $0.97 | 25d | 1 | 0.77mi |
| 143 Cordova Ave Davenport, FL | 6.0 | 5.5 | 2771 | $3,900 | $1.41 | 16d | 1 | 0.85mi |
| 214 Cordova Ave Davenport, FL | 6.0 | 5.5 | 2771 | $3,250 | $1.17 | 25d | 1 | 0.85mi |
| 134 Sevilla Ave Davenport, FL | 6.0 | 5.5 | 2771 | $3,100 | $1.12 | 25d | 1 | 0.92mi |
| 134 Sevilla Ave Davenport, FL | 6.0 | 5.5 | 2771 | $3,100 | $1.12 | 4d | 1 | 0.92mi |
| 419 Buckingham Cir Davenport, FL | 4.0 | 3.0 | 1940 | $2,990 | $1.54 | 25d | 1 | 0.99mi |
| 5030 Vellacito Way Unit 5030 Davenport, FL | 5.0 | 3.0 | 2396 | $2,495 | $1.04 | 16d | 1 | 1.00mi |
| 5007 Vellacito Way Davenport, FL | 4.0 | 3.0 | 2106 | $2,261 | $1.07 | 5d | 1 | 1.02mi |
| 4828 Vellacito Way Davenport, FL | 5.0 | 3.0 | 2287 | $2,600 | $1.14 | 4d | 1 | 1.02mi |
| 4828 Vellacito Way Davenport, FL | 5.0 | 3.0 | 2351 | $2,600 | $1.11 | 16d | 1 | 1.02mi |
| 548 Old Bridge Cir Davenport, FL | 4.0 | 3.0 | 1944 | $2,600 | $1.34 | 23d | 1 | 1.04mi |
| 1031 Solana Cir Davenport, FL | 6.0 | 5.5 | 2771 | $3,499 | $1.26 | 15d | 1 | 1.05mi |
| 1153 Solana Cir Davenport, FL | 5.0 | 3.0 | 2106 | $3,100 | $1.47 | 25d | 1 | 1.09mi |
| 305 Prestwick Dr Davenport, FL | 5.0 | 3.0 | 2648 | $880 | $0.33 | 25d | 1 | 1.11mi |
| 1162 Solana Cir Davenport, FL | 6.0 | 5.5 | 2771 | $4,100 | $1.48 | 21d | 1 | 1.12mi |
| 458 Moscato Dr Davenport, FL | 4.0 | 3.0 | 2161 | $2,750 | $1.27 | 12d | 1 | 1.13mi |
| 439 Bloomingdale Dr Davenport, FL | 6.0 | 5.0 | 3481 | $3,200 | $0.92 | 25d | 1 | 1.17mi |
| 944 Lockbreeze Dr Davenport, FL | 4.0 | 3.0 | 1929 | $2,650 | $1.37 | 16d | 1 | 1.25mi |
| 633 Ogelthorpe Dr Davenport, FL | 4.0 | 2.5 | 2550 | $2,500 | $0.98 | 5d | 1 | 1.34mi |
| 421 Lockbreeze Dr Davenport, FL | 5.0 | 4.0 | 2396 | $2,700 | $1.13 | 25d | 1 | 1.37mi |
| 969 Leader St Unit 1018221P Kissimmee, FL | 6.0 | 5.0 | 3282 | $4,579 | $1.40 | 15d | 1 | 1.42mi |
| 930 Oxford Dr Unit 1379465P Davenport, FL | 5.0 | 3.0 | 2378 | $6,136 | $2.58 | 23d | 1 | 1.42mi |
| 1236 Challenge Dr Davenport, FL | 5.0 | 4.0 | 2167 | $2,900 | $1.34 | 22d | 1 | 1.50mi |
HOA detail
- Monthly dues
- $80 · $960/yr
Listing history 23 events
-
2026-06-22days on market $400,000 Active 321 DOM
-
2026-06-18days on market $400,000 Active 318 DOM
-
2026-06-17days on market $400,000 Active 317 DOM
-
2026-06-16days on market $400,000 Active 316 DOM
-
2026-06-15days on market $400,000 Active 315 DOM
-
2026-06-13days on market $400,000 Active 313 DOM
-
2026-06-10pricedays on market $400,000 Active 310 DOM
-
2026-06-09days on market $415,000 Active 309 DOM
-
2026-06-08days on market $415,000 Active 308 DOM
-
2026-06-07pricedays on market $415,000 Active 307 DOM
-
2026-06-05days on market $430,000 Active 304 DOM
-
2026-06-03days on market $430,000 Active 302 DOM
-
2026-06-01days on market $430,000 Active 301 DOM
-
2026-05-31days on market $430,000 Active 300 DOM
-
2026-03-16price $430,000
-
2026-01-16price $440,000
-
2025-08-04$450,000 Active
-
2024-06-07status Active
-
2024-04-24price $446,000
-
2024-03-18price $461,000
-
2024-01-23price $468,900
-
2024-01-10price $472,900
-
2023-12-28$474,900 Active
ⓘ Source: listings_history table (triggers on properties + properties_extension) + one-shot
backfill from property_details.listing_events for pre-trigger history.
Tax reassessment forecast FL · Resets to sale price
- Current annual tax
- $3,847 · $321/mo
- Projected year-2 tax
- $3,847 · $321/mo
- Expected delta
- $0/yr ($0/mo · 0.0%)
ⓘ Screening estimate from a state-policy table — verify with the county assessor before closing.
Climate risk First Street
- Flood 1/10 Low FEMA zone X (unshaded) · 0% chance over 30 yrs
- Wildfire 6/10 Major
- Heat 8/10 Severe 7 d/yr ≥107°F today · 24 d/yr by 30 yrs out
- Wind 9/10 Extreme 99% chance of damaging wind over 30 yrs
- Air quality 1/10 Low 0 unhealthy d/yr today · 0 by 30 yrs out
Nearby sold comps map
Loading sold comps map…
Walkable amenities ~0.75 mi
Loading nearby amenities…
Taxation est. · year 1
- Rental income
- $37,667
- − Mortgage interest
- −$22,406
- − Property taxes
- −$3,847
- − Insurance
- −$2,000
- − Repairs & maintenance
- −$3,013
- − Management
- −$3,013
- − HOA
- −$960
- − Depreciation
- −$11,636
- Taxable loss
- −$9,209
- Est. tax savings @ 24.0%
- +$2,210
- After-tax cash flow
- $-11/yr
For passive investors: Depreciation is non-cash, so a rental often shows a tax loss while cash-flowing — sheltering income. Rental losses are passive: they offset passive income freely, and up to $25,000/yr can offset ordinary (W-2) income if you actively participate and your MAGI is under $100k (phasing out to $0 by $150k); unused losses carry forward. On sale, claimed depreciation is recaptured at up to 25%, and gains may owe capital-gains tax (a 1031 exchange can defer both). Figures are a year-1 estimate at your 24.0% rate — not tax advice; consult a CPA.
Schools (NCES district)
- District
- Polk
- NCES district ID
- 1201590
- Math proficiency
- 39% ▼ -11.00%
- Reading proficiency
- 43% ▼ -4.00%
- Median HH income
- $43,979
- Composite
- 34.74/100
- National rank
- #5132
- State rank
- #62 of 73 in FL
Livability — Four Corners
- Score
- 69/100
- State rank
- #453
- US rank
- #8218
Category grades
Schools grade is shown separately in the Schools card above.
Census & demographics
- County
- Polk County · 740,051 people
- City population
- 27,422
- Metro
- Lakeland-Winter Haven, FL
- Population (ZIP)
- 30,159
- Household income
- $70,982
- Rent vs Own
- Severe rent burden
- 926.0
Population outlook (Polk County) Hauer SSP2
- Today (2025)
- 752,975 people
- By 2030
- 804,621 · +6.9%
- By 2040
- 906,117 · +20.3%
- By 2050
- 1,000,476 · +32.9%
- By 2075
- 1,197,520 · +59.0%
- By 2100
- 1,271,518 · +68.9%
Race, ethnicity, and origin ACS 2023
- Neighborhood character
- Diverse neighborhood (Simpson 0.61)
- Race & ethnicity
- White 45% Hispanic / Latino 43% Two or more races 12% Black 5% Asian 2%
- Hispanic origin (detail)
- Mexican 2% Puerto Rican 21% Cuban 2% Dominican 2%
- Common ancestry
- Romanian 2% Lithuanian 2% Serbian 1%
- Foreign-born
- 16% · Canada, Jamaica, China
- Languages at home
- 61% English-only · Spanish 34% Other Indo-European 1% French/Haitian/Cajun 1%
Political lean MEDSL · Polk
- 2024 margin
- Strong R (+20.7) · D 39.2% · R 59.9%
- 2008→2024 swing
- -14.6pp toward R · 2008: -6.1pp · 2024: -20.7pp
- All cycles
- 2024: R+20.7 2020: R+14.4 2016: R+14.1 2012: R+6.8 2008: R+6.1
Not yet ingested
- Civics
- —
Market trends
- HPI YoY
- ▼ -0.61%
- Current HPI
- 236.2905
- Rent YoY
- ▼ -2.69%
- Metro
- Lakeland-Winter Haven, FL
- State GDP YoY
- ▲ 3.28%
- F500 in state
- 36
Industry mix (Fortune 500 HQ in FL)
| Industry | F500 HQs | Revenue |
|---|---|---|
| Industrial Technology | 2 | $29B |
|
||
| Insurance | 2 | $17B |
|
||
| Retail | 1 | $60B |
|
||
| Technology Distribution | 1 | $58B |
|
||
| Homebuilding | 1 | $35B |
|
||
| Technology Manufacturing | 1 | $35B |
|
||
Price history
-9.5% since first listed9 events — show timeline
- 2026-03-16 Price Changed $430,000 Stellar MLS as Distributed by MLS Grid
- 2026-01-16 Price Changed $440,000 Stellar MLS as Distributed by MLS Grid
- 2025-08-04 Listed $450,000 Stellar MLS as Distributed by MLS Grid
- 2024-06-07 Relisted — Stellar MLS as Distributed by MLS Grid
- 2024-04-24 Price Changed $446,000 Stellar MLS as Distributed by MLS Grid
- 2024-03-18 Price Changed $461,000 Stellar MLS as Distributed by MLS Grid
- 2024-01-23 Price Changed $468,900 Stellar MLS as Distributed by MLS Grid
- 2024-01-10 Price Changed $472,900 Stellar MLS as Distributed by MLS Grid
- 2023-12-28 Listed $474,900 Stellar MLS as Distributed by MLS Grid
Property tax history
+42.2%/yrLatest (2025): $3,847 · +5.9% YoY. Source: county tax records.
Cash-flow waterfall
monthlySold comps — $/sqft
last 12 mo · ≤1 miLoading sold comps…