355 Bainbridge St · Barry, IL
Flood risk 1/10 · Minimal
- FEMA flood zone
- X (unshaded)
- Chance of flooding over 30 yrs
- 0.0%
- Est. flood insurance / yr
- $473 – $860
Fire risk 1/10 · Minimal
- Est. fire insurance / yr
- $804 – $1,492
Heat risk 4/10 · Minor
- Hot days now (above 105°F)
- 7 days/yr
- Hot days in 30 yrs
- 18 days/yr
Wind risk 2/10 · Minimal
- Chance of severe wind over 30 yrs
- 1.0%
Air-quality risk 2/10 · Minimal
- Unhealthy air days now
- 1 days/yr
- Unhealthy air days in 30 yrs
- 1 days/yr
Risk factors via First Street. Map © Google.
Why this score? — see what drove the B- grade
The composite is a weighted blend of 9 inputs, each scored 0–100. Each bar is that input's sub-score; the figure is the points it added to the 100-point composite (weight × sub-score).
- Cash flow +29.4/30.0
- DSCR +10.0/10.0
- 1% rule +8.3/10.0
- ARV discount +7.5/15.0
- Livability +3.2/5.0
- Rent growth +2.5/5.0
- Condition / age +2.5/5.0
- Appreciation +2.2/10.0
- Schools +1.9/10.0
$72,000
🖨 Deal sheet (PDF) 📄 Offer letter ✓ Due diligence
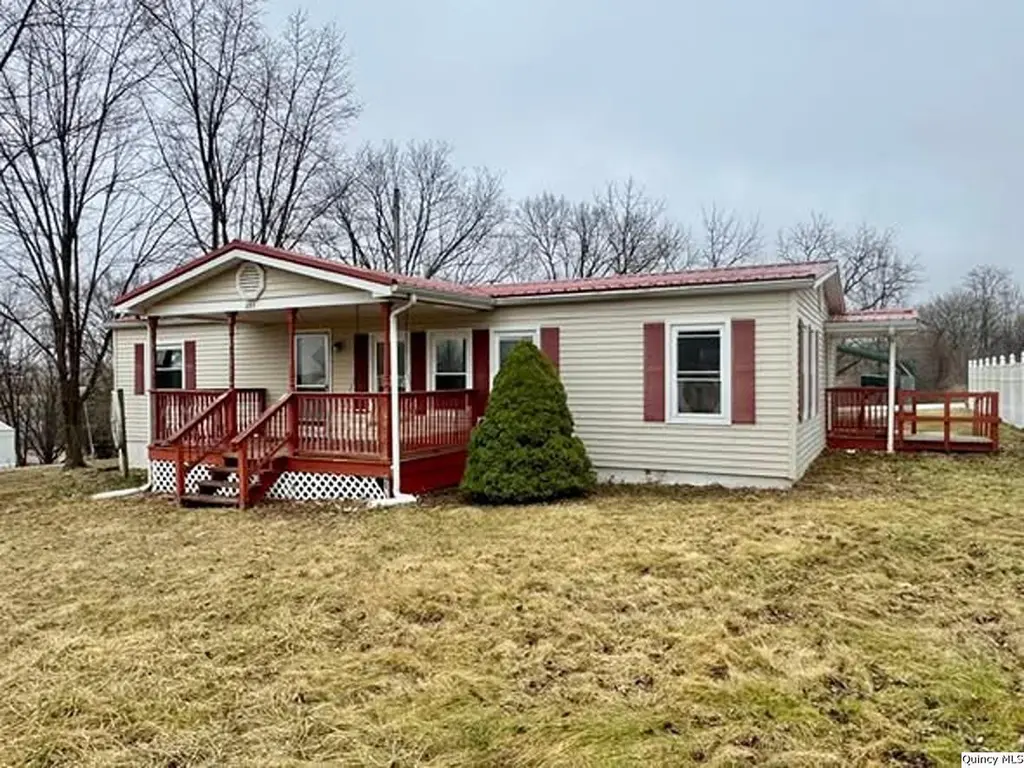
Listing remarks MLS
The home you've been waiting on that provides space, storage, and a bathroom for everyone at price you won't believe! Step inside this 2-bedroom, 2 full bath home that has a massive living room, formal dining room, office, and kitchen that conveys all appliances you see pictured. This home sits on just shy of half an acre of land, has a beautiful covered front porch, 2 exterior storage sheds, and an oversized carport to keep the weather off your vehicle. Too good to be true? Schedule your showing and see for yourself!
Key facts
- Covered front porch
- Massive living room
- Formal dining room
Tags
Neighborhood map
What this means for you Summary
Snapshot
- This is a 2-bed/2.0-bath other listed at $72k.
Deal economics
- At list price, monthly cash flow is $255 ($3k/yr) — positive.
- The deal already cash-flows at list — no discount required.
- Meets the 1% rule at list price ($961 rent vs $72k).
- Recommended offer: $68k (6.0% below list) — sets the bar for market timing.
Location & tenants
- Location reads 63/100 on livability (#808 in IL) — a middle-class / working-renter tenant base. Strengths: cost of living A+, housing A+, crime A; Watch: amenities F, commute F, employment F.
- Western CUSD 12 (rural): math 18% / reading 27% proficiency, ranked #395 of 620 in IL (top 64%) — low school quality limits family demand, transient renter base, plan for 1-2y turnover.
- Zoned schools: Western Barry Elem (math 22% / reading 22%, grade F, #940 of 2,056 statewide, top 49%, 229 students, 0% FRL); Western Jr High School (math 12% / reading 32%, grade F, #389 of 665 statewide, top 60%, 160 students, 0% FRL); Western High School (math 30% / reading 10%, grade F, #357 of 693 statewide, top 54%, 140 students, 0% FRL) — zoned schools average 0% FRL vs 43% district-wide (43 pts lower); this property's tenant base skews higher-income than the district average.
- Market conditions: 6 active listings in the ZIP; 20 units permitted in Pike County in 2024 (0 in 5+ unit buildings).
Forward outlook
- Local home prices are declining (-3.0%/yr); year-one equity from $498 of loan paydown is wiped out by about $2k of value loss. Plan a longer hold.
- Pike County population projected at -19% by 2050 — secular population decline; favor cash flow + early exit over multi-decade hold.
- At projected returns (-3.0% appreciation + 3.0% rent growth), your $20k cash investment doubles in ~8 years — after that, you're playing with house money.
Negotiation context
- It's been on market 89 days — a 6% lower offer ($68k) is reasonable based on typical stale-listing flexibility.
- 3 sale attempts with the ask held roughly flat each time — persistent listings suggest the price (not the market) is what's stuck; bring a comps-based counter.
Questions for the listing agent
- It's been on market 89 days. Have you received any prior offers? Is the seller open to a 6% concession, seller financing, or rate buy-down credit?
- Built in 1973 — when were the roof, HVAC, electrical panel, plumbing, and water heater last replaced?
- Why hasn't it sold? Are there any deal-killer items the seller is aware of (foundation, flood, title, zoning, code violations)?
- Is there a deadline driving the sale (1031 exchange, divorce, estate, relocation)? That informs how much negotiation room exists.
- Schools are D-rated, which usually means shorter tenancies and higher turnover. Who's the typical renter profile here, and what's been the actual vacancy rate?
- What's the average days-on-market for RENTAL listings here right now (not sales)? A rising rental-DOM trend means longer vacancies and softer asking-rent achievability than the comps imply.
- What's the recent tenant-quality profile in this submarket — average credit score on applications, eviction rate, late-payment / NSF rate, and stable-employment percentage? A property-management company in the area should have these aggregated.
- How much new for-sale + rental construction is in the pipeline within 1–3 miles? Heavy new supply typically softens prices + rents 12–24 months out; constrained supply supports both.
Investment metrics
- 1% rule
- 1.33% ✓
- Cap rate
- 10.54%
- Cash-on-cash
- 15.16%
- DSCR
- 1.67
- GRM
- 6.2
CMA / ARV
No comps found within radius.
Projected returns pro-forma
-3.0% appreciation · 3.0% rent growth · sell at horizon
- IRR
- 5.8%
- Equity multiple
- 1.23×
- Total profit
- $4,568
- Equity at exit
- $10,735
- IRR
- 15.2%
- Equity multiple
- 2.24×
- Total profit
- $24,936
- Equity at exit
- $6,225
Cash invested: $20,160 (down + closing). Projections, not guarantees.
Landlord ↔ Tenant lean methodology
- Overall (STATE)
- 43 Moderately Tenant-Leaning
- State Illinois
- 43 Moderately Tenant-Leaning · D+7
- County
- — inherits STATE
- City
- — inherits STATE
ZIP-level market 62312
- Home prices YoY
- -5.0%
- Active inventory
- 6
- Price-to-rent
- 6.2×
Monthly cashflow live
- Estimated rent
- $961 medium interval (Pro) →
- Mortgage (P&I)
- −$378
- Tax from tax record
- −$97 /mo · $1,166/yr
- Insurance
- −$30
- HOA
- −$0
- Vacancy / Maint / Mgmt
- −$202
- Net cashflow
- $255
Break-even live
Sensitivity live
| Price | -10% $295 | -5% $275 | +0% $255 | +5% $234 | +10% $214 |
|---|---|---|---|---|---|
| Rent | -10% $179 | -5% $217 | +0% $255 | +5% $293 | +10% $331 |
| Rate | -1.0pp $291 | -0.5pp $273 | base $255 | +0.5pp $236 | +1.0pp $217 |
UW: 25.0% down · 7.5% · 30yr · 1.5% tax · 5.0% vac · 8.0% maint · 8.0% mgmt
Financing live
Cash to close
- Down payment
- $18,000
- Closing costs
- $2,160
- Reserves months
- —
- Total cash needed
- —
Loan-product check · same deal, 3 products live
Conventional
25% down · 7.5% · 30yr
- Down + closing
- —
- Monthly P&I
- —
- Monthly cashflow
- —
- DSCR
- —
- Eligible?
- —
Personal DTI + credit; lowest rate.
DSCR
20% down · 8.5% · 30yr
- Down + closing
- —
- Monthly P&I
- —
- Monthly cashflow
- —
- DSCR
- —
- Eligible?
- —
No personal income docs; deal must DSCR.
Hard money
10% down · 12.0% · 12mo
- Down + closing
- —
- Monthly P&I
- —
- Monthly cashflow
- —
- DSCR
- —
- Eligible?
- —
Short-term bridge; refi at stabilization.
Listing history 8 events
-
2026-06-02days on market $72,000 Active 89 DOM
-
2026-06-01days on market $72,000 Active 88 DOM
-
2026-05-31days on market $72,000 Active 87 DOM
-
2026-05-31days on market $72,000 Active 86 DOM
-
2026-03-31historical
-
2026-03-05$72,000 Active 523-char remark
Show marketing remark (523 chars)
The home you've been waiting on that provides space, storage, and a bathroom for everyone at price you won't believe! Step inside this 2-bedroom, 2 full bath home that has a massive living room, formal dining room, office, and kitchen that conveys all appliances you see pictured. This home sits on just shy of half an acre of land, has a beautiful covered front porch, 2 exterior storage sheds, and an oversized carport to keep the weather off your vehicle. Too good to be true? Schedule your showing and see for yourself!
-
2026-03-03Active
-
2026-03-03$72,000 Active
ⓘ Source: listings_history table (triggers on properties + properties_extension) + one-shot
backfill from property_details.listing_events for pre-trigger history.
Tax reassessment forecast IL · Partial reset (capped growth)
- Current annual tax
- $1,166 · $97/mo
- Projected year-2 tax
- $1,400 · $117/mo
- Expected delta
- +$234/yr (+$20/mo · 20.1%)
ⓘ Screening estimate from a state-policy table — verify with the county assessor before closing.
Climate risk First Street
- Flood 1/10 Low FEMA zone X (unshaded) · 0% chance over 30 yrs
- Wildfire 1/10 Low
- Heat 4/10 Moderate 7 d/yr ≥105°F today · 18 d/yr by 30 yrs out
- Wind 2/10 Low 100% chance of damaging wind over 30 yrs
- Air quality 2/10 Low 1 unhealthy d/yr today · 1 by 30 yrs out
Nearby sold comps map
Loading sold comps map…
Walkable amenities ~0.75 mi
Loading nearby amenities…
Taxation est. · year 1
- Rental income
- $11,534
- − Mortgage interest
- −$4,033
- − Property taxes
- −$1,166
- − Insurance
- −$360
- − Repairs & maintenance
- −$923
- − Management
- −$923
- − Depreciation
- −$2,095
- Taxable income
- $2,035
- Est. tax owed @ 24.0%
- −$488
- After-tax cash flow
- $2,567/yr
For passive investors: Depreciation is non-cash, so a rental often shows a tax loss while cash-flowing — sheltering income. Rental losses are passive: they offset passive income freely, and up to $25,000/yr can offset ordinary (W-2) income if you actively participate and your MAGI is under $100k (phasing out to $0 by $150k); unused losses carry forward. On sale, claimed depreciation is recaptured at up to 25%, and gains may owe capital-gains tax (a 1031 exchange can defer both). Figures are a year-1 estimate at your 24.0% rate — not tax advice; consult a CPA.
Schools (NCES district)
- District
- Western CUSD 12
- NCES district ID
- 1701387
- Math proficiency
- 18% ▼ -3.00%
- Reading proficiency
- 27% ▼ -4.00%
- Median HH income
- $41,536
- Composite
- 19.14/100
- National rank
- #8826
- State rank
- #395 of 620 in IL
Livability — Barry
- Score
- 63/100
- State rank
- #808
- US rank
- #15977
Category grades
Schools grade is shown separately in the Schools card above.
Census & demographics
- Census place
- Barry, IL
- Population (ZIP)
- 1,878
Population outlook (Pike County) Hauer SSP2
- Today (2025)
- 15,069 people
- By 2030
- 14,505 · -3.7%
- By 2040
- 13,340 · -11.5%
- By 2050
- 12,159 · -19.3%
- By 2075
- 9,227 · -38.8%
- By 2100
- 6,064 · -59.8%
Race, ethnicity, and origin ACS 2023
- Neighborhood character
- Predominantly White (96%)
- Race & ethnicity
- White 96% Hispanic / Latino 2%
- Common ancestry
- Lithuanian 4% Romanian 2% Slovak 2%
- Foreign-born
- 2% · Canada, China
- Languages at home
- 98% English-only · Spanish 1%
Political lean MEDSL · Pike
- 2024 margin
- Solid R (+63.7) · D 17.4% · R 81.1% · Other 1.6%
- 2008→2024 swing
- -44.9pp toward R · 2008: -18.8pp · 2024: -63.7pp
- All cycles
- 2024: R+63.7 2020: R+60.9 2016: R+58.2 2012: R+35.4 2008: R+18.8
Not yet ingested
- Civics
- —
Market trends
- HPI YoY
- ▼ -5.69%
- Current HPI
- 108.54
- Rent YoY
- —
- Metro
- —
- State GDP YoY
- ▲ 1.59%
- F500 in state
- 60
Industry mix (Fortune 500 HQ in IL)
| Industry | F500 HQs | Revenue |
|---|---|---|
| Insurance | 4 | $201B |
|
||
| Consumer Goods | 4 | $87B |
|
||
| Industrial Machinery | 3 | $64B |
|
||
| Healthcare | 2 | $55B |
|
||
| Retail / Pharmacy | 1 | $148B |
|
||
| Agriculture / Food | 1 | $86B |
|
||
Price history
+0.0% since first listed4 events — show timeline
- 2026-03-31 Listing Removed — RMLSA as Distributed by MLS Grid
- 2026-03-05 Listed $72,000 MARIS as Distributed by MLS Grid
- 2026-03-03 Listed $72,000 MRED as Distributed by MLS Grid
- 2026-03-03 Listed — RMLSA as Distributed by MLS Grid
Property tax history
+23.4%/yrLatest (2024): $1,166 · +6.1% YoY. Source: county tax records.
Cash-flow waterfall
monthlySold comps — $/sqft
last 12 mo · ≤1 miLoading sold comps…