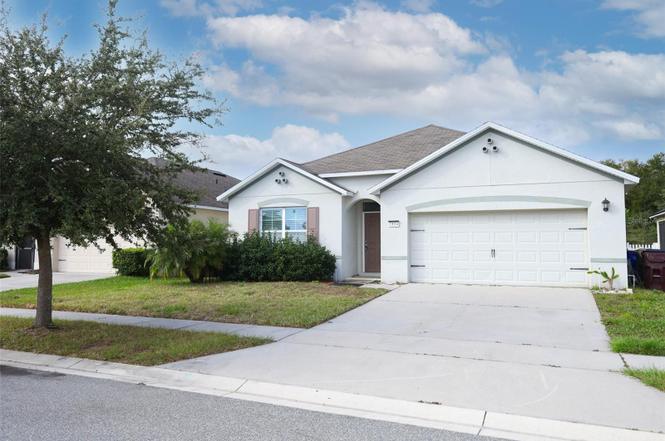
1864 Green Dragon Dr · St. Cloud, FL
Flood risk 1/10 · Minimal
- FEMA flood zone
- X (unshaded)
- Chance of flooding over 30 yrs
- 0.0%
- Est. flood insurance / yr
- $507 – $1,088
Fire risk 5/10 · Moderate
- Est. fire insurance / yr
- $947 – $1,759
Heat risk 9/10 · Severe
- Hot days now (above 108°F)
- 7 days/yr
- Hot days in 30 yrs
- 23 days/yr
Wind risk 9/10 · Severe
- Chance of severe wind over 30 yrs
- 99.0%
Air-quality risk 2/10 · Minimal
- Unhealthy air days now
- 1 days/yr
- Unhealthy air days in 30 yrs
- 1 days/yr
Risk factors via First Street. Map © Google.
Why this score? — see what drove the D+ grade
The composite is a weighted blend of 9 inputs, each scored 0–100. Each bar is that input's sub-score; the figure is the points it added to the 100-point composite (weight × sub-score).
- ARV discount +15.0/15.0
- Cash flow +12.8/30.0
- 1% rule +3.8/10.0
- DSCR +3.8/10.0
- Schools +3.6/10.0
- Rent growth +3.3/5.0
- Livability +2.5/5.0
- Condition / age +2.5/5.0
- Appreciation +0.0/10.0
$300,000
🖨 Deal sheet (PDF) 📄 Offer letter ✓ Due diligence
Listing remarks
Short Sale. Short Sale opportunity in St. Cloud! This 4-bedroom, 2-bath home is located at 1864 Green Dragon Dr, St. Cloud, FL and offers a functional layout with a kitchen, spacious living room, and a backyard perfect for outdoor enjoyment. The split bedroom floor plan provides flexibility for family living, guests, or a home office. Conveniently located near schools, shopping, dining, and major roadways. A great opportunity for buyers looking to add value. Short sale subject to lender approval.
Key facts
- Backyard
- Conveniently located
- Spacious living room
Tags
Neighborhood map
What this means for you Summary
Snapshot
- This is a 4-bed/2.0-bath single-family listed at $300k.
Deal economics
- At list price, monthly cash flow is $-27 ($-323/yr) — negative.
- To cash-flow at today's rent, offer at most $295k (1.6% below list).
- To meet the 1% rule (rent ≥ 1% of price), the offer needs to be $263k (12.4% below list).
- Recommended offer: $263k (12.4% below list) — sets the bar for 1% rule.
- Cap rate 6.2% vs local median 4.0% in St. Cloud — top-decile yield for the area; either an underpriced asset or a hidden risk that comps aren't pricing in. Stress-test before assuming the spread holds.
Location & tenants
- Location reads: area grade D — affects rentability + tenant quality, not the cash-flow math above.
- Osceola (suburban): math 39% / reading 45% proficiency, ranked #60 of 73 in FL (top 82%) — families likely to look elsewhere, expect single-tenant / working-renter base with shorter leases; 60% free/reduced lunch — lower-income household profile, screen leases tightly.
- Zoned schools: Narcoossee Elementary School (math 55% / reading 65%, grade B-, #680 of 2,144 statewide, top 32%, 1,467 students, 38% FRL); Narcoossee Middle School (math 55% / reading 57%, grade B-, #175 of 571 statewide, top 31%, 1,371 students, 46% FRL); Harmony High School (math 40% / reading 46%, grade F, #255 of 667 statewide, top 39%, 2,822 students, 42% FRL) — zoned schools average 42% FRL vs 60% district-wide (18 pts lower); this property's tenant base skews higher-income than the district average.
- Market conditions: Rents rising (+3.0%/yr); 1396 active listings in the ZIP; 27 comparable units currently listed for rent nearby; rentals at typical pace (median 20d on market — plan ~3-4 weeks tenant-placement turnaround); solid renter incomes; 8,813 units permitted in Osceola County in 2024 (3,072 in 5+ unit buildings).
- This rent runs 32% of the median local income ($97k/yr) — at the standard rent-burdened threshold; future hikes will face affordability resistance.
Forward outlook
- Local home prices are declining (-3.0%/yr); year-one equity from $2k of loan paydown is wiped out by about $9k of value loss. Plan a longer hold.
- Osceola County population projected at +73% by 2050 — long-run rental-demand tailwind backs the buy-and-hold thesis.
Negotiation context
- It's been on market 57 days — a 3% lower offer ($291k) is reasonable based on typical stale-listing flexibility.
- 3 sale attempts with the ask held roughly flat each time — persistent listings suggest the price (not the market) is what's stuck; bring a comps-based counter.
Risks & watch-outs
- Climate carrying-cost: severe wind risk, 99% chance of damaging wind over 30y; moderate wildfire risk; extreme-heat days projected 7→23/yr by 2055 (HVAC capex compounding) — expect insurance premiums to compound above CPI over the hold.
Questions for the listing agent
- What do current leases actually rent for vs. the listed asking? Can we see a recent rent roll and the last 12 months of T-12 income?
- It's been on market 57 days. Have you received any prior offers? Is the seller open to a 12% concession, seller financing, or rate buy-down credit?
- What does the HOA fee cover, when was the last increase, and are there any pending special assessments or reserve-fund shortfalls?
- Is there a deadline driving the sale (1031 exchange, divorce, estate, relocation)? That informs how much negotiation room exists.
- The area grade is low — what's the realistic commute time and amenity access for the typical tenant pool here? Any planned neighborhood developments (good or bad) we should know about?
- What's the average days-on-market for RENTAL listings here right now (not sales)? A rising rental-DOM trend means longer vacancies and softer asking-rent achievability than the comps imply.
- What's the recent tenant-quality profile in this submarket — average credit score on applications, eviction rate, late-payment / NSF rate, and stable-employment percentage? A property-management company in the area should have these aggregated.
- How much new for-sale + rental construction is in the pipeline within 1–3 miles? Heavy new supply typically softens prices + rents 12–24 months out; constrained supply supports both.
Investment metrics
- 1% rule
- 0.88% ✗
- Cap rate
- 6.19%
- Cash-on-cash
- -0.38%
- DSCR
- 0.98
- GRM
- 9.5
CMA / ARV
- ARV (on-the-fly)
- $387,660
- Comps found
- 12
Show comp detail 12 sales within ~0.75 mi
| Address | Dist | Beds/Ba | Sqft | Sold | Price | $/sf | Match |
|---|---|---|---|---|---|---|---|
| 5105 Foxtail Fern Way | 0.05mi | 4/2.0 | 1,846 (0%) | 2mo | $360,000 | $195 | 96 |
| 1638 Chatsworth Cir | 0.68mi | 4/2.0 | 1,859 (+1%) | 2mo | $359,999 | $194 | 66 |
| 1725 Reflection Ln | 0.69mi | 3/2.0 (-1) | 1,838 (-0%) | 1mo | $374,000 | $203 | 61 |
| 1647 Cane Bamboo St | 0.70mi | 4/2.0 | 1,903 (+3%) | 4mo | $399,990 | $210 | 59 |
| 5036 Holm Oak Dr | 0.68mi | 4/2.5 | 1,913 (+4%) | 2mo | $392,390 | $205 | 59 |
| 5231 Painted Bamboo St | 0.61mi | 4/2.0 | 1,982 (+7%) | 1mo | $399,990 | $202 | 58 |
| 1653 Cane Bamboo Dr | 0.61mi | 4/2.0 | 1,981 (+7%) | 2mo | $476,000 | $240 | 58 |
| 5249 Painted Bamboo St | 0.63mi | 4/2.0 | 1,982 (+7%) | 2mo | $492,879 | $249 | 56 |
| 4813 Jeanette Ct | 0.57mi | 4/2.0 | 1,654 (-10%) | 1mo | $375,000 | $227 | 55 |
| 5244 Painted Bamboo St | 0.65mi | 4/2.0 | 1,982 (+7%) | 3mo | $480,000 | $242 | 55 |
| 1902 Ashley Oaks Ct | 0.70mi | 3/2.0 (-1) | 1,704 (-8%) | 2mo | $345,000 | $202 | 48 |
| 2317 Tay Wes Dr | 0.61mi | 3/2.0 (-1) | 1,608 (-13%) | 2mo | $360,000 | $224 | 44 |
Match score weights: distance 35% · size 25% · config 20% · recency 20%. Top-matched comps best support the ARV.
Projected returns pro-forma
-3.0% appreciation · 3.02% rent growth · sell at horizon
- IRR
- -16.9%
- Equity multiple
- 0.40×
- Total profit
- $-50,217
- Equity at exit
- $44,731
- IRR
- -8.7%
- Equity multiple
- 0.46×
- Total profit
- $-45,484
- Equity at exit
- $25,939
Cash invested: $84,000 (down + closing). Projections, not guarantees.
Landlord ↔ Tenant lean methodology
- Overall (STATE)
- 87 Strongly Landlord-Friendly
- State Florida
- 87 Strongly Landlord-Friendly · R+3
- County
- — inherits STATE
- City
- — inherits STATE
ZIP-level market 34771
- Home prices YoY
- -30.0%
- Rents YoY
- 3.0%
- Active inventory
- 1396
- Price-to-rent
- 9.5×
Monthly cashflow live
- Estimated rent
- $2,628 high interval (Pro) →
- Mortgage (P&I)
- −$1,573
- Tax from tax record
- −$325 /mo · $3,902/yr
- Insurance
- −$125
- HOA
- −$80
- Vacancy / Maint / Mgmt
- −$552
- Net cashflow
- $-27
Break-even live
Sensitivity live
| Price | -10% $143 | -5% $58 | +0% $-27 | +5% $-112 | +10% $-197 |
|---|---|---|---|---|---|
| Rent | -10% $-235 | -5% $-131 | +0% $-27 | +5% $77 | +10% $181 |
| Rate | -1.0pp $124 | -0.5pp $49 | base $-27 | +0.5pp $-105 | +1.0pp $-184 |
UW: 25.0% down · 7.5% · 30yr · 1.5% tax · 5.0% vac · 8.0% maint · 8.0% mgmt
Financing live
Cash to close
- Down payment
- $75,000
- Closing costs
- $9,000
- Reserves months
- —
- Total cash needed
- —
Loan-product check · same deal, 3 products live
Conventional
25% down · 7.5% · 30yr
- Down + closing
- —
- Monthly P&I
- —
- Monthly cashflow
- —
- DSCR
- —
- Eligible?
- —
Personal DTI + credit; lowest rate.
DSCR
20% down · 8.5% · 30yr
- Down + closing
- —
- Monthly P&I
- —
- Monthly cashflow
- —
- DSCR
- —
- Eligible?
- —
No personal income docs; deal must DSCR.
Hard money
10% down · 12.0% · 12mo
- Down + closing
- —
- Monthly P&I
- —
- Monthly cashflow
- —
- DSCR
- —
- Eligible?
- —
Short-term bridge; refi at stabilization.
Rent comps 27 comps
| Address | Beds | Baths | Sqft | Rent | $/sqft | DOM | Units | Dist |
|---|---|---|---|---|---|---|---|---|
| 1883 Green Dragon Dr Saint Cloud, FL | 4.0 | 2.0 | 1767 | $2,495 | $1.41 | 0d | 1 | 0.08mi |
| 5120 Star Ruby Ave Saint Cloud, FL | 3.0 | 2.0 | 1676 | $2,110 | $1.26 | 9d | 1 | 0.10mi |
| 1842 Castleton Dr Saint Cloud, FL | 4.0 | 2.0 | 1859 | $2,419 | $1.30 | 5d | 1 | 0.59mi |
| 1859 Castleton Dr Saint Cloud, FL | 4.0 | 2.0 | 2064 | $2,490 | $1.21 | 6d | 1 | 0.63mi |
| 2071 Tay Wes Dr Saint Cloud, FL | 5.0 | 3.0 | 2460 | $2,700 | $1.10 | 25d | 1 | 0.63mi |
| 2294 Tay Wes Dr Saint Cloud, FL | 3.0 | 2.5 | 1676 | $2,350 | $1.40 | 22d | 1 | 0.67mi |
| 2099 Tay Wes Dr Saint Cloud, FL | 4.0 | 2.5 | 2203 | $2,600 | $1.18 | 0d | 1 | 0.68mi |
| 5301 Amersham Ln Saint Cloud, FL | 3.0 | 2.5 | 2434 | $3,000 | $1.23 | 25d | 1 | 0.68mi |
| 5314 Amersham Ln Saint Cloud, FL | 4.0 | 3.0 | 2110 | $650 | $0.31 | 4d | 1 | 0.75mi |
| 2255 Tay Wes Dr Saint Cloud, FL | 3.0 | 2.0 | 1501 | $2,500 | $1.67 | 25d | 1 | 0.76mi |
| 2128 Live Oak Lake Rd Saint Cloud, FL | 4.0 | 2.0 | 2146 | $2,200 | $1.03 | 0d | 1 | 0.78mi |
| 2238 Tay Wes Dr Saint Cloud, FL | 3.0 | 2.5 | 1676 | $2,100 | $1.25 | 6d | 1 | 0.80mi |
| 1623 Reflection Cv Saint Cloud, FL | 3.0 | 2.5 | 1695 | $2,000 | $1.18 | 25d | 1 | 0.81mi |
| 2239 Tay Wes Dr Saint Cloud, FL | 3.0 | 2.0 | 1505 | $2,295 | $1.52 | 9d | 1 | 0.82mi |
| 4813 Apple Blossom Ln Saint Cloud, FL | 3.0 | 2.5 | 1695 | $2,100 | $1.24 | 25d | 1 | 0.85mi |
| 5203 Northern Flicker Dr Saint Cloud, FL | 3.0 | 2.0 | 1276 | $2,000 | $1.57 | 25d | 1 | 0.85mi |
| 2173 Tay Wes Dr Saint Cloud, FL | 3.0 | 2.0 | 1501 | $2,300 | $1.53 | 19d | 1 | 0.87mi |
| 5476 Angel Way Saint Cloud, FL | 1.0–3.0 | 1.0–2.0 | 984 | $2,136 | $2.17 | 0d | 34 | 0.89mi |
| 5182 Flycatcher Ct Saint Cloud, FL | 4.0 | 3.0 | 2306 | $2,700 | $1.17 | 25d | 1 | 0.97mi |
| 5192 Chickadee St Saint Cloud, FL | 4.0 | 3.0 | 2204 | $2,490 | $1.13 | 25d | 1 | 0.98mi |
| 2274 Nuthatch St Saint Cloud, FL | 4.0 | 2.0 | 1560 | $2,650 | $1.70 | 25d | 1 | 1.02mi |
| 2286 Nuthatch St Saint Cloud, FL | 4.0 | 3.0 | 2204 | $2,490 | $1.13 | 22d | 1 | 1.04mi |
| 1863 Shumard Ave Unit 1863 St Cloud, FL | 3.0 | 2.0 | 1473 | $2,100 | $1.43 | 5d | 1 | 1.06mi |
| 1884 Overcup Ave Saint Cloud, FL | 3.0 | 2.0 | 1702 | $2,100 | $1.23 | 19d | 1 | 1.14mi |
| 5574 Bakewell Pl Saint Cloud, FL | 4.0 | 2.0 | 1957 | $2,350 | $1.20 | 23d | 1 | 1.21mi |
| 5642 Western Sun Dr Saint Cloud, FL | 3.0 | 2.0 | 1672 | $1,995 | $1.19 | 4d | 1 | 1.46mi |
| 5684 Western Sun Dr Saint Cloud, FL | 3.0 | 2.0 | 1678 | $2,500 | $1.49 | 25d | 1 | 1.47mi |
HOA detail
- Monthly dues
- $80 · $960/yr
Listing history 11 events
-
2026-02-17status Pending
-
2025-12-22$300,000 Active
-
2025-10-21status Pending
-
2025-10-21historical
-
2025-10-19price $310,000
-
2025-10-06status Active
-
2025-09-12status Pending
-
2025-08-07price $350,000
-
2025-08-04price $360,000
-
2025-07-21price $375,000
-
2025-06-25$399,964 Active
ⓘ Source: listings_history table (triggers on properties + properties_extension) + one-shot
backfill from property_details.listing_events for pre-trigger history.
Tax reassessment forecast FL · Resets to sale price
- Current annual tax
- $3,902 · $325/mo
- Projected year-2 tax
- $3,902 · $325/mo
- Expected delta
- $0/yr ($0/mo · 0.0%)
ⓘ Screening estimate from a state-policy table — verify with the county assessor before closing.
Climate risk First Street
- Flood 1/10 Low FEMA zone X (unshaded) · 0% chance over 30 yrs
- Wildfire 5/10 Major
- Heat 9/10 Extreme 7 d/yr ≥108°F today · 23 d/yr by 30 yrs out
- Wind 9/10 Extreme 99% chance of damaging wind over 30 yrs
- Air quality 2/10 Low 1 unhealthy d/yr today · 1 by 30 yrs out
Nearby sold comps map
Loading sold comps map…
Walkable amenities ~0.75 mi
Loading nearby amenities…
Taxation est. · year 1
- Rental income
- $31,541
- − Mortgage interest
- −$16,805
- − Property taxes
- −$3,902
- − Insurance
- −$1,500
- − Repairs & maintenance
- −$2,523
- − Management
- −$2,523
- − HOA
- −$960
- − Depreciation
- −$8,727
- Taxable loss
- −$5,399
- Est. tax savings @ 24.0%
- +$1,296
- After-tax cash flow
- $973/yr
For passive investors: Depreciation is non-cash, so a rental often shows a tax loss while cash-flowing — sheltering income. Rental losses are passive: they offset passive income freely, and up to $25,000/yr can offset ordinary (W-2) income if you actively participate and your MAGI is under $100k (phasing out to $0 by $150k); unused losses carry forward. On sale, claimed depreciation is recaptured at up to 25%, and gains may owe capital-gains tax (a 1031 exchange can defer both). Figures are a year-1 estimate at your 24.0% rate — not tax advice; consult a CPA.
Schools (NCES district)
- District
- Osceola
- NCES district ID
- 1201470
- Math proficiency
- 39% ▼ -9.00%
- Reading proficiency
- 45% ▼ -4.00%
- Median HH income
- $45,528
- Composite
- 35.7/100
- National rank
- #4865
- State rank
- #60 of 73 in FL
Livability — St. Cloud
No livability data for this city. (Only ~50 U.S. cities are tracked.)
Census & demographics
- Census place
- St. Cloud, FL
- County
- Osceola County · 410,217 people
- City population
- 29,247
- Metro
- Orlando-Kissimmee-Sanford, FL
- Population (ZIP)
- 35,257
- Household income
- $97,415
- Rent vs Own
- Severe rent burden
- 338.0
Population outlook (Osceola County) Hauer SSP2
- Today (2025)
- 447,624 people
- By 2030
- 511,823 · +14.3%
- By 2040
- 642,986 · +43.6%
- By 2050
- 774,552 · +73.0%
- By 2075
- 1,078,144 · +140.9%
- By 2100
- 1,269,660 · +183.6%
Race, ethnicity, and origin ACS 2023
- Neighborhood character
- Diverse neighborhood (Simpson 0.62)
- Race & ethnicity
- White 45% Hispanic / Latino 41% Two or more races 20% Black 9% Asian 2%
- Hispanic origin (detail)
- Mexican 3% Puerto Rican 26% Cuban 2% Dominican 4%
- Common ancestry
- Slovak 2% Romanian 2% Lithuanian 1%
- Foreign-born
- 14% · Canada, Jamaica
- Languages at home
- 64% English-only · Spanish 33% Other Indo-European 3%
Political lean MEDSL · Osceola
- 2024 margin
- Toss-up / Even · D 48.7% · R 50.2% · Other 1.1%
- 2008→2024 swing
- -21.2pp toward R · 2008: 19.7pp · 2024: -1.4pp
- All cycles
- 2024: R+1.4 2020: D+13.8 2016: D+25.0 2012: D+24.5 2008: D+19.7
Not yet ingested
- Civics
- —
Market trends
- HPI YoY
- ▼ -124.44%
- Current HPI
- 290.3095
- Rent YoY
- ▲ 3.02%
- Metro
- Orlando-Kissimmee-Sanford, FL
- State GDP YoY
- ▲ 3.28%
- F500 in state
- 36
Industry mix (Fortune 500 HQ in FL)
| Industry | F500 HQs | Revenue |
|---|---|---|
| Industrial Technology | 2 | $29B |
|
||
| Insurance | 2 | $17B |
|
||
| Retail | 1 | $60B |
|
||
| Technology Distribution | 1 | $58B |
|
||
| Homebuilding | 1 | $35B |
|
||
| Technology Manufacturing | 1 | $35B |
|
||
Price history
-25.0% since first listed11 events — show timeline
- 2026-02-17 Pending — Stellar MLS as Distributed by MLS Grid
- 2025-12-22 Listed $300,000 Stellar MLS as Distributed by MLS Grid
- 2025-10-21 Pending — Stellar MLS as Distributed by MLS Grid
- 2025-10-21 Listing Removed — Stellar MLS as Distributed by MLS Grid
- 2025-10-19 Price Changed $310,000 Stellar MLS as Distributed by MLS Grid
- 2025-10-06 Relisted — Stellar MLS as Distributed by MLS Grid
- 2025-09-12 Pending — Stellar MLS as Distributed by MLS Grid
- 2025-08-07 Price Changed $350,000 Stellar MLS as Distributed by MLS Grid
- 2025-08-04 Price Changed $360,000 Stellar MLS as Distributed by MLS Grid
- 2025-07-21 Price Changed $375,000 Stellar MLS as Distributed by MLS Grid
- 2025-06-25 Listed $399,964 Stellar MLS as Distributed by MLS Grid
Property tax history
+49.7%/yrLatest (2025): $3,902 · +3.5% YoY. Source: county tax records.
Cash-flow waterfall
monthlySold comps — $/sqft
last 12 mo · ≤1 miLoading sold comps…