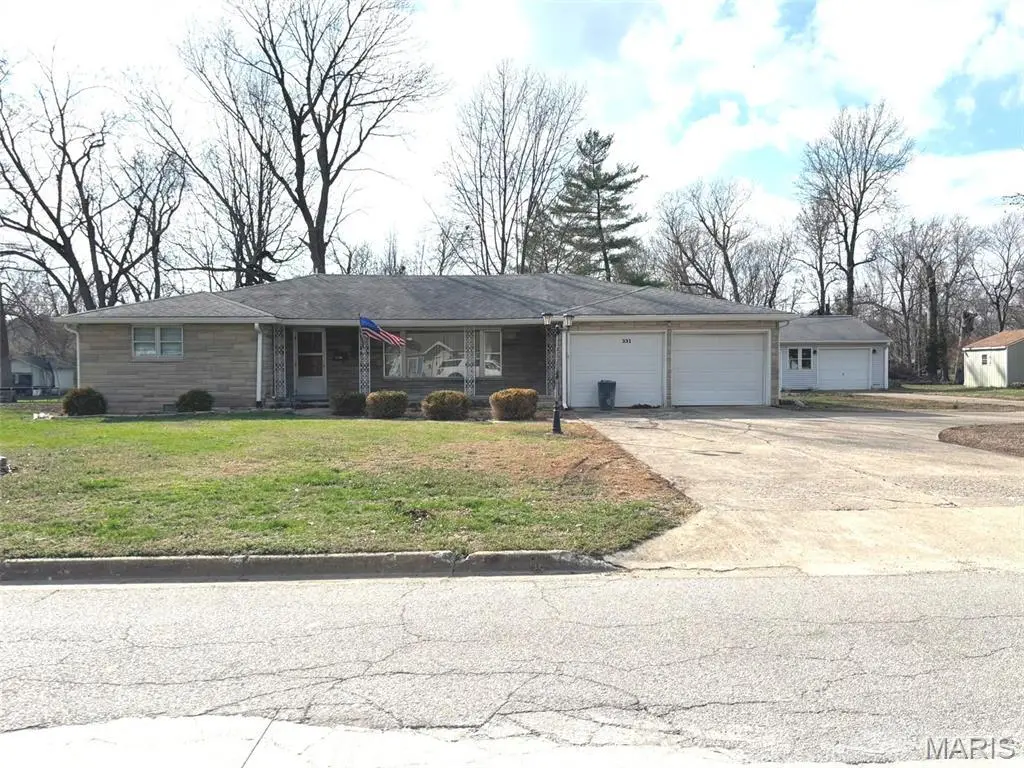
331 Illinois · Salem, IL
Flood risk 1/10 · Minimal
- FEMA flood zone
- X (unshaded)
- Chance of flooding over 30 yrs
- 0.0%
- Est. flood insurance / yr
- $473 – $860
Fire risk 1/10 · Minimal
- Est. fire insurance / yr
- $804 – $1,492
Heat risk 4/10 · Minor
- Hot days now (above 106°F)
- 7 days/yr
- Hot days in 30 yrs
- 20 days/yr
Wind risk 2/10 · Minimal
- Chance of severe wind over 30 yrs
- 2.0%
Air-quality risk 2/10 · Minimal
- Unhealthy air days now
- 1 days/yr
- Unhealthy air days in 30 yrs
- 2 days/yr
Risk factors via First Street. Map © Google.
Why this score? — see what drove the D+ grade
The composite is a weighted blend of 9 inputs, each scored 0–100. Each bar is that input's sub-score; the figure is the points it added to the 100-point composite (weight × sub-score).
- ARV discount +15.0/15.0
- Cash flow +14.1/30.0
- DSCR +4.3/10.0
- 1% rule +3.6/10.0
- Livability +3.4/5.0
- Schools +2.6/10.0
- Rent growth +2.5/5.0
- Condition / age +2.5/5.0
- Appreciation +0.0/10.0
$147,900
🖨 Deal sheet 📄 Offer letter ✓ Due diligence
Listing remarks MLS
This home has that fabulous, unable to be replicated, sweet 1960's solid, heavy, quality build feel. Featuring Bedford stone and a HUGE open living area. Walk-in shower, new kitchen cabinets, 2 car attached garage and large detached garage, concrete drive. Large front porch for people watching, oversize, deep backyard with plenty of room for garden, pool, swing-set, trampoline or all four!
Key facts
- Large front porch
- Open living area
- New kitchen cabinets
Tags
Property features AI
Finance
- Financial info: Special service area not required
- HOA & community: No master association fee required
Exterior
- Parking: Attached and detached garage space; Four garage spaces total; Room for up to 10 vehicles
- Utilities: Public water; Public sewer
- Home design: Detached single-family home; One-story; Fee simple ownership; Built before 1978 (aged 61–70 years)
- Construction: Stone construction
- Exterior features: Lot dimensions approximately 126 x 324
Interior
- Kitchen: Kitchen on the main level (11 x 12) with other-type flooring
- Bedrooms: Master bedroom on the main level (13 x 12) with laminate flooring; Bedroom 2 on the main level (13 x 11) with laminate flooring; Bedroom 3 on the main level (13 x 11) with laminate flooring
- Flooring: Laminate flooring in living areas and bedrooms; Vinyl flooring in laundry
- Bathrooms: 1 full bath; 1 half bath
- Heating & cooling: Forced air heating; Central air conditioning
- Interior features: Six total rooms; Crawl space basement
- Laundry & utility: Main-level laundry (12 x 6) with vinyl flooring
Neighborhood map
What this means for you Summary
Snapshot
- This is a 3-bed/1.5-bath single-family listed at $148k.
Deal economics
- At list price, monthly cash flow is $22 ($258/yr) — positive.
- The deal already cash-flows at list — no discount required.
- To meet the 1% rule (rent ≥ 1% of price), the offer needs to be $127k (14.1% below list).
- Recommended offer: $127k (14.1% below list) — sets the bar for 1% rule.
Location & tenants
- Location reads 68/100 on livability (#467 in IL) — a middle-class / working-renter tenant base. Strengths: cost of living A+, housing A+, health & safety A+; Watch: amenities F, commute F, employment D-.
- Salem Chsd 600 (town): math 25% / reading 30% proficiency, ranked #571 of 919 in IL (top 62%) — low school quality limits family demand, transient renter base, plan for 1-2y turnover.
- Zoned schools: Salem Community High School (math 22% / reading 17%, grade F, #397 of 693 statewide, top 61%, 732 students, 0% FRL).
- Market conditions: 48 active listings in the ZIP; 2 units permitted in Marion County in 2024 (0 in 5+ unit buildings).
Forward outlook
- Local home prices are declining (-3.0%/yr); year-one equity from $1k of loan paydown is wiped out by about $4k of value loss. Plan a longer hold.
- Marion County population projected at -20% by 2050 — secular population decline; favor cash flow + early exit over multi-decade hold.
Negotiation context
- It's been on market 28 days — a 2% lower offer ($146k) is reasonable based on typical stale-listing flexibility.
- 6 sale attempts since 5y ago with the ask held roughly flat each time — persistent listings suggest the price (not the market) is what's stuck; bring a comps-based counter.
Questions for the listing agent
- Built in 1960 — when were the roof, HVAC, electrical panel, plumbing, and water heater last replaced?
- Is there a deadline driving the sale (1031 exchange, divorce, estate, relocation)? That informs how much negotiation room exists.
- Schools are D-rated, which usually means shorter tenancies and higher turnover. Who's the typical renter profile here, and what's been the actual vacancy rate?
- The area grade is low — what's the realistic commute time and amenity access for the typical tenant pool here? Any planned neighborhood developments (good or bad) we should know about?
- What's the average days-on-market for RENTAL listings here right now (not sales)? A rising rental-DOM trend means longer vacancies and softer asking-rent achievability than the comps imply.
- What's the recent tenant-quality profile in this submarket — average credit score on applications, eviction rate, late-payment / NSF rate, and stable-employment percentage? A property-management company in the area should have these aggregated.
- How much new for-sale + rental construction is in the pipeline within 1–3 miles? Heavy new supply typically softens prices + rents 12–24 months out; constrained supply supports both.
Investment metrics
- 1% rule
- 0.86% ✗
- Cap rate
- 6.47%
- Cash-on-cash
- 0.62%
- DSCR
- 1.03
- GRM
- 9.7
CMA / ARV
- ARV (on-the-fly)
- $194,674
- Comps found
- 10
Show comp detail 10 sales within ~0.75 mi
| Address | Dist | Beds/Ba | Sqft | Sold | Price | $/sf | Match |
|---|---|---|---|---|---|---|---|
| 303 N Indiana Ave | 0.10mi | 2/2.0 (-1) | 1,840 (+3%) | 8mo | $170,000 | $92 | 76 |
| 301 S Castle St | 0.41mi | 3/1.0 | 1,603 (-10%) | 6mo | $98,700 | $62 | 56 |
| 307 S Pruyn St | 0.33mi | 3/1.0 | 2,005 (+12%) | 8mo | $140,000 | $70 | 56 |
| 620 W Allmon St | 0.39mi | 3/2.0 | 1,561 (-13%) | 10mo | $170,000 | $109 | 50 |
| 914 Meadow Ln | 0.47mi | 3/2.0 | 1,584 (-11%) | 12mo | $175,000 | $110 | 48 |
| 1110 N Franklin St | 0.59mi | 3/1.5 | 1,521 (-15%) | 2mo | $182,500 | $120 | 46 |
| 506 Willow Pl | 0.40mi | 3/2.0 | 1,546 (-13%) | 21mo | $174,000 | $113 | 40 |
| 1110 Meadow Ln | 0.53mi | 3/1.5 | 1,518 (-15%) | 14mo | $155,000 | $102 | 39 |
| 111 Hawthorn Estates Rd | 0.71mi | 4/2.0 (+1) | 2,010 (+12%) | 3mo | $225,000 | $112 | 37 |
| 1158 N Franklin St | 0.67mi | 4/2.5 (+1) | 2,002 (+12%) | 14mo | $214,000 | $107 | 28 |
Match score weights: distance 35% · size 25% · config 20% · recency 20%. Top-matched comps best support the ARV.
Projected returns pro-forma
-3.0% appreciation · 3.0% rent growth · sell at horizon
- IRR
- -15.3%
- Equity multiple
- 0.45×
- Total profit
- $-22,601
- Equity at exit
- $22,052
- IRR
- -6.8%
- Equity multiple
- 0.57×
- Total profit
- $-17,937
- Equity at exit
- $12,788
Cash invested: $41,412 (down + closing). Projections, not guarantees.
Landlord ↔ Tenant lean methodology
- Overall (STATE)
- 43 Moderately Tenant-Leaning
- State Illinois
- 43 Moderately Tenant-Leaning · D+7
- County
- — inherits STATE
- City
- — inherits STATE
ZIP-level market 62881
- Home prices YoY
- -28.0%
- Active inventory
- 48
- Price-to-rent
- 9.7×
Monthly cashflow live
- Estimated rent
- $1,270 medium interval (Pro) →
- Mortgage (P&I)
- −$776
- Tax from tax record
- −$145 /mo · $1,735/yr
- Insurance
- −$62
- HOA
- −$0
- Vacancy / Maint / Mgmt
- −$267
- Net cashflow
- $22
Break-even live
UW: 25.0% down · 7.5% · 30yr · 1.5% tax · 5.0% vac · 8.0% maint · 8.0% mgmt
Financing live
Cash to close
- Down payment
- $36,975
- Closing costs
- $4,437
- Reserves months
- —
- Total cash needed
- —
Loan-product check · same deal, 3 products live
Conventional
25% down · 7.5% · 30yr
- Down + closing
- —
- Monthly P&I
- —
- Monthly cashflow
- —
- DSCR
- —
- Eligible?
- —
Personal DTI + credit; lowest rate.
DSCR
20% down · 8.5% · 30yr
- Down + closing
- —
- Monthly P&I
- —
- Monthly cashflow
- —
- DSCR
- —
- Eligible?
- —
No personal income docs; deal must DSCR.
Hard money
10% down · 12.0% · 12mo
- Down + closing
- —
- Monthly P&I
- —
- Monthly cashflow
- —
- DSCR
- —
- Eligible?
- —
Short-term bridge; refi at stabilization.
Listing history 28 events
-
2026-06-18days on market $147,900 Active 28 DOM
-
2026-06-17days on market $147,900 Active 27 DOM
-
2026-06-16days on market $147,900 Active 26 DOM
-
2026-06-15days on market $147,900 Active 25 DOM
-
2026-06-13days on market $147,900 Active 23 DOM
-
2026-06-12days on market $147,900 Active 22 DOM
-
2026-06-09days on market $147,900 Active 19 DOM
-
2026-06-09days on market $147,900 Active 18 DOM
-
2026-06-08days on market $147,900 Active 81 DOM
-
2026-06-07days on market $147,900 Active 80 DOM
-
2026-06-07days on market $147,900 Active 79 DOM
-
2026-06-04days on market $147,900 Active 76 DOM
-
2026-06-02days on market $147,900 Active 75 DOM
-
2026-06-01days on market $147,900 Active 74 DOM
-
2026-05-31days on market $147,900 Active 73 DOM
-
2026-05-31days on market $147,900 Active 72 DOM
-
2026-05-21$147,900 Active 392-char remark
Show marketing remark (392 chars)
This home has that fabulous, unable to be replicated, sweet 1960's solid, heavy, quality build feel. Featuring Bedford stone and a HUGE open living area. Walk-in shower, new kitchen cabinets, 2 car attached garage and large detached garage, concrete drive. Large front porch for people watching, oversize, deep backyard with plenty of room for garden, pool, swing-set, trampoline or all four!
-
2026-05-04status Active
-
2026-05-03historical
-
2026-05-02status Active
-
2026-04-30historical
-
2026-04-27price $147,900
-
2026-03-16$157,900 Active
-
2021-06-14soldstatus $155,000
-
2021-06-08soldstatus $155,000 306-char remark
Show marketing remark (306 chars)
A beautiful home on a well desired street! Don't miss out on this well maintained 3 bedroom 1 1/2 bath home with a large living room open to the dining room. New flooring throughout most of home. 2 car attached garage along with a 1 car detached garage with workshop area. All of this on 3/4 +/- acres.
-
2021-05-04$149,000 306-char remark
Show marketing remark (306 chars)
A beautiful home on a well desired street! Don't miss out on this well maintained 3 bedroom 1 1/2 bath home with a large living room open to the dining room. New flooring throughout most of home. 2 car attached garage along with a 1 car detached garage with workshop area. All of this on 3/4 +/- acres.
ⓘ Source: listings_history table (triggers on properties + properties_extension) + one-shot
backfill from property_details.listing_events for pre-trigger history.
Tax reassessment forecast IL · Partial reset (capped growth)
- Current annual tax
- $1,735 · $145/mo
- Projected year-2 tax
- $2,546 · $212/mo
- Expected delta
- +$811/yr (+$68/mo · 46.7%)
ⓘ Screening estimate from a state-policy table — verify with the county assessor before closing.
Climate risk First Street
- Flood 1/10 Low FEMA zone X (unshaded) · 0% chance over 30 yrs
- Wildfire 1/10 Low
- Heat 4/10 Moderate 7 d/yr ≥106°F today · 20 d/yr by 30 yrs out
- Wind 2/10 Low 2% chance of damaging wind over 30 yrs
- Air quality 2/10 Low 1 unhealthy d/yr today · 2 by 30 yrs out
Nearby sold comps map
Loading sold comps map…
Walkable amenities ~0.75 mi
Loading nearby amenities…
Taxation est. · year 1
- Rental income
- $15,241
- − Mortgage interest
- −$8,285
- − Property taxes
- −$1,735
- − Insurance
- −$740
- − Repairs & maintenance
- −$1,219
- − Management
- −$1,219
- − Depreciation
- −$4,303
- Taxable loss
- −$2,260
- Est. tax savings @ 24.0%
- +$542
- After-tax cash flow
- $801/yr
For passive investors: Depreciation is non-cash, so a rental often shows a tax loss while cash-flowing — sheltering income. Rental losses are passive: they offset passive income freely, and up to $25,000/yr can offset ordinary (W-2) income if you actively participate and your MAGI is under $100k (phasing out to $0 by $150k); unused losses carry forward. On sale, claimed depreciation is recaptured at up to 25%, and gains may owe capital-gains tax (a 1031 exchange can defer both). Figures are a year-1 estimate at your 24.0% rate — not tax advice; consult a CPA.
Schools (NCES district)
- District
- Salem Chsd 600
- NCES district ID
- 1735190
- Math proficiency
- 25% ▲ 10.00%
- Reading proficiency
- 30% ▲ 5.00%
- Median HH income
- $39,305
- Composite
- 26.04/100
- National rank
- #12738
- State rank
- #571 of 919 in IL
Livability — Salem
- Score
- 68/100
- State rank
- #467
- US rank
- #9634
Category grades
Schools grade is shown separately in the Schools card above.
Census & demographics
- Census place
- Salem, IL
- City population
- 11,218
- Population (ZIP)
- 11,218
Population outlook (Marion County) Hauer SSP2
- Today (2025)
- 36,071 people
- By 2030
- 34,598 · -4.1%
- By 2040
- 31,754 · -12.0%
- By 2050
- 28,912 · -19.8%
- By 2075
- 22,527 · -37.5%
- By 2100
- 16,455 · -54.4%
Race, ethnicity, and origin ACS 2023
- Neighborhood character
- Predominantly White (93%)
- Race & ethnicity
- White 93% Black 3% Two or more races 2%
- Common ancestry
- Romanian 2% Italian 2% Iranian 2%
- Foreign-born
- 1%
- Languages at home
- 99% English-only · Spanish 1%
Political lean MEDSL · Marion
- 2024 margin
- Solid R (+49.5) · D 24.6% · R 74.1% · Other 1.4%
- 2008→2024 swing
- -47.5pp toward R · 2008: -2.0pp · 2024: -49.5pp
- All cycles
- 2024: R+49.5 2020: R+46.6 2016: R+44.9 2012: R+19.2 2008: R+2.0
Not yet ingested
- Civics
- —
Market trends
- HPI YoY
- ▼ -63.16%
- Current HPI
- 162.55
- Rent YoY
- —
- Metro
- —
- State GDP YoY
- ▲ 1.59%
- F500 in state
- 60
Industry mix (Fortune 500 HQ in IL)
| Industry | F500 HQs | Revenue |
|---|---|---|
| Insurance | 4 | $201B |
|
||
| Consumer Goods | 4 | $87B |
|
||
| Industrial Machinery | 3 | $64B |
|
||
| Healthcare | 2 | $55B |
|
||
| Retail / Pharmacy | 1 | $148B |
|
||
| Agriculture / Food | 1 | $86B |
|
||
Price history
-0.7% since first listed12 events — show timeline
- 2026-05-21 Listed $147,900 MARIS as Distributed by MLS Grid
- 2026-05-04 Relisted — MRED as Distributed by MLS Grid
- 2026-05-03 Listing Removed — MRED as Distributed by MLS Grid
- 2026-05-02 Relisted — MRED as Distributed by MLS Grid
- 2026-04-30 Listing Removed — MRED as Distributed by MLS Grid
- 2026-04-27 Price Changed $147,900 MRED as Distributed by MLS Grid
- 2026-03-16 Listed $157,900 MRED as Distributed by MLS Grid
- 2021-06-14 Sold (Public Records) $155,000 Public Records
- 2021-06-08 Sold (MLS) $155,000 RMLSA as Distributed by MLS Grid
- 2021-06-08 Sold (MLS) $155,000 MRED as Distributed by MLS Grid
- 2021-05-04 Listed $149,000 RMLSA as Distributed by MLS Grid
- 2021-05-04 Listed $149,000 MRED as Distributed by MLS Grid
Property tax history
-0.1%/yrLatest (2024): $1,735 · -6.9% YoY. Source: county tax records.
Cash-flow waterfall
monthlySold comps — $/sqft
last 12 mo · ≤1 miLoading sold comps…