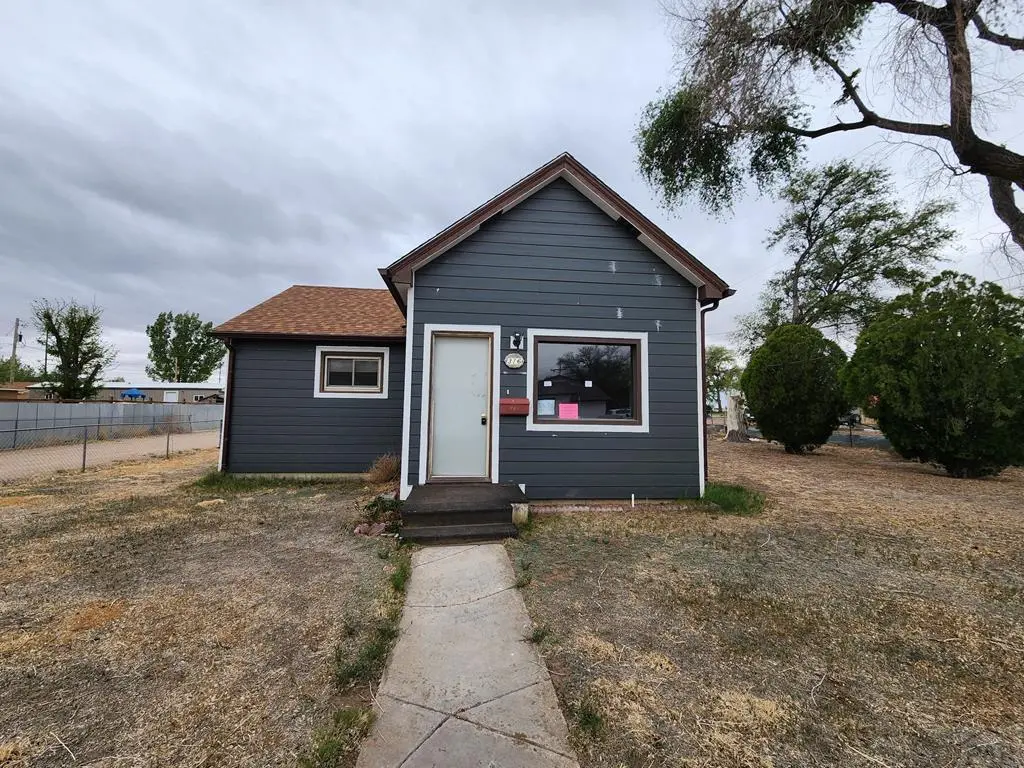
316 E Swink Ave · Fowler, CO
Flood risk 1/10 · Minimal
- FEMA flood zone
- X
- Chance of flooding over 30 yrs
- 0.0%
- Est. flood insurance / yr
- $473 – $860
Fire risk 4/10 · Minor
- Est. fire insurance / yr
- $939 – $1,743
Heat risk 5/10 · Moderate
- Hot days now (above 98°F)
- 7 days/yr
- Hot days in 30 yrs
- 20 days/yr
Wind risk 2/10 · Minimal
- Chance of severe wind over 30 yrs
- —
Air-quality risk 2/10 · Minimal
- Unhealthy air days now
- 0 days/yr
- Unhealthy air days in 30 yrs
- 2 days/yr
Risk factors via First Street. Map © Google.
Why this score? — see what drove the A- grade
The composite is a weighted blend of 9 inputs, each scored 0–100. Each bar is that input's sub-score; the figure is the points it added to the 100-point composite (weight × sub-score).
- Cash flow +27.1/30.0
- ARV discount +15.0/15.0
- Appreciation +10.0/10.0
- DSCR +9.4/10.0
- 1% rule +7.3/10.0
- Livability +3.6/5.0
- Schools +3.2/10.0
- Rent growth +2.5/5.0
- Condition / age +2.5/5.0
$85,000
🖨 Deal sheet 📄 Offer letter ✓ Due diligence
Listing remarks
This Fowler rancher sits on a large lot with plenty of room to spread out, featuring an oversized detached garage and additional outbuildings for storage, hobbies, or workspace needs. The main level offers a comfortable layout with a living room at the front of the home, two bedrooms separated by a 3/4 bath, and a kitchen tucked toward the back with convenient access to the yard. Just off the kitchen is the laundry area, leading down a step into an addon master bedroom suite featuring an attached 3/4 bath. The master bedroom does not include a closet but offers flexible space and privacy from the rest of the home. Small unfinished basement allows for extra storage and the HVAC area. With am
Key facts
- Laundry area
- Large lot
- Attached 3/4 bath
Tags
Property features AI
Finance
- HOA & community: No association amenities
Exterior
- Parking: Detached garage with garage door opener (2 cars)
- Security: Smoke detector(s)
- Utilities: Public water; Public sewer
- Home design: Single-family residential; One-story (main living on one level)
- Construction: Frame construction with wood siding
- Exterior features: Composition roof; Irregular lot; Outbuilding / shed
Interior
- Kitchen: Dishwasher; Refrigerator
- Bedrooms: Three bedrooms on the main level
- Flooring: Carpet; Vinyl
- Bathrooms: Two full bathrooms (both on the main level)
- Heating & cooling: Central air; Ceiling fan(s); Natural gas forced air heating
- Interior features: Ceiling fans; Master bedroom on main level; Double pane windows; Smoke detectors
- Laundry & utility: Laundry on the main level; Unfinished partial basement
Neighborhood map
What this means for you Summary
Snapshot
- This is a 3-bed/2.0-bath single-family listed at $85k.
Deal economics
- At list price, monthly cash flow is $242 ($3k/yr) — positive.
- The deal already cash-flows at list — no discount required.
- Meets the 1% rule at list price ($1k rent vs $85k).
- Recommended offer: $84k (1.5% below list) — sets the bar for market timing.
Location & tenants
- Location reads 72/100 on livability (#66 in CO) — a middle-class / working-renter tenant base. Strengths: cost of living A+, housing A+, crime B; Watch: health & safety C-, schools D+, amenities F.
- Fowler School District No. R4J (rural): math 29% / reading 41% proficiency, ranked #80 of 176 in CO (top 46%) — families likely to look elsewhere, expect single-tenant / working-renter base with shorter leases.
- Market conditions: 20 active listings in the ZIP; 11 units permitted in Otero County in 2024 (0 in 5+ unit buildings).
Forward outlook
- In year one you build about $9k of equity ($588 loan paydown + $8k appreciation (10.0% local appreciation)).
- Otero County population projected at -17% by 2050 — secular population decline; favor cash flow + early exit over multi-decade hold.
- At projected returns (10.0% appreciation + 3.0% rent growth), your $24k cash investment doubles in ~2 years — after that, you're playing with house money.
- By year 4, paydown + projected appreciation supports a ~$32k cash-out refi (75% LTV) — recoverable capital for the next deal without selling this one.
Negotiation context
- It's been on market 24 days — a 2% lower offer ($84k) is reasonable based on typical stale-listing flexibility.
- 4 sale attempts with the ask held roughly flat each time — persistent listings suggest the price (not the market) is what's stuck; bring a comps-based counter.
Risks & watch-outs
- Watch-outs: built in 1942 — expect roof / HVAC / electrical / plumbing capex.
- Climate carrying-cost: extreme-heat days projected 7→20/yr by 2055 (HVAC capex compounding) — expect insurance premiums to compound above CPI over the hold.
Questions for the listing agent
- Built in 1942 — when were the roof, HVAC, electrical panel, plumbing, and water heater last replaced?
- Is there a deadline driving the sale (1031 exchange, divorce, estate, relocation)? That informs how much negotiation room exists.
- Schools are D-rated, which usually means shorter tenancies and higher turnover. Who's the typical renter profile here, and what's been the actual vacancy rate?
- What's the average days-on-market for RENTAL listings here right now (not sales)? A rising rental-DOM trend means longer vacancies and softer asking-rent achievability than the comps imply.
- What's the recent tenant-quality profile in this submarket — average credit score on applications, eviction rate, late-payment / NSF rate, and stable-employment percentage? A property-management company in the area should have these aggregated.
- How much new for-sale + rental construction is in the pipeline within 1–3 miles? Heavy new supply typically softens prices + rents 12–24 months out; constrained supply supports both.
Investment metrics
- 1% rule
- 1.23% ✓
- Cap rate
- 9.70%
- Cash-on-cash
- 12.18%
- DSCR
- 1.54
- GRM
- 6.8
CMA / ARV
- ARV (on-the-fly)
- $144,396
- Comps found
- 12
Show comp detail 12 sales within ~0.75 mi
| Address | Dist | Beds/Ba | Sqft | Sold | Price | $/sf | Match |
|---|---|---|---|---|---|---|---|
| 313 E Grant Ave | 0.15mi | 2/1.0 (-1) | 1,053 (-8%) | 11mo | $180,000 | $171 | 61 |
| 707 7th St | 0.29mi | 2/1.0 (-1) | 1,197 (+4%) | 11mo | $144,000 | $120 | 61 |
| 306 6th St | 0.31mi | 2/1.0 (-1) | 1,217 (+6%) | 9mo | $133,000 | $109 | 59 |
| 412 W Florence Ave | 0.53mi | 3/1.0 | 1,184 (+3%) | 10mo | $124,200 | $105 | 58 |
| 205 W Cranston Ave | 0.50mi | 3/1.0 | 1,268 (+11%) | 1mo | $135,000 | $106 | 54 |
| 410 6th St | 0.25mi | 2/1.0 (-1) | 1,016 (-11%) | 11mo | $77,000 | $76 | 51 |
| 212 W Florence Ave | 0.43mi | 2/1.0 (-1) | 1,186 (+4%) | 18mo | $150,000 | $126 | 50 |
| 607 8th St | 0.38mi | 2/1.0 (-1) | 990 (-14%) | 1mo | $165,000 | $167 | 50 |
| 104 7th St | 0.53mi | 3/1.0 | 1,060 (-8%) | 13mo | $177,000 | $167 | 48 |
| 502 8th St | 0.43mi | 2/1.0 (-1) | 1,012 (-12%) | 9mo | $157,000 | $155 | 44 |
| 504 8th St | 0.43mi | 3/1.0 | 1,268 (+11%) | 22mo | $140,000 | $110 | 40 |
| 412 10th St | 0.53mi | 2/1.0 (-1) | 1,240 (+8%) | 22mo | $156,000 | $126 | 34 |
Match score weights: distance 35% · size 25% · config 20% · recency 20%. Top-matched comps best support the ARV.
Projected returns pro-forma
10.0% appreciation · 3.0% rent growth · sell at horizon
- IRR
- 33.2%
- Equity multiple
- 3.59×
- Total profit
- $61,691
- Equity at exit
- $76,575
- IRR
- 28.7%
- Equity multiple
- 8.13×
- Total profit
- $169,605
- Equity at exit
- $165,136
Cash invested: $23,800 (down + closing). Projections, not guarantees.
Landlord ↔ Tenant lean methodology
- Overall (STATE)
- 38 Tenant-Leaning
- State Colorado
- 38 Tenant-Leaning · D+4
- County
- — inherits STATE
- City
- — inherits STATE
ZIP-level market 81039
- Home prices YoY
- 7.0%
- Active inventory
- 20
- Price-to-rent
- 6.8×
Monthly cashflow live
- Estimated rent
- $1,049 medium interval (Pro) →
- Mortgage (P&I)
- −$446
- Tax est. 1.5%
- −$106 /mo · $1,275/yr
- Insurance
- −$35
- HOA
- −$0
- Vacancy / Maint / Mgmt
- −$220
- Net cashflow
- $242
Break-even live
UW: 25.0% down · 7.5% · 30yr · 1.5% tax · 5.0% vac · 8.0% maint · 8.0% mgmt
Financing live
Cash to close
- Down payment
- $21,250
- Closing costs
- $2,550
- Reserves months
- —
- Total cash needed
- —
Loan-product check · same deal, 3 products live
Conventional
25% down · 7.5% · 30yr
- Down + closing
- —
- Monthly P&I
- —
- Monthly cashflow
- —
- DSCR
- —
- Eligible?
- —
Personal DTI + credit; lowest rate.
DSCR
20% down · 8.5% · 30yr
- Down + closing
- —
- Monthly P&I
- —
- Monthly cashflow
- —
- DSCR
- —
- Eligible?
- —
No personal income docs; deal must DSCR.
Hard money
10% down · 12.0% · 12mo
- Down + closing
- —
- Monthly P&I
- —
- Monthly cashflow
- —
- DSCR
- —
- Eligible?
- —
Short-term bridge; refi at stabilization.
Listing history 12 events
-
2026-06-07status $85,000 Pending 24 DOM
-
2026-06-05days on market $85,000 Active 24 DOM
-
2026-06-04days on market $85,000 Active 22 DOM
-
2026-06-02days on market $85,000 Active 21 DOM
-
2026-06-01days on market $85,000 Active 20 DOM
-
2026-05-31days on market $85,000 Active 19 DOM
-
2026-05-31days on market $85,000 Active 18 DOM
-
2026-05-12$85,000 Active
-
2026-04-30status Active
-
2026-04-07status Active
-
2026-03-14status Pending
-
2026-01-23$90,000 Active
ⓘ Source: listings_history table (triggers on properties + properties_extension) + one-shot
backfill from property_details.listing_events for pre-trigger history.
Climate risk First Street
- Flood 1/10 Low FEMA zone X · 0% chance over 30 yrs
- Wildfire 4/10 Moderate
- Heat 5/10 Major 7 d/yr ≥98°F today · 20 d/yr by 30 yrs out
- Wind 2/10 Low
- Air quality 2/10 Low 0 unhealthy d/yr today · 2 by 30 yrs out
Nearby sold comps map
Loading sold comps map…
Walkable amenities ~0.75 mi
Loading nearby amenities…
Taxation est. · year 1
- Rental income
- $12,591
- − Mortgage interest
- −$4,761
- − Property taxes
- −$1,275
- − Insurance
- −$425
- − Repairs & maintenance
- −$1,007
- − Management
- −$1,007
- − Depreciation
- −$2,473
- Taxable income
- $1,643
- Est. tax owed @ 24.0%
- −$394
- After-tax cash flow
- $2,504/yr
For passive investors: Depreciation is non-cash, so a rental often shows a tax loss while cash-flowing — sheltering income. Rental losses are passive: they offset passive income freely, and up to $25,000/yr can offset ordinary (W-2) income if you actively participate and your MAGI is under $100k (phasing out to $0 by $150k); unused losses carry forward. On sale, claimed depreciation is recaptured at up to 25%, and gains may owe capital-gains tax (a 1031 exchange can defer both). Figures are a year-1 estimate at your 24.0% rate — not tax advice; consult a CPA.
Schools (NCES district)
- District
- Fowler School District No. R4J
- NCES district ID
- 0804110
- Math proficiency
- 29% ▼ -6.00%
- Reading proficiency
- 41% ▲ 5.00%
- Median HH income
- $39,770
- Composite
- 31.98/100
- National rank
- #11024
- State rank
- #80 of 176 in CO
Livability — Fowler
- Score
- 72/100
- State rank
- #66
- US rank
- #6320
Category grades
Schools grade is shown separately in the Schools card above.
Census & demographics
- Census place
- Fowler, CO
- Population (ZIP)
- 1,686
Population outlook (Otero County) Hauer SSP2
- Today (2025)
- 17,363 people
- By 2030
- 16,776 · -3.4%
- By 2040
- 15,534 · -10.5%
- By 2050
- 14,467 · -16.7%
- By 2075
- 12,054 · -30.6%
- By 2100
- 9,392 · -45.9%
Race, ethnicity, and origin ACS 2023
- Neighborhood character
- Predominantly White (81%)
- Race & ethnicity
- White 81% Hispanic / Latino 16% Two or more races 5% Black 1%
- Hispanic origin (detail)
- Mexican 13%
- Common ancestry
- Italian 4% Slovak 3% Lithuanian 3%
- Foreign-born
- 2% · Canada
- Languages at home
- 96% English-only · Spanish 4%
Political lean MEDSL · Otero
- 2024 margin
- Strong R (+26.4) · D 35.5% · R 61.9% · Other 2.7%
- 2008→2024 swing
- -15.9pp toward R · 2008: -10.5pp · 2024: -26.4pp
- All cycles
- 2024: R+26.4 2020: R+22.5 2016: R+25.2 2012: R+9.3 2008: R+10.5
Not yet ingested
- Civics
- —
Market trends
- HPI YoY
- ▲ 17.96%
- Current HPI
- 274.2024
- Rent YoY
- —
- Metro
- —
- State GDP YoY
- ▲ 1.95%
- F500 in state
- 14
Industry mix (Fortune 500 HQ in CO)
| Industry | F500 HQs | Revenue |
|---|---|---|
| Technology Distribution | 1 | $31B |
|
||
| Food / Agriculture | 1 | $18B |
|
||
| Packaging | 1 | $14B |
|
||
| Healthcare | 1 | $13B |
|
||
| Energy | 1 | $10B |
|
||
| Technology | 1 | $4B |
|
||
Price history
-5.6% since first listed5 events — show timeline
- 2026-05-12 Listed $85,000 PARMLS
- 2026-04-30 Relisted — PARMLS
- 2026-04-07 Relisted — PARMLS
- 2026-03-14 Pending — PARMLS
- 2026-01-23 Listed $90,000 PARMLS
Property tax history
-1.2%/yrLatest (2024): $147 · -0.6% YoY. Source: county tax records.
Cash-flow waterfall
monthlySold comps — $/sqft
last 12 mo · ≤1 miLoading sold comps…