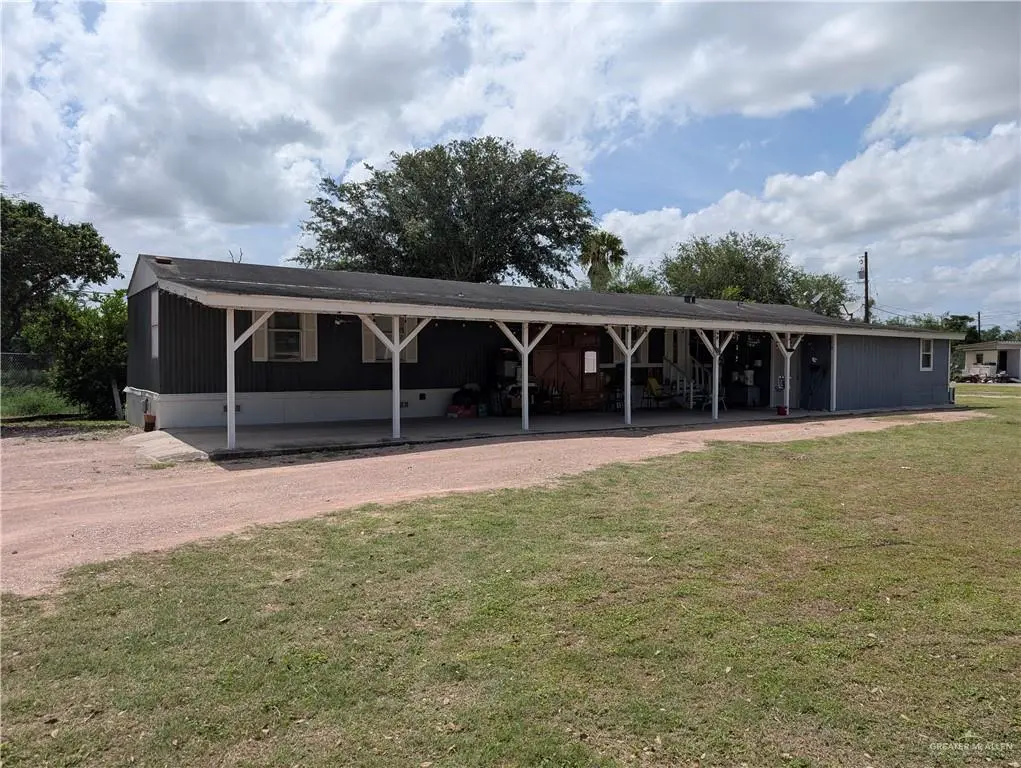
2318 Mi Sueno St · La Homa, TX
Flood risk 7/10 · Major
- FEMA flood zone
- X
- Chance of flooding over 30 yrs
- 0.99%
- Est. flood insurance / yr
- $507 – $1,088
Fire risk 7/10 · Major
- Est. fire insurance / yr
- $1,222 – $2,270
Heat risk 9/10 · Severe
- Hot days now (above 112°F)
- 6 days/yr
- Hot days in 30 yrs
- 19 days/yr
Wind risk 8/10 · Major
- Chance of severe wind over 30 yrs
- 99.0%
Air-quality risk 1/10 · Minimal
- Unhealthy air days now
- 0 days/yr
- Unhealthy air days in 30 yrs
- 0 days/yr
Risk factors via First Street. Map © Google.
Why this score? — see what drove the C grade
The composite is a weighted blend of 9 inputs, each scored 0–100. Each bar is that input's sub-score; the figure is the points it added to the 100-point composite (weight × sub-score).
- Cash flow +25.4/30.0
- DSCR +8.4/10.0
- ARV discount +7.5/15.0
- 1% rule +6.2/10.0
- Livability +2.8/5.0
- Rent growth +2.5/5.0
- Condition / age +2.5/5.0
- Schools +1.9/10.0
- Appreciation +0.0/10.0
$130,000
🖨 Deal sheet (PDF) 📄 Offer letter ✓ Due diligence
Listing remarks MLS
Mobile home sitting on a half cul-de-sac lot in North Mission featuring 3 bedrooms, 2 full bathrooms, plus a bonus room with its own mini-split AC. The property includes a fully fenced yard, a storage shed, and is just a short drive to shopping and dining. Owner financing is available, making this a great opportunity for flexible homeownership in a convenient location.
Key facts
- Cul-de-sac lot
- Mini-split ac
- Bonus room
Tags
Neighborhood map
What this means for you Summary
Snapshot
- This is a 2-bed/2.0-bath manufactured listed at $130k.
Deal economics
- At list price, monthly cash flow is $233 ($3k/yr) — positive.
- The deal already cash-flows at list — no discount required.
- Meets the 1% rule at list price ($1k rent vs $130k).
- Recommended offer: $114k (12.0% below list) — sets the bar for market timing.
- Cap rate 9.1% vs local median 5.6% in La Homa — top-decile yield for the area; either an underpriced asset or a hidden risk that comps aren't pricing in. Stress-test before assuming the spread holds.
Location & tenants
- Location reads 56/100 on livability (#1,308 in TX) — a working-class tenant base; expect higher turnover. Strengths: cost of living A+, housing A-; Watch: crime F, amenities F, commute F.
- La Joya ISD (suburban): math 18% / reading 29% proficiency, ranked #759 of 826 in TX (top 92%) — low school quality limits family demand, transient renter base, plan for 1-2y turnover.
- Zoned schools: Emiliano Zapata El (math 17% / reading 27%, grade F, #3,333 of 4,322 statewide, top 80%, 543 students, 98% FRL); Juarez-Lincoln H S (math 10% / reading 20%, grade F, #1,507 of 1,632 statewide, top 93%, 2,062 students, 99% FRL) — zoned schools average 98% FRL vs 54% district-wide (45 pts higher); higher-poverty schools than district average — tighter screening recommended.
- Market conditions: 477 active listings in the ZIP; 7,378 units permitted in Hidalgo County in 2024 (641 in 5+ unit buildings).
- This rent runs 33% of the median local income ($52k/yr) — at the standard rent-burdened threshold; future hikes will face affordability resistance.
Forward outlook
- Local home prices are declining (-3.0%/yr); year-one equity from $899 of loan paydown is wiped out by about $4k of value loss. Plan a longer hold.
- Hidalgo County population projected at +28% by 2050 — long-run rental-demand tailwind backs the buy-and-hold thesis.
Negotiation context
- It's been on market 353 days — a 12% lower offer ($114k) is reasonable based on typical stale-listing flexibility.
Risks & watch-outs
- Watch-outs: flood insurance adds $66/mo.
- Climate carrying-cost: major flood risk; severe wind risk, 99% chance of damaging wind over 30y; major wildfire risk; extreme-heat days projected 6→19/yr by 2055 (HVAC capex compounding) — expect insurance premiums to compound above CPI over the hold.
Questions for the listing agent
- It's been on market 353 days. Have you received any prior offers? Is the seller open to a 12% concession, seller financing, or rate buy-down credit?
- What's the actual annual flood-insurance premium (NFIP or private), and is the property in a SFHA with mandatory coverage?
- Why hasn't it sold? Are there any deal-killer items the seller is aware of (foundation, flood, title, zoning, code violations)?
- Is there a deadline driving the sale (1031 exchange, divorce, estate, relocation)? That informs how much negotiation room exists.
- Schools are F-rated, which usually means shorter tenancies and higher turnover. Who's the typical renter profile here, and what's been the actual vacancy rate?
- Crime grade is F in this area — have there been break-ins, vandalism, or insurance claims at this property in the last 3 years? What carrier currently insures it and at what premium?
- What's the average days-on-market for RENTAL listings here right now (not sales)? A rising rental-DOM trend means longer vacancies and softer asking-rent achievability than the comps imply.
- What's the recent tenant-quality profile in this submarket — average credit score on applications, eviction rate, late-payment / NSF rate, and stable-employment percentage? A property-management company in the area should have these aggregated.
- How much new for-sale + rental construction is in the pipeline within 1–3 miles? Heavy new supply typically softens prices + rents 12–24 months out; constrained supply supports both.
Investment metrics
- 1% rule
- 1.12% ✓
- Cap rate
- 9.05%
- Cash-on-cash
- 9.86%
- DSCR
- 1.44
- GRM
- 7.4
CMA / ARV
No comps found within radius.
Projected returns pro-forma
-3.0% appreciation · 3.0% rent growth · sell at horizon
- IRR
- -4.6%
- Equity multiple
- 0.83×
- Total profit
- $-6,214
- Equity at exit
- $19,383
- IRR
- 5.1%
- Equity multiple
- 1.38×
- Total profit
- $13,813
- Equity at exit
- $11,240
Cash invested: $36,400 (down + closing). Projections, not guarantees.
Landlord ↔ Tenant lean methodology
- Overall (STATE)
- 87 Strongly Landlord-Friendly
- State Texas
- 87 Strongly Landlord-Friendly · R+5
- County
- — inherits STATE
- City
- — inherits STATE
ZIP-level market 78574
- Home prices YoY
- -16.1%
- Active inventory
- 477
- Price-to-rent
- 7.4×
Monthly cashflow live
- Estimated rent
- $1,461 medium interval (Pro) →
- Mortgage (P&I)
- −$682
- Tax from tax record
- −$119 /mo · $1,426/yr
- Insurance
- −$54
- Flood insurance flood zone
- −$66 /mo · $798/yr
- HOA
- −$0
- Vacancy / Maint / Mgmt
- −$307
- Net cashflow
- $233
Break-even live
Sensitivity live
| Price | -10% $306 | -5% $269 | +0% $233 | +5% $196 | +10% $159 |
|---|---|---|---|---|---|
| Rent | -10% $117 | -5% $175 | +0% $233 | +5% $290 | +10% $348 |
| Rate | -1.0pp $298 | -0.5pp $266 | base $233 | +0.5pp $199 | +1.0pp $165 |
UW: 25.0% down · 7.5% · 30yr · 1.5% tax · 5.0% vac · 8.0% maint · 8.0% mgmt
Financing live
Cash to close
- Down payment
- $32,500
- Closing costs
- $3,900
- Reserves months
- —
- Total cash needed
- —
Loan-product check · same deal, 3 products live
Conventional
25% down · 7.5% · 30yr
- Down + closing
- —
- Monthly P&I
- —
- Monthly cashflow
- —
- DSCR
- —
- Eligible?
- —
Personal DTI + credit; lowest rate.
DSCR
20% down · 8.5% · 30yr
- Down + closing
- —
- Monthly P&I
- —
- Monthly cashflow
- —
- DSCR
- —
- Eligible?
- —
No personal income docs; deal must DSCR.
Hard money
10% down · 12.0% · 12mo
- Down + closing
- —
- Monthly P&I
- —
- Monthly cashflow
- —
- DSCR
- —
- Eligible?
- —
Short-term bridge; refi at stabilization.
Listing history 22 events
-
2026-06-22days on market $130,000 Active 353 DOM
-
2026-06-18days on market $130,000 Active 350 DOM
-
2026-06-17days on market $130,000 Active 349 DOM
-
2026-06-16days on market $130,000 Active 348 DOM
-
2026-06-15days on market $130,000 Active 347 DOM
-
2026-06-14days on market $130,000 Active 345 DOM
-
2026-06-13days on market $130,000 Active 344 DOM
-
2026-06-10days on market $130,000 Active 342 DOM
-
2026-06-09days on market $130,000 Active 341 DOM
-
2026-06-08days on market $130,000 Active 340 DOM
-
2026-06-07days on market $130,000 Active 339 DOM
-
2026-06-05days on market $130,000 Active 336 DOM
-
2026-06-03days on market $130,000 Active 335 DOM
-
2026-06-02days on market $130,000 Active 334 DOM
-
2026-06-01days on market $130,000 Active 333 DOM
-
2026-05-31days on market $130,000 Active 332 DOM
-
2026-05-31days on market $130,000 Active 331 DOM
-
2026-03-05price $130,000 371-char remark
Show marketing remark (371 chars)
Mobile home sitting on a half cul-de-sac lot in North Mission featuring 3 bedrooms, 2 full bathrooms, plus a bonus room with its own mini-split AC. The property includes a fully fenced yard, a storage shed, and is just a short drive to shopping and dining. Owner financing is available, making this a great opportunity for flexible homeownership in a convenient location.
-
2026-02-10price $95,000 371-char remark
Show marketing remark (371 chars)
Mobile home sitting on a half cul-de-sac lot in North Mission featuring 3 bedrooms, 2 full bathrooms, plus a bonus room with its own mini-split AC. The property includes a fully fenced yard, a storage shed, and is just a short drive to shopping and dining. Owner financing is available, making this a great opportunity for flexible homeownership in a convenient location.
-
2025-09-21price $125,000 371-char remark
Show marketing remark (371 chars)
Mobile home sitting on a half cul-de-sac lot in North Mission featuring 3 bedrooms, 2 full bathrooms, plus a bonus room with its own mini-split AC. The property includes a fully fenced yard, a storage shed, and is just a short drive to shopping and dining. Owner financing is available, making this a great opportunity for flexible homeownership in a convenient location.
-
2025-07-03$130,000 Active 371-char remark
Show marketing remark (371 chars)
Mobile home sitting on a half cul-de-sac lot in North Mission featuring 3 bedrooms, 2 full bathrooms, plus a bonus room with its own mini-split AC. The property includes a fully fenced yard, a storage shed, and is just a short drive to shopping and dining. Owner financing is available, making this a great opportunity for flexible homeownership in a convenient location.
-
2005-07-21soldstatus
ⓘ Source: listings_history table (triggers on properties + properties_extension) + one-shot
backfill from property_details.listing_events for pre-trigger history.
Tax reassessment forecast TX · Resets to sale price
- Current annual tax
- $1,426 · $119/mo
- Projected year-2 tax
- $2,379 · $198/mo
- Expected delta
- +$953/yr (+$79/mo · 66.8%)
ⓘ Screening estimate from a state-policy table — verify with the county assessor before closing.
Climate risk First Street
- Flood 7/10 Severe FEMA zone X · 99% chance over 30 yrs
- Wildfire 7/10 Severe
- Heat 9/10 Extreme 6 d/yr ≥112°F today · 19 d/yr by 30 yrs out
- Wind 8/10 Severe 99% chance of damaging wind over 30 yrs
- Air quality 1/10 Low 0 unhealthy d/yr today · 0 by 30 yrs out
Nearby sold comps map
Loading sold comps map…
Walkable amenities ~0.75 mi
Loading nearby amenities…
Taxation est. · year 1
- Rental income
- $17,527
- − Mortgage interest
- −$7,282
- − Property taxes
- −$1,426
- − Insurance
- −$1,448
- − Repairs & maintenance
- −$1,402
- − Management
- −$1,402
- − Depreciation
- −$3,782
- Taxable income
- $785
- Est. tax owed @ 24.0%
- −$188
- After-tax cash flow
- $2,603/yr
For passive investors: Depreciation is non-cash, so a rental often shows a tax loss while cash-flowing — sheltering income. Rental losses are passive: they offset passive income freely, and up to $25,000/yr can offset ordinary (W-2) income if you actively participate and your MAGI is under $100k (phasing out to $0 by $150k); unused losses carry forward. On sale, claimed depreciation is recaptured at up to 25%, and gains may owe capital-gains tax (a 1031 exchange can defer both). Figures are a year-1 estimate at your 24.0% rate — not tax advice; consult a CPA.
Schools (NCES district)
- District
- La Joya ISD
- NCES district ID
- 4826130
- Math proficiency
- 18% ▼ -35.00%
- Reading proficiency
- 29% ▼ -10.00%
- Median HH income
- $27,845
- Composite
- 18.65/100
- National rank
- #8891
- State rank
- #759 of 826 in TX
Livability — La Homa
- Score
- 56/100
- State rank
- #1308
- US rank
- #22643
Category grades
Schools grade is shown separately in the Schools card above.
Census & demographics
- County
- Hidalgo County · 623,128 people
- City population
- 62,456
- Metro
- McAllen-Edinburg-Mission, TX
- Population (ZIP)
- 62,456
- Household income
- $52,393
- Rent vs Own
- Severe rent burden
- 803.0
Population outlook (Hidalgo County) Hauer SSP2
- Today (2025)
- 955,232 people
- By 2030
- 1,009,774 · +5.7%
- By 2040
- 1,120,332 · +17.3%
- By 2050
- 1,225,036 · +28.2%
- By 2075
- 1,439,189 · +50.7%
- By 2100
- 1,533,429 · +60.5%
Race, ethnicity, and origin ACS 2023
- Neighborhood character
- Predominantly Hispanic (97%)
- Race & ethnicity
- Hispanic / Latino 97% Two or more races 62% White 2%
- Hispanic origin (detail)
- Mexican 93%
- Foreign-born
- 33% · Canada
- Languages at home
- 12% English-only · Spanish 87%
Political lean MEDSL · Hidalgo
- 2024 margin
- Toss-up / Even · D 48.1% · R 51.0%
- 2008→2024 swing
- -41.6pp toward R · 2008: 38.7pp · 2024: -2.9pp
- All cycles
- 2024: R+2.9 2020: D+17.1 2016: D+40.5 2012: D+41.8 2008: D+38.7
Not yet ingested
- Civics
- —
Market trends
- HPI YoY
- ▼ -44.13%
- Current HPI
- 230.3323
- Rent YoY
- —
- Metro
- McAllen-Edinburg-Mission, TX
- State GDP YoY
- ▲ 3.95%
- F500 in state
- 110
Industry mix (Fortune 500 HQ in TX)
| Industry | F500 HQs | Revenue |
|---|---|---|
| Energy | 16 | $1,198B |
|
||
| Technology | 5 | $198B |
|
||
| Engineering / Construction | 4 | $72B |
|
||
| Energy Services | 3 | $60B |
|
||
| Utilities | 3 | $41B |
|
||
| Healthcare | 2 | $330B |
|
||
Price history
+0.0% since first listed5 events — show timeline
- 2026-03-05 Price Changed $130,000 MCALLENMLS
- 2026-02-10 Price Changed $95,000 MCALLENMLS
- 2025-09-21 Price Changed $125,000 MCALLENMLS
- 2025-07-03 Listed $130,000 MCALLENMLS
- 2005-07-21 Sold (Public Records) — Public Records
Property tax history
+3.3%/yrLatest (2025): $1,426 · +10.4% YoY. Source: county tax records.
Cash-flow waterfall
monthlySold comps — $/sqft
last 12 mo · ≤1 miLoading sold comps…