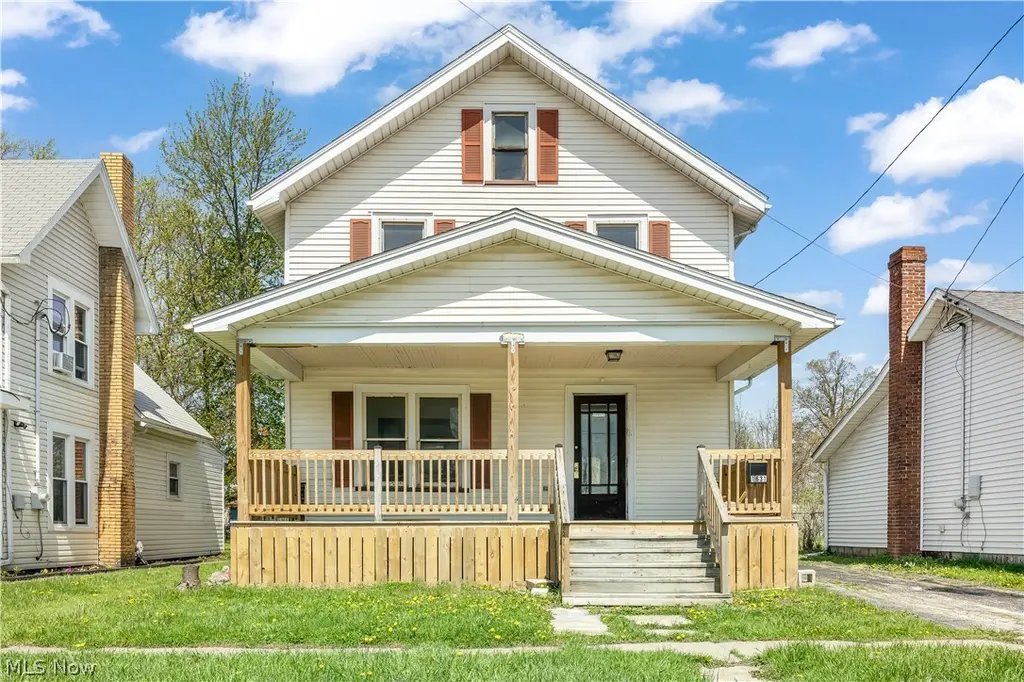
1631 W 8th St · Ashtabula, OH
Flood risk 1/10 · Minimal
- FEMA flood zone
- X (unshaded)
- Chance of flooding over 30 yrs
- 0.0%
- Est. flood insurance / yr
- $473 – $860
Fire risk 1/10 · Minimal
- Est. fire insurance / yr
- $713 – $1,323
Heat risk 3/10 · Minor
- Hot days now (above 93°F)
- 7 days/yr
- Hot days in 30 yrs
- 18 days/yr
Wind risk 1/10 · Minimal
- Chance of severe wind over 30 yrs
- —
Air-quality risk 3/10 · Minor
- Unhealthy air days now
- 2 days/yr
- Unhealthy air days in 30 yrs
- 5 days/yr
Risk factors via First Street. Map © Google.
Why this score? — see what drove the B- grade
The composite is a weighted blend of 9 inputs, each scored 0–100. Each bar is that input's sub-score; the figure is the points it added to the 100-point composite (weight × sub-score).
- Cash flow +30.0/30.0
- 1% rule +10.0/10.0
- DSCR +10.0/10.0
- ARV discount +5.6/15.0
- Livability +3.6/5.0
- Rent growth +2.5/5.0
- Condition / age +2.5/5.0
- Schools +2.4/10.0
- Appreciation +0.0/10.0
$132,900
🖨 Deal sheet (PDF) 📄 Offer letter ✓ Due diligence
Listing remarks
Where historic character meets modern comfort! Situated on the north side of 8th Street, this turn-of-the-century Colonial offers an incredible location just a short distance from the shops of Bridge Street and the shore of Walnut Beach Park. This home offers a clean, updated interior that perfectly balances 1900’s craftsmanship with essential modern updates. The curb appeal starts with a brand-new front porch (2025), providing a great spot to relax. Step through the door to find a freshly painted interior in a clean, neutral palette that highlights the original woodwork and hardwood floors. The kitchen is functional and bright, featuring durable ceramic tile flooring and a convenient
Key facts
- Updated electrical
- Private balcony
- Mechanical updates
Tags
Property features AI
Finance
- HOA & community: Community has lake access, street lights, and sidewalks
Exterior
- Parking: Driveway; On-street parking
- Utilities: Public water; Public sewer
- Home design: Two-story single-family home; Faces south; Block foundation
- Construction: Vinyl siding; Asphalt/fiberglass roof; Built in public-records era (year built from public records)
- Exterior features: Covered front porch; Balcony; Partial chain link fence in back yard; Back yard is flat and level; Rectangular lot
Interior
- Kitchen: Eat-in kitchen with breakfast bar; Ceramic tile flooring in kitchen
- Bedrooms: Three bedrooms on the second level
- Flooring: Wood flooring in living, dining and bedrooms; Ceramic tile flooring in kitchen and bathrooms
- Bathrooms: One full bathroom on the second level; One half bathroom on the first level
- Heating & cooling: Forced-air heating; Gas heating
- Interior features: Natural woodwork in living and dining rooms; Breakfast bar; Ceiling fans; Decorative fireplace; Wood window frames
- Laundry & utility: Washer hookup in basement; Electric dryer hookup; Gas dryer hookup; Laundry located in basement
Neighborhood map
What this means for you Summary
Snapshot
- This is a 3-bed/1.0-bath single-family listed at $133k.
Deal economics
- At list price, monthly cash flow is $2k ($20k/yr) — positive.
- The deal already cash-flows at list — no discount required.
- Meets the 1% rule at list price ($3k rent vs $133k).
- Recommended offer: $131k (1.5% below list) — sets the bar for market timing.
- Cap rate 21.6% vs local median 8.3% in Ashtabula — top-decile yield for the area; either an underpriced asset or a hidden risk that comps aren't pricing in. Stress-test before assuming the spread holds.
Location & tenants
- Location reads 71/100 on livability (#420 in OH) — a middle-class / working-renter tenant base. Strengths: cost of living A+, health & safety A+, housing A; Watch: amenities F, commute F, employment F.
- Ashtabula Area City (town): math 24% / reading 35% proficiency, ranked #588 of 656 in OH (top 90%) — low school quality limits family demand, transient renter base, plan for 1-2y turnover; 63% free/reduced lunch — lower-income household profile, screen leases tightly.
- Zoned schools: Superior Intermediate School (math 30% / reading 31%, grade F, #1,151 of 1,584 statewide, top 73%, 436 students, 0% FRL); Lakeside Junior High School (math 24% / reading 34%, grade F, #579 of 654 statewide, top 89%, 505 students, 0% FRL); Lakeside High School (math 12% / reading 37%, grade F, #644 of 781 statewide, top 85%, 894 students, 0% FRL) — zoned schools average 0% FRL vs 63% district-wide (63 pts lower); this property's tenant base skews higher-income than the district average.
- Market conditions: 170 active listings in the ZIP; 2 comparable units currently listed for rent nearby; 155 units permitted in Ashtabula County in 2024 (0 in 5+ unit buildings).
- At $3,199/mo this rent would consume 78% of the median local household income ($50k/yr) — very limited rent-growth headroom before tenants either downsize or default.
Forward outlook
- Local home prices are declining (-3.0%/yr); year-one equity from $919 of loan paydown is wiped out by about $4k of value loss. Plan a longer hold.
- Ashtabula County population projected at -22% by 2050 — secular population decline; favor cash flow + early exit over multi-decade hold.
- At projected returns (-3.0% appreciation + 3.0% rent growth), your $37k cash investment doubles in ~3 years — after that, you're playing with house money.
Negotiation context
- It's been on market 29 days — a 2% lower offer ($131k) is reasonable based on typical stale-listing flexibility.
- 10 sale attempts since 16y ago with the ask held roughly flat each time — persistent listings suggest the price (not the market) is what's stuck; bring a comps-based counter.
- Current owner paid $16k; list at $133k implies a 736% gain — meaningful room to come down on a strong offer.
Risks & watch-outs
- Watch-outs: built in 1900 — expect roof / HVAC / electrical / plumbing capex.
Questions for the listing agent
- Built in 1900 — when were the roof, HVAC, electrical panel, plumbing, and water heater last replaced?
- Is there a deadline driving the sale (1031 exchange, divorce, estate, relocation)? That informs how much negotiation room exists.
- What's the average days-on-market for RENTAL listings here right now (not sales)? A rising rental-DOM trend means longer vacancies and softer asking-rent achievability than the comps imply.
- What's the recent tenant-quality profile in this submarket — average credit score on applications, eviction rate, late-payment / NSF rate, and stable-employment percentage? A property-management company in the area should have these aggregated.
- How much new for-sale + rental construction is in the pipeline within 1–3 miles? Heavy new supply typically softens prices + rents 12–24 months out; constrained supply supports both.
Investment metrics
- 1% rule
- 2.41% ✓
- Cap rate
- 21.63%
- Cash-on-cash
- 54.79%
- DSCR
- 3.44
- GRM
- 3.5
CMA / ARV
- ARV (median comp)
- $127,630
- List price
- $132,900
- Delta
- 4.13%
- Verdict
- FAIR
- Comps
- 20 within 1.0 mi
Show comp detail 12 sales within ~0.75 mi
| Address | Dist | Beds/Ba | Sqft | Sold | Price | $/sf | Match |
|---|---|---|---|---|---|---|---|
| 1712 W 6th St | 0.10mi | 3/1.5 | 1,348 (+1%) | 2mo | $155,000 | $115 | 90 |
| 1821 W 8th St | 0.15mi | 3/1.0 | 1,234 (-8%) | 5mo | $118,000 | $96 | 76 |
| 1811 W 6th St | 0.17mi | 3/1.5 | 1,248 (-7%) | 4mo | $125,000 | $100 | 75 |
| 2531 Burlingham Dr | 0.70mi | 3/1.5 | 1,368 (+2%) | 1mo | $221,500 | $162 | 61 |
| 1307 W 9th St | 0.38mi | 3/1.0 | 1,170 (-13%) | 4mo | $56,999 | $49 | 58 |
| 1606 Ohio Ave | 0.69mi | 2/2.0 (-1) | 1,344 (+0%) | 4mo | $150,000 | $112 | 55 |
| 1923 W 11th St | 0.37mi | 3/2.0 | 1,493 (+12%) | 6mo | $82,000 | $55 | 55 |
| 1128 Myrtle Ave | 0.48mi | 3/1.0 | 1,160 (-13%) | 2mo | $159,900 | $138 | 54 |
| 1115 Myrtle Ave | 0.47mi | 3/1.5 | 1,184 (-12%) | 5mo | $68,000 | $57 | 52 |
| 1028 Lyndon Ave | 0.45mi | 2/2.0 (-1) | 1,486 (+11%) | 7mo | $167,000 | $112 | 46 |
| 2512 W 9th St | 0.63mi | 4/2.0 (+1) | 1,456 (+9%) | 2mo | $225,000 | $155 | 46 |
| 1405 Allen | 0.74mi | 3/2.0 | 1,450 (+8%) | 7mo | $219,000 | $151 | 42 |
Match score weights: distance 35% · size 25% · config 20% · recency 20%. Top-matched comps best support the ARV.
Projected returns pro-forma
-3.0% appreciation · 3.0% rent growth · sell at horizon
- IRR
- 53.0%
- Equity multiple
- 3.33×
- Total profit
- $86,669
- Equity at exit
- $19,816
- IRR
- 58.2%
- Equity multiple
- 6.77×
- Total profit
- $214,782
- Equity at exit
- $11,491
Cash invested: $37,212 (down + closing). Projections, not guarantees.
Landlord ↔ Tenant lean methodology
- Overall (STATE)
- 73 Landlord-Friendly
- State Ohio
- 73 Landlord-Friendly · R+6
- County
- — inherits STATE
- City
- — inherits STATE
ZIP-level market 44004
- Home prices YoY
- -30.5%
- Active inventory
- 170
- Price-to-rent
- 3.5×
Monthly cashflow live
- Estimated rent
- $3,199 medium interval (Pro) →
- Mortgage (P&I)
- −$697
- Tax from tax record
- −$76 /mo · $911/yr
- Insurance
- −$55
- HOA
- −$0
- Lot rent
- −$0
- Vacancy / Maint / Mgmt
- −$672
- Net cashflow
- $1,699
Break-even live
Sensitivity live
| Price | -10% $1,774 | -5% $1,737 | +0% $1,699 | +5% $1,661 | +10% $1,624 |
|---|---|---|---|---|---|
| Rent | -10% $1,446 | -5% $1,573 | +0% $1,699 | +5% $1,825 | +10% $1,952 |
| Rate | -1.0pp $1,766 | -0.5pp $1,733 | base $1,699 | +0.5pp $1,665 | +1.0pp $1,630 |
UW: 25.0% down · 7.5% · 30yr · 1.5% tax · 5.0% vac · 8.0% maint · 8.0% mgmt
Financing live
Cash to close
- Down payment
- $33,225
- Closing costs
- $3,987
- Reserves months
- —
- Total cash needed
- —
Loan-product check · same deal, 3 products live
Conventional
25% down · 7.5% · 30yr
- Down + closing
- —
- Monthly P&I
- —
- Monthly cashflow
- —
- DSCR
- —
- Eligible?
- —
Personal DTI + credit; lowest rate.
DSCR
20% down · 8.5% · 30yr
- Down + closing
- —
- Monthly P&I
- —
- Monthly cashflow
- —
- DSCR
- —
- Eligible?
- —
No personal income docs; deal must DSCR.
Hard money
10% down · 12.0% · 12mo
- Down + closing
- —
- Monthly P&I
- —
- Monthly cashflow
- —
- DSCR
- —
- Eligible?
- —
Short-term bridge; refi at stabilization.
Rent comps 2 comps
| Address | Beds | Baths | Sqft | Rent | $/sqft | DOM | Units | Dist |
|---|---|---|---|---|---|---|---|---|
| 1115 Myrtle Ave Ashtabula, OH | 3.0 | 1.5 | 1184 | $1,600 | $1.35 | 46d | 1 | 0.48mi |
| 1036 Union Ave Unit 1496086P Ashtabula, OH | 3.0 | 1.0 | 1496 | $5,341 | $3.57 | 46d | 1 | 0.65mi |
Listing history 20 events
-
2026-04-24$132,900 Active 1282-char remark
-
2025-11-05historical
-
2025-10-09price $139,999
-
2025-08-25$145,000 Active
-
2024-11-30historical
-
2024-08-30$149,900 Active
-
2023-10-11$129,900 Active
-
2023-09-30historical
-
2023-06-12$139,000 Active
-
2022-01-31historical
-
2021-11-11price $83,900
-
2021-10-27$84,900 Active
-
2021-10-20historical
-
2021-07-29$84,900 Active
-
2011-06-17soldstatus $15,900
-
2011-03-20$20,000
-
2011-03-10historical
-
2010-12-05$25,000
-
2010-11-17historical
-
2010-09-24$27,500
ⓘ Source: listings_history table (triggers on properties + properties_extension) + one-shot
backfill from property_details.listing_events for pre-trigger history.
Tax reassessment forecast OH · Partial reset (capped growth)
- Current annual tax
- $911 · $76/mo
- Projected year-2 tax
- $1,492 · $124/mo
- Expected delta
- +$581/yr (+$48/mo · 63.7%)
ⓘ Screening estimate from a state-policy table — verify with the county assessor before closing.
Climate risk First Street
- Flood 1/10 Low FEMA zone X (unshaded) · 0% chance over 30 yrs
- Wildfire 1/10 Low
- Heat 3/10 Moderate 7 d/yr ≥93°F today · 18 d/yr by 30 yrs out
- Wind 1/10 Low
- Air quality 3/10 Moderate 2 unhealthy d/yr today · 5 by 30 yrs out
Nearby sold comps map
Loading sold comps map…
Walkable amenities ~0.75 mi
Loading nearby amenities…
Taxation est. · year 1
- Rental income
- $38,389
- − Mortgage interest
- −$7,444
- − Property taxes
- −$911
- − Insurance
- −$664
- − Repairs & maintenance
- −$3,071
- − Management
- −$3,071
- − Depreciation
- −$3,866
- Taxable income
- $19,360
- Est. tax owed @ 24.0%
- −$4,647
- After-tax cash flow
- $15,742/yr
For passive investors: Depreciation is non-cash, so a rental often shows a tax loss while cash-flowing — sheltering income. Rental losses are passive: they offset passive income freely, and up to $25,000/yr can offset ordinary (W-2) income if you actively participate and your MAGI is under $100k (phasing out to $0 by $150k); unused losses carry forward. On sale, claimed depreciation is recaptured at up to 25%, and gains may owe capital-gains tax (a 1031 exchange can defer both). Figures are a year-1 estimate at your 24.0% rate — not tax advice; consult a CPA.
Schools (NCES district)
- District
- Ashtabula Area City
- NCES district ID
- 3904351
- Math proficiency
- 24% ▼ -27.00%
- Reading proficiency
- 35% ▼ -13.00%
- Median HH income
- $34,812
- Composite
- 24.3/100
- National rank
- #7712
- State rank
- #588 of 656 in OH
Livability — Ashtabula
- Score
- 71/100
- State rank
- #420
- US rank
- #6883
Category grades
Schools grade is shown separately in the Schools card above.
Census & demographics
- Census place
- Ashtabula, OH
- County
- Ashtabula · 97,617 people
- City population
- 31,076
- Metro
- Cleveland, OH
- Population (ZIP)
- 31,076
- Household income
- $49,507
- Rent vs Own
- Severe rent burden
- 14.1
Population outlook (Ashtabula County) Hauer SSP2
- Today (2025)
- 92,950 people
- By 2030
- 89,146 · -4.1%
- By 2040
- 80,715 · -13.2%
- By 2050
- 72,270 · -22.2%
- By 2075
- 55,780 · -40.0%
- By 2100
- 40,928 · -56.0%
Race, ethnicity, and origin ACS 2023
- Neighborhood character
- Predominantly White (79%)
- Race & ethnicity
- White 79% Hispanic / Latino 9% Two or more races 7% Black 6%
- Hispanic origin (detail)
- Mexican 3% Puerto Rican 5%
- Common ancestry
- Romanian 4% Iranian 2% Slovak 1%
- Foreign-born
- 3% · Canada
- Languages at home
- 94% English-only · Spanish 4%
Political lean MEDSL · Ashtabula
- 2024 margin
- Strong R (+28.4) · D 35.4% · R 63.8%
- 2008→2024 swing
- -41.9pp toward R · 2008: 13.5pp · 2024: -28.4pp
- All cycles
- 2024: R+28.4 2020: R+23.5 2016: R+19.0 2012: D+12.1 2008: D+13.5
Not yet ingested
- Civics
- —
Market trends
- HPI YoY
- ▼ -114.51%
- Current HPI
- 260.7146
- Rent YoY
- —
- Metro
- —
- State GDP YoY
- ▲ 1.98%
- F500 in state
- 48
Industry mix (Fortune 500 HQ in OH)
| Industry | F500 HQs | Revenue |
|---|---|---|
| Insurance | 3 | $145B |
|
||
| Industrial Machinery | 3 | $49B |
|
||
| Financial Services | 3 | $24B |
|
||
| Consumer Goods | 2 | $93B |
|
||
| Aerospace / Defense | 2 | $47B |
|
||
| Utilities | 2 | $33B |
|
||
Price history
+383.3% since first listed21 events — show timeline
- 2026-05-24 Pending — MLSNOW
- 2026-04-24 Listed $132,900 MLSNOW
- 2025-11-05 Listing Removed — MLSNOW
- 2025-10-09 Price Changed $139,999 MLSNOW
- 2025-08-25 Listed $145,000 MLSNOW
- 2024-11-30 Listing Removed — MLSNOW
- 2024-08-30 Listed $149,900 MLSNOW
- 2023-10-11 Listed $129,900 MLSNOW
- 2023-09-30 Listing Removed — MLSNOW
- 2023-06-12 Listed $139,000 MLSNOW
- 2022-01-31 Listing Removed — MLSNOW
- 2021-11-11 Price Changed $83,900 MLSNOW
- 2021-10-27 Listed $84,900 MLSNOW
- 2021-10-20 Listing Removed — MLSNOW
- 2021-07-29 Listed $84,900 MLSNOW
- 2011-06-17 Sold (MLS) $15,900 MLSNOW
- 2011-03-20 Listed $20,000 MLSNOW
- 2011-03-10 Listing Removed — MLSNOW
- 2010-12-05 Listed $25,000 MLSNOW
- 2010-11-17 Listing Removed — MLSNOW
- 2010-09-24 Listed $27,500 MLSNOW
Property tax history
+2.5%/yrLatest (2025): $911 · -0.2% YoY. Source: county tax records.
Cash-flow waterfall
monthlySold comps — $/sqft
last 12 mo · ≤1 miLoading sold comps…