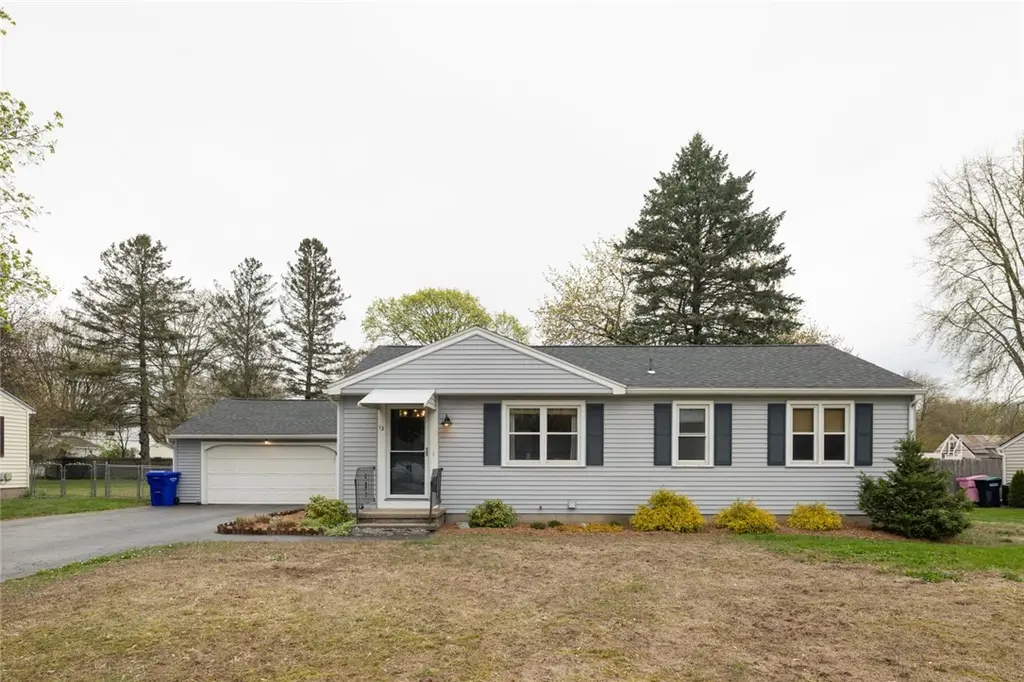
12 Lonran Dr · Gates, NY
Flood risk 1/10 · Minimal
- FEMA flood zone
- X (unshaded)
- Chance of flooding over 30 yrs
- 0.0%
- Est. flood insurance / yr
- $473 – $860
Fire risk 1/10 · Minimal
- Est. fire insurance / yr
- $691 – $1,283
Heat risk 2/10 · Minimal
- Hot days now (above 95°F)
- 7 days/yr
- Hot days in 30 yrs
- 15 days/yr
Wind risk 1/10 · Minimal
- Chance of severe wind over 30 yrs
- —
Air-quality risk 2/10 · Minimal
- Unhealthy air days now
- 1 days/yr
- Unhealthy air days in 30 yrs
- 1 days/yr
Risk factors via First Street. Map © Google.
Why this score? — see what drove the C grade
The composite is a weighted blend of 9 inputs, each scored 0–100. Each bar is that input's sub-score; the figure is the points it added to the 100-point composite (weight × sub-score).
- Cash flow +19.3/30.0
- ARV discount +15.0/15.0
- 1% rule +6.6/10.0
- DSCR +6.1/10.0
- Schools +3.6/10.0
- Livability +3.4/5.0
- Rent growth +2.5/5.0
- Condition / age +2.5/5.0
- Appreciation +0.0/10.0
$175,000
🖨 Deal sheet 📄 Offer letter ✓ Due diligence
Listing remarks MLS
3 bedroom ranch home with large enclosed porch, hardwood floors, central air, and vinyl siding.
Key facts
- Deep farm-style sink
- Tiled shower
- 0.32 acre lot
Tags
Property features AI
Exterior
- Parking: Attached garage with 2 spaces
- Utilities: Public water connected; Sewer connected; Circuit breaker electrical system
- Home design: Single-story house; Existing (resale) property
- Construction: Vinyl siding; Copper plumbing; Asphalt roof; Block foundation; Built previously (existing)
- Exterior features: Blacktop driveway; Deck; Partial fencing
Interior
- Kitchen: Gas oven; Gas range; Dishwasher; Microwave; Refrigerator
- Bedrooms: Three main-level bedrooms
- Flooring: Hardwood; Vinyl; Varied flooring
- Bathrooms: One full bathroom on the main level
- Heating & cooling: Gas forced-air heating; Central air conditioning
- Interior features: Separate/formal living room; Living/dining room area; Pantry; Sunroom / Florida room; Full basement
- Laundry & utility: Washer and dryer; Laundry located in the basement; Gas water heater; Home generator
Neighborhood map
What this means for you Summary
Snapshot
- This is a 3-bed/1.0-bath single-family listed at $175k.
Deal economics
- At list price, monthly cash flow is $193 ($2k/yr) — positive.
- The deal already cash-flows at list — no discount required.
- Meets the 1% rule at list price ($2k rent vs $175k).
- Cap rate 7.6% vs local median 5.9% in Gates — meaningfully above typical; check what's discounted (condition, days-on-market, listing class) to confirm the premium yield is real.
Location & tenants
- Location reads 67/100 on livability (#582 in NY) — a middle-class / working-renter tenant base. Strengths: housing A+, health & safety A+; Watch: amenities F, commute F.
- Gates-Chili Central School District (suburban): math 41% / reading 42% proficiency, ranked #491 of 590 in NY (top 83%) — families likely to look elsewhere, expect single-tenant / working-renter base with shorter leases.
- Market conditions: 127 active listings in the ZIP; 5 comparable units currently listed for rent nearby; rentals leasing fast (median 3d on market — plan ~1-2 weeks tenant-placement turnaround); solid renter incomes; 1,169 units permitted in Monroe County in 2024 (591 in 5+ unit buildings).
Forward outlook
- Local home prices are declining (-3.0%/yr); year-one equity from $1k of loan paydown is wiped out by about $5k of value loss. Plan a longer hold.
- Monroe County population projected to shrink 6% by 2050 — rents likely to lag national; underwrite the cash flow, not the appreciation.
Negotiation context
- Only 14 days on market — expect competitive offers; lowballing is unlikely to land.
- 2 sale attempts since 6y ago with the ask held roughly flat each time — persistent listings suggest the price (not the market) is what's stuck; bring a comps-based counter.
- Current owner paid $115k; list at $175k implies a 52% gain — meaningful room to come down on a strong offer.
Risks & watch-outs
- Watch-outs: property tax is 2.9% of price; built in 1955 — expect roof / HVAC / electrical / plumbing capex.
Questions for the listing agent
- Built in 1955 — when were the roof, HVAC, electrical panel, plumbing, and water heater last replaced?
- Property tax is high relative to price — has the assessment been appealed recently, and will the sale trigger a re-assessment?
- Is there a deadline driving the sale (1031 exchange, divorce, estate, relocation)? That informs how much negotiation room exists.
- Schools are B-rated — typically a magnet for longer-tenancy family renters. What's the average tenant stay here, and is there a school-zone premium baked into asking?
- What's the average days-on-market for RENTAL listings here right now (not sales)? A rising rental-DOM trend means longer vacancies and softer asking-rent achievability than the comps imply.
- What's the recent tenant-quality profile in this submarket — average credit score on applications, eviction rate, late-payment / NSF rate, and stable-employment percentage? A property-management company in the area should have these aggregated.
- How much new for-sale + rental construction is in the pipeline within 1–3 miles? Heavy new supply typically softens prices + rents 12–24 months out; constrained supply supports both.
Investment metrics
- 1% rule
- 1.16% ✓
- Cap rate
- 7.62%
- Cash-on-cash
- 4.73%
- DSCR
- 1.21
- GRM
- 7.2
CMA / ARV
- ARV (median comp)
- $248,730
- List price
- $175,000
- Delta
- -29.64%
- Verdict
- UNDERPRICED
- Comps
- 20 within 1.0 mi
Show comp detail 11 sales within ~0.75 mi
| Address | Dist | Beds/Ba | Sqft | Sold | Price | $/sf | Match |
|---|---|---|---|---|---|---|---|
| 24 Tarrytown Dr | 0.28mi | 3/1.5 | 950 (-10%) | 1mo | $250,000 | $263 | 67 |
| 20 Tarrytown Dr | 0.28mi | 3/1.0 | 950 (-10%) | 10mo | $235,000 | $247 | 62 |
| 26 Chestnut Ridge Rd | 0.40mi | 2/1.0 (-1) | 1,008 (-4%) | 10mo | $159,900 | $159 | 61 |
| 20 Bright Oaks Dr | 0.61mi | 3/1.0 | 1,120 (+6%) | 15mo | $218,000 | $195 | 49 |
| 2876 Chili Ave | 0.74mi | 3/1.5 | 1,152 (+9%) | 1mo | $251,000 | $218 | 48 |
| 874 Chili Center Coldwater Rd | 0.54mi | 3/1.5 | 1,104 (+4%) | 22mo | $250,000 | $226 | 47 |
| 31 Tarrytown Dr | 0.33mi | 2/1.0 (-1) | 950 (-10%) | 23mo | $231,500 | $244 | 44 |
| 40 Chestnut Ridge Rd | 0.33mi | 2/1.5 (-1) | 1,204 (+14%) | 15mo | $215,000 | $179 | 42 |
| 80 Archer Rd | 0.74mi | 3/1.5 | 1,108 (+5%) | 17mo | $250,000 | $226 | 41 |
| 25 Bright Oaks Dr | 0.67mi | 3/2.0 | 1,120 (+6%) | 17mo | $225,000 | $201 | 40 |
| 29 Westway | 0.72mi | 2/2.0 (-1) | 1,146 (+8%) | 9mo | $250,000 | $218 | 36 |
Match score weights: distance 35% · size 25% · config 20% · recency 20%. Top-matched comps best support the ARV.
Projected returns pro-forma
-3.0% appreciation · 3.0% rent growth · sell at horizon
- IRR
- -8.8%
- Equity multiple
- 0.68×
- Total profit
- $-15,904
- Equity at exit
- $26,093
- IRR
- 0.8%
- Equity multiple
- 1.05×
- Total profit
- $2,617
- Equity at exit
- $15,131
Cash invested: $49,000 (down + closing). Projections, not guarantees.
Landlord ↔ Tenant lean methodology
- Overall (STATE)
- 15 Strongly Tenant-Friendly
- State New York
- 15 Strongly Tenant-Friendly · D+10
- County
- — inherits STATE
- City
- — inherits STATE
ZIP-level market 14624
- Active inventory
- 127
- Price-to-rent
- 7.2×
Monthly cashflow live
- Estimated rent
- $2,031 high interval (Pro) →
- Mortgage (P&I)
- −$918
- Tax from tax record
- −$421 /mo · $5,052/yr
- Insurance
- −$73
- HOA
- −$0
- Vacancy / Maint / Mgmt
- −$427
- Net cashflow
- $193
Break-even live
UW: 25.0% down · 7.5% · 30yr · 1.5% tax · 5.0% vac · 8.0% maint · 8.0% mgmt
Financing live
Cash to close
- Down payment
- $43,750
- Closing costs
- $5,250
- Reserves months
- —
- Total cash needed
- —
Loan-product check · same deal, 3 products live
Conventional
25% down · 7.5% · 30yr
- Down + closing
- —
- Monthly P&I
- —
- Monthly cashflow
- —
- DSCR
- —
- Eligible?
- —
Personal DTI + credit; lowest rate.
DSCR
20% down · 8.5% · 30yr
- Down + closing
- —
- Monthly P&I
- —
- Monthly cashflow
- —
- DSCR
- —
- Eligible?
- —
No personal income docs; deal must DSCR.
Hard money
10% down · 12.0% · 12mo
- Down + closing
- —
- Monthly P&I
- —
- Monthly cashflow
- —
- DSCR
- —
- Eligible?
- —
Short-term bridge; refi at stabilization.
Rent comps 5 comps
| Address | Beds | Baths | Sqft | Rent | $/sqft | DOM | Units | Dist |
|---|---|---|---|---|---|---|---|---|
| 200 Mulcahy Blvd Unit 12-B Rochester, NY | 2.0 | 2.0 | 1047 | $1,898 | $1.81 | 2d | 1 | 0.88mi |
| 173 Bending Creek Rd Gates, NY | 1.0–2.0 | 1.0 | 860 | $1,595 | $1.85 | 2d | 7 | 1.02mi |
| 456 Westside Dr Unit 6 Rochester, NY | 2.0 | 2.0 | 994 | $2,100 | $2.11 | 3d | 1 | 1.27mi |
| 350 Westview Commons Blvd Rochester, NY | 1.0–2.0 | 1.0–2.0 | 1087 | $1,860 | $1.71 | 2d | 13 | 1.42mi |
| 50 Silverlight Way Rochester, NY | 2.0 | 2.0 | 1210 | $2,350 | $1.94 | 14d | 1 | 1.44mi |
Listing history 8 events
-
2026-05-14status Pending 1965-char remark
-
2026-05-07historical Active Under Contract 1965-char remark
-
2026-04-30$175,000 Active 1965-char remark
-
2020-04-29soldstatus $115,050
-
2020-04-27soldstatus $115,050 Closed Sale or Rented 95-char remark
Show marketing remark (95 chars)
3 bedroom ranch home with large enclosed porch, hardwood floors, central air, and vinyl siding.
-
2020-03-06status Pending Sale 95-char remark
Show marketing remark (95 chars)
3 bedroom ranch home with large enclosed porch, hardwood floors, central air, and vinyl siding.
-
2020-02-25$85,000 Active 95-char remark
Show marketing remark (95 chars)
3 bedroom ranch home with large enclosed porch, hardwood floors, central air, and vinyl siding.
-
1996-06-28soldstatus $79,600
ⓘ Source: listings_history table (triggers on properties + properties_extension) + one-shot
backfill from property_details.listing_events for pre-trigger history.
Tax reassessment forecast NY · Partial reset (capped growth)
- Current annual tax
- $5,052 · $421/mo
- Projected year-2 tax
- $5,052 · $421/mo
- Expected delta
- $0/yr ($0/mo · 0.0%)
ⓘ Screening estimate from a state-policy table — verify with the county assessor before closing.
Climate risk First Street
- Flood 1/10 Low FEMA zone X (unshaded) · 0% chance over 30 yrs
- Wildfire 1/10 Low
- Heat 2/10 Low 7 d/yr ≥95°F today · 15 d/yr by 30 yrs out
- Wind 1/10 Low
- Air quality 2/10 Low 1 unhealthy d/yr today · 1 by 30 yrs out
Nearby sold comps map
Loading sold comps map…
Walkable amenities ~0.75 mi
Loading nearby amenities…
Taxation est. · year 1
- Rental income
- $24,376
- − Mortgage interest
- −$9,803
- − Property taxes
- −$5,052
- − Insurance
- −$875
- − Repairs & maintenance
- −$1,950
- − Management
- −$1,950
- − Depreciation
- −$5,091
- Taxable loss
- −$345
- Est. tax savings @ 24.0%
- +$83
- After-tax cash flow
- $2,400/yr
For passive investors: Depreciation is non-cash, so a rental often shows a tax loss while cash-flowing — sheltering income. Rental losses are passive: they offset passive income freely, and up to $25,000/yr can offset ordinary (W-2) income if you actively participate and your MAGI is under $100k (phasing out to $0 by $150k); unused losses carry forward. On sale, claimed depreciation is recaptured at up to 25%, and gains may owe capital-gains tax (a 1031 exchange can defer both). Figures are a year-1 estimate at your 24.0% rate — not tax advice; consult a CPA.
Schools (NCES district)
- District
- Gates-Chili Central School District
- NCES district ID
- 3611880
- Math proficiency
- 41% ▼ -12.00%
- Reading proficiency
- 42% ▼ -6.00%
- Median HH income
- $55,045
- Composite
- 36.23/100
- National rank
- #4719
- State rank
- #491 of 590 in NY
Livability — Gates
- Score
- 67/100
- State rank
- #582
- US rank
- #10531
Category grades
Schools grade is shown separately in the Schools card above.
Census & demographics
- County
- Monroe County · 674,131 people
- Metro
- Rochester, NY
- Population (ZIP)
- 38,626
- Household income
- $87,989
- Rent vs Own
- Severe rent burden
- 584.0
Population outlook (Monroe County) Hauer SSP2
- Today (2025)
- 759,460 people
- By 2030
- 757,154 · -0.3%
- By 2040
- 740,644 · -2.5%
- By 2050
- 714,443 · -5.9%
- By 2075
- 645,883 · -15.0%
- By 2100
- 547,084 · -28.0%
Race, ethnicity, and origin ACS 2023
- Neighborhood character
- Predominantly White (78%)
- Race & ethnicity
- White 78% Black 9% Hispanic / Latino 6% Two or more races 5% Asian 3%
- Hispanic origin (detail)
- Puerto Rican 4%
- Common ancestry
- Romanian 6% Iranian 2% Lithuanian 2%
- Foreign-born
- 7% · Canada, China, India
- Languages at home
- 90% English-only · Spanish 3% Other Indo-European 3% Russian/Polish/Slavic 1%
Political lean MEDSL · Monroe
- 2024 margin
- D (+19.1) · D 59.5% · R 40.5%
- 2008→2024 swing
- +1.4pp toward D · 2008: 17.7pp · 2024: 19.1pp
- All cycles
- 2024: D+19.1 2020: D+21.0 2016: D+14.1 2012: D+17.4 2008: D+17.7
Not yet ingested
- Civics
- —
Market trends
- HPI YoY
- ▼ -151.26%
- Current HPI
- 267.356
- Rent YoY
- —
- Metro
- Rochester, NY
- State GDP YoY
- ▲ 2.60%
- F500 in state
- 92
Industry mix (Fortune 500 HQ in NY)
| Industry | F500 HQs | Revenue |
|---|---|---|
| Financial Services | 10 | $950B |
|
||
| Consumer Goods | 9 | $162B |
|
||
| Insurance | 4 | $225B |
|
||
| Telecommunications | 2 | $144B |
|
||
| Pharmaceuticals | 2 | $112B |
|
||
| Media / Entertainment | 2 | $69B |
|
||
Price history
+119.8% since first listed8 events — show timeline
- 2026-05-14 Pending — UNYREIS
- 2026-05-07 Contingent — UNYREIS
- 2026-04-30 Listed $175,000 UNYREIS
- 2020-04-29 Sold (Public Records) $115,050 Public Records
- 2020-04-27 Sold (MLS) $115,050 UNYREIS
- 2020-03-06 Pending — UNYREIS
- 2020-02-25 Listed $85,000 UNYREIS
- 1996-06-28 Sold (Public Records) $79,600 Public Records
Property tax history
+17.2%/yrLatest (2025): $5,052 · -8.8% YoY. Source: county tax records.
Cash-flow waterfall
monthlySold comps — $/sqft
last 12 mo · ≤1 miLoading sold comps…