 Fourplex
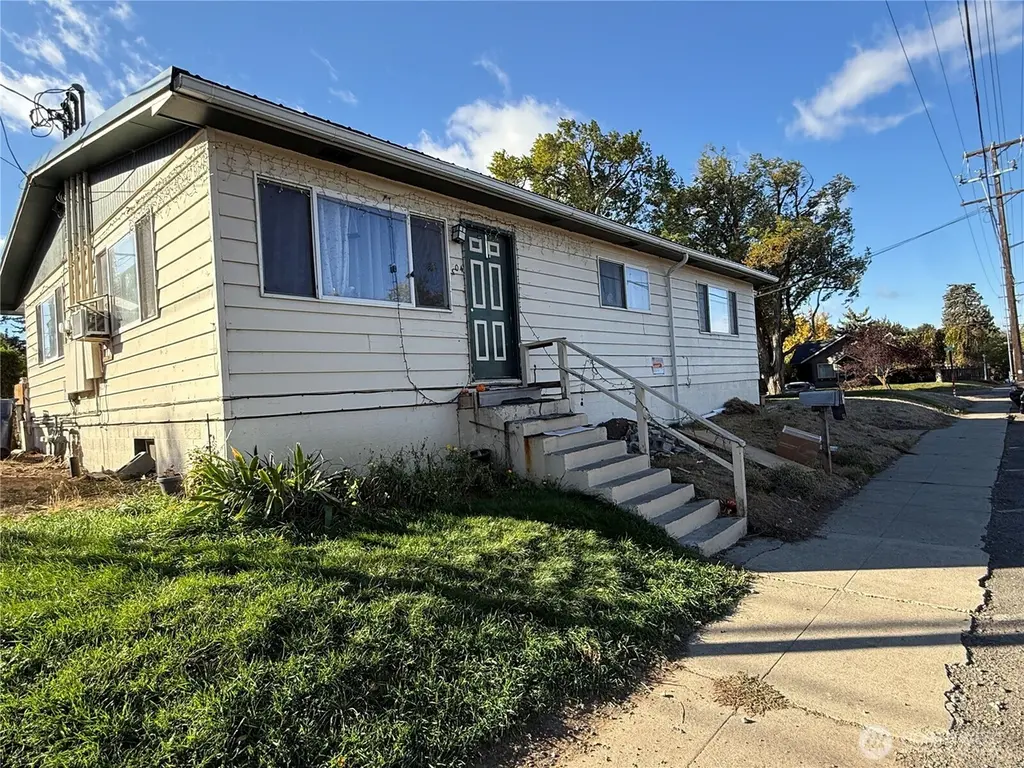
304 W 6th · Ellensburg, WA
Flood risk 1/10 · Minimal
- FEMA flood zone
- X (unshaded)
- Chance of flooding over 30 yrs
- 0.0%
- Est. flood insurance / yr
- $507 – $1,088
Fire risk 6/10 · Moderate
- Est. fire insurance / yr
- $604 – $1,122
Heat risk 3/10 · Minor
- Hot days now (above 94°F)
- 7 days/yr
- Hot days in 30 yrs
- 14 days/yr
Wind risk 1/10 · Minimal
- Chance of severe wind over 30 yrs
- —
Air-quality risk 9/10 · Severe
- Unhealthy air days now
- 16 days/yr
- Unhealthy air days in 30 yrs
- 17 days/yr
Risk factors via First Street. Map © Google.
Why this score? — see what drove the C grade
The composite is a weighted blend of 9 inputs, each scored 0–100. Each bar is that input's sub-score; the figure is the points it added to the 100-point composite (weight × sub-score).
- Cash flow +21.5/30.0
- ARV discount +10.9/15.0
- DSCR +6.9/10.0
- 1% rule +5.0/10.0
- Schools +4.5/10.0
- Livability +4.1/5.0
- Rent growth +2.6/5.0
- Condition / age +2.5/5.0
- Appreciation +0.0/10.0
$499,000
🖨 Deal sheet 📄 Offer letter ✓ Due diligence
Multi-family units
County records classify this as Multi-Family (2-4 Unit). Listing-text estimate: 4 units. confirmed
Listing remarks
Investors, take note of this versatile property at 304 W 6th Ave, Ellensburg. This multi-unit building is located close to the vibrant Historic Downtown and local government offices. This investment boasts a total of four units—two spacious 2-bedroom units & two efficient studio units. Many recent updates, including contemporary kitchens that add significant value and appeal for tenants. Easy parking, enhancing convenience for residents. Zoned for Residential Office use, offering the flexibility of additional business usage in a high-demand area. For real estate investors looking to expand their portfolio in a solid market with growth potential, this listing is an ideal candidat
Key facts
- Multi-unit building
- Historic downtown
- Easy parking
Tags
Neighborhood map
What this means for you Summary
Snapshot
- This is a 2×2bd/1ba + 2×1bd/1ba units multifamily listed at $499k.
Deal economics
- At list price, monthly cash flow is $753 ($9k/yr) — positive. Per door: $188/mo.
- The deal already cash-flows at list — no discount required.
- Meets the 1% rule at list price ($5k rent vs $499k).
- Recommended offer: $439k (12.0% below list) — sets the bar for market timing.
- Cap rate 8.1% vs local median 2.8% in Ellensburg — top-decile yield for the area; either an underpriced asset or a hidden risk that comps aren't pricing in. Stress-test before assuming the spread holds.
Location & tenants
- Location reads 82/100 on livability (#64 in WA, #1,157 nationally) — a professional / high-income tenant draw. Strengths: amenities A+, commute A+, health & safety A+; Watch: employment D-.
- Ellensburg School District (town): math 47% / reading 55% proficiency, ranked #148 of 291 in WA (top 51%) — acceptable for families but not a draw, mixed tenant base, ~2y average lease.
- Market conditions: Rents flat; 302 active listings in the ZIP; 433 units permitted in Kittitas County in 2024 (23 in 5+ unit buildings).
- At $5,008/mo this rent would consume 84% of the median local household income ($71k/yr) (locally 2076% of renters already pay >50% of income on rent) — very limited rent-growth headroom before tenants either downsize or default.
Forward outlook
- Local home prices are declining (-3.0%/yr); year-one equity from $3k of loan paydown is wiped out by about $15k of value loss. Plan a longer hold.
- Kittitas County population projected at +30% by 2050 — long-run rental-demand tailwind backs the buy-and-hold thesis.
Negotiation context
- It's been on market 196 days — a 12% lower offer ($439k) is reasonable based on typical stale-listing flexibility.
- Current owner paid $144k; list at $499k implies a 248% gain — meaningful room to come down on a strong offer.
Risks & watch-outs
- Climate carrying-cost: major wildfire risk — expect insurance premiums to compound above CPI over the hold.
Questions for the listing agent
- It's been on market 196 days. Have you received any prior offers? Is the seller open to a 12% concession, seller financing, or rate buy-down credit?
- Can we see the unit-by-unit rent roll, current vacancy, and any below-market leases? What's the average tenancy length?
- What capital expenditures (roof, boiler, parking lot, exteriors) have been made in the last 5 years, and what's planned in the next 2?
- Built in 1968 — when were the roof, HVAC, electrical panel, plumbing, and water heater last replaced?
- Why hasn't it sold? Are there any deal-killer items the seller is aware of (foundation, flood, title, zoning, code violations)?
- Is there a deadline driving the sale (1031 exchange, divorce, estate, relocation)? That informs how much negotiation room exists.
- What's the average days-on-market for RENTAL listings here right now (not sales)? A rising rental-DOM trend means longer vacancies and softer asking-rent achievability than the comps imply.
- What's the recent tenant-quality profile in this submarket — average credit score on applications, eviction rate, late-payment / NSF rate, and stable-employment percentage? A property-management company in the area should have these aggregated.
- How much new apartment / multifamily construction is in the pipeline within 1–3 miles? Heavy new supply (>2% of stock underway) typically softens rents 12–24 months out; light construction supports rent growth.
Investment metrics
- 1% rule
- 1.00% ✓
- Cap rate
- 8.10%
- Cash-on-cash
- 6.47%
- DSCR
- 1.29
- GRM
- 8.3
CMA / ARV
- ARV (median comp)
- $540,000
- List price
- $499,000
- Delta
- -7.59%
- Verdict
- FAIR
- Comps
- 9 within 1.0 mi
Projected returns pro-forma
-3.0% appreciation · 0.57% rent growth · sell at horizon
- IRR
- -9.0%
- Equity multiple
- 0.68×
- Total profit
- $-44,941
- Equity at exit
- $74,403
- IRR
- -2.9%
- Equity multiple
- 0.83×
- Total profit
- $-24,421
- Equity at exit
- $43,144
Cash invested: $139,720 (down + closing). Projections, not guarantees.
Landlord ↔ Tenant lean methodology
- Overall (STATE)
- 28 Tenant-Leaning
- State Washington
- 28 Tenant-Leaning · D+8
- County
- — inherits STATE
- City
- — inherits STATE
ZIP-level market 98926
- Rents YoY
- 0.6%
- Active inventory
- 302
- Price-to-rent
- 31.1×
Monthly cashflow live
- Estimated rent
- $5,008 high interval (Pro) →
- Mortgage (P&I)
- −$2,617
- Tax from tax record
- −$379 /mo · $4,545/yr
- Insurance
- −$208
- HOA
- −$0
- Vacancy / Maint / Mgmt
- −$1,052
- Net cashflow
- $753
Break-even live
4-unit breakdown (identical units grouped — click to expand)
| Units | Beds | Baths | Est. rent |
|---|---|---|---|
| 2× units | 2 | 1 | $2,672 |
| #1 | 2 | 1 | $1,336 |
| #2 | 2 | 1 | $1,336 |
| 2× units | 1 | 1 | $2,334 |
| #3 | 1 | 1 | $1,167 |
| #4 | 1 | 1 | $1,167 |
| Total (4 units) | $5,008 | ||
UW: 25.0% down · 7.5% · 30yr · 1.5% tax · 5.0% vac · 8.0% maint · 8.0% mgmt
Financing live
Cash to close
- Down payment
- $124,750
- Closing costs
- $14,970
- Reserves months
- —
- Total cash needed
- —
Loan-product check · same deal, 3 products live
Conventional
25% down · 7.5% · 30yr
- Down + closing
- —
- Monthly P&I
- —
- Monthly cashflow
- —
- DSCR
- —
- Eligible?
- —
Personal DTI + credit; lowest rate.
DSCR
20% down · 8.5% · 30yr
- Down + closing
- —
- Monthly P&I
- —
- Monthly cashflow
- —
- DSCR
- —
- Eligible?
- —
No personal income docs; deal must DSCR.
Hard money
10% down · 12.0% · 12mo
- Down + closing
- —
- Monthly P&I
- —
- Monthly cashflow
- —
- DSCR
- —
- Eligible?
- —
Short-term bridge; refi at stabilization.
Listing history 20 events
-
2026-06-19days on market $499,000 Active 196 DOM
-
2026-06-18days on market $499,000 Active 195 DOM
-
2026-06-17days on market $499,000 Active 194 DOM
-
2026-06-16days on market $499,000 Active 193 DOM
-
2026-06-15days on market $499,000 Active 192 DOM
-
2026-06-14days on market $499,000 Active 190 DOM
-
2026-06-13days on market $499,000 Active 189 DOM
-
2026-06-10days on market $499,000 Active 187 DOM
-
2026-06-09days on market $499,000 Active 186 DOM
-
2026-06-08days on market $499,000 Active 185 DOM
-
2026-06-07days on market $499,000 Active 184 DOM
-
2026-06-05days on market $499,000 Active 181 DOM
-
2026-06-03days on market $499,000 Active 180 DOM
-
2026-06-02days on market $499,000 Active 179 DOM
-
2026-06-01days on market $499,000 Active 178 DOM
-
2026-05-31days on market $499,000 Active 177 DOM
-
2026-05-30days on market $499,000 Active 176 DOM
-
2026-01-30price $499,000
-
2025-12-05$529,000 Active
-
1998-03-01soldstatus $143,500
ⓘ Source: listings_history table (triggers on properties + properties_extension) + one-shot
backfill from property_details.listing_events for pre-trigger history.
Tax reassessment forecast WA · Resets to sale price
- Current annual tax
- $4,545 · $379/mo
- Projected year-2 tax
- $4,890 · $408/mo
- Expected delta
- +$345/yr (+$29/mo · 7.6%)
ⓘ Screening estimate from a state-policy table — verify with the county assessor before closing.
Climate risk First Street
- Flood 1/10 Low FEMA zone X (unshaded) · 0% chance over 30 yrs
- Wildfire 6/10 Major
- Heat 3/10 Moderate 7 d/yr ≥94°F today · 14 d/yr by 30 yrs out
- Wind 1/10 Low
- Air quality 9/10 Extreme 16 unhealthy d/yr today · 17 by 30 yrs out
Nearby sold comps map
Loading sold comps map…
Walkable amenities ~0.75 mi
Loading nearby amenities…
Taxation est. · year 1
- Rental income
- $60,096
- − Mortgage interest
- −$27,952
- − Property taxes
- −$4,545
- − Insurance
- −$2,495
- − Repairs & maintenance
- −$4,808
- − Management
- −$4,808
- − Depreciation
- −$14,516
- Taxable income
- $972
- Est. tax owed @ 24.0%
- −$233
- After-tax cash flow
- $8,801/yr
For passive investors: Depreciation is non-cash, so a rental often shows a tax loss while cash-flowing — sheltering income. Rental losses are passive: they offset passive income freely, and up to $25,000/yr can offset ordinary (W-2) income if you actively participate and your MAGI is under $100k (phasing out to $0 by $150k); unused losses carry forward. On sale, claimed depreciation is recaptured at up to 25%, and gains may owe capital-gains tax (a 1031 exchange can defer both). Figures are a year-1 estimate at your 24.0% rate — not tax advice; consult a CPA.
Schools (NCES district)
- District
- Ellensburg School District
- NCES district ID
- 5302460
- Math proficiency
- 47% ▲ 1.00%
- Reading proficiency
- 55% ▲ 2.00%
- Median HH income
- $39,944
- Composite
- 44.61/100
- National rank
- #6026
- State rank
- #148 of 291 in WA
Livability — Ellensburg
- Score
- 82/100
- State rank
- #64
- US rank
- #1157
Category grades
Schools grade is shown separately in the Schools card above.
Census & demographics
- Census place
- Ellensburg, WA
- County
- Kittitas County · 34,353 people
- City population
- 34,353
- Metro
- Ellensburg, WA
- Population (ZIP)
- 34,353
- Household income
- $71,137
- Rent vs Own
- Severe rent burden
- 2076.0
Population outlook (Kittitas County) Hauer SSP2
- Today (2025)
- 48,605 people
- By 2030
- 51,628 · +6.2%
- By 2040
- 57,361 · +18.0%
- By 2050
- 63,241 · +30.1%
- By 2075
- 79,310 · +63.2%
- By 2100
- 94,769 · +95.0%
Race, ethnicity, and origin ACS 2023
- Neighborhood character
- Predominantly White (79%)
- Race & ethnicity
- White 79% Hispanic / Latino 11% Two or more races 9% Asian 2% Black 1%
- Hispanic origin (detail)
- Mexican 8%
- Common ancestry
- Italian 9% Portuguese 4% Slovak 3%
- Foreign-born
- 5% · Canada
- Languages at home
- 91% English-only · Spanish 6% Other Indo-European 1% German/W. Germanic 1%
Political lean MEDSL · Kittitas
- 2024 margin
- R (+14.6) · D 41.1% · R 55.7% · Other 3.2%
- 2008→2024 swing
- -6.5pp toward R · 2008: -8.1pp · 2024: -14.6pp
- All cycles
- 2024: R+14.6 2020: R+10.2 2016: R+14.5 2012: R+12.6 2008: R+8.1
Not yet ingested
- Civics
- —
Market trends
- HPI YoY
- ▼ -193.62%
- Current HPI
- 211.3198
- Rent YoY
- ▲ 0.57%
- Metro
- Ellensburg, WA
- State GDP YoY
- ▲ 4.65%
- F500 in state
- 22
Industry mix (Fortune 500 HQ in WA)
| Industry | F500 HQs | Revenue |
|---|---|---|
| Retail | 2 | $269B |
|
||
| Technology / Retail | 1 | $638B |
|
||
| Technology | 1 | $245B |
|
||
| Telecommunications | 1 | $38B |
|
||
| Food / Beverage | 1 | $36B |
|
||
| Automotive / Trucks | 1 | $34B |
|
||
Price history
+247.7% since first listed3 events — show timeline
- 2026-01-30 Price Changed $499,000 NWMLS as Distributed by MLS Grid
- 2025-12-05 Listed $529,000 NWMLS as Distributed by MLS Grid
- 1998-03-01 Sold (Public Records) $143,500 Public Records
Property tax history
+6.0%/yrLatest (2026): $4,545 · +6.2% YoY. Source: county tax records.
Cash-flow waterfall
monthlySold comps — $/sqft
last 12 mo · ≤1 miLoading sold comps…