 🔨 Auction
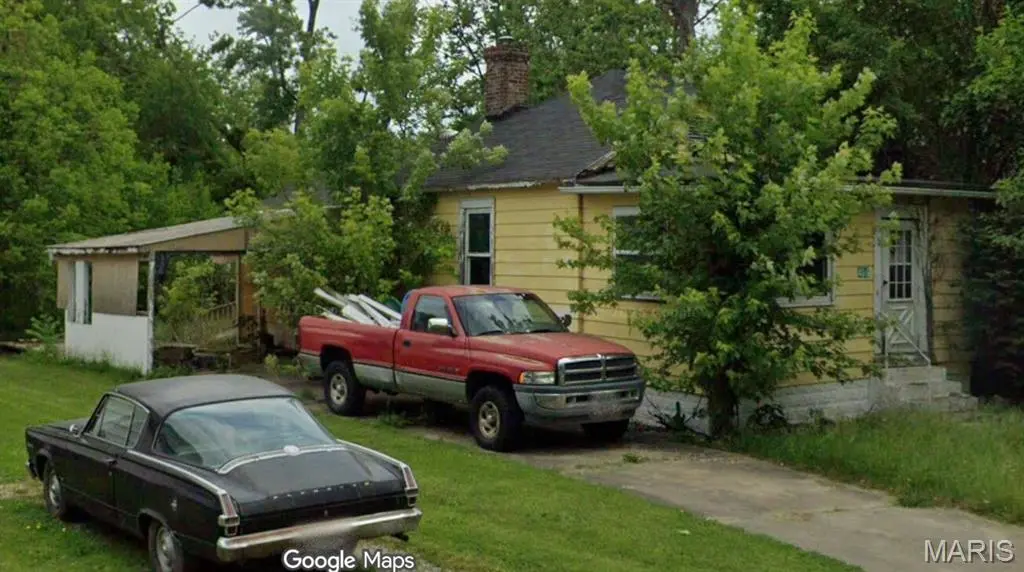
406 W Lake St · Pana, IL
Flood risk 1/10 · Minimal
- FEMA flood zone
- X (unshaded)
- Chance of flooding over 30 yrs
- 0.0%
- Est. flood insurance / yr
- $473 – $860
Fire risk 1/10 · Minimal
- Est. fire insurance / yr
- $804 – $1,492
Heat risk 4/10 · Minor
- Hot days now (above 105°F)
- 7 days/yr
- Hot days in 30 yrs
- 20 days/yr
Wind risk 2/10 · Minimal
- Chance of severe wind over 30 yrs
- 2.0%
Air-quality risk 2/10 · Minimal
- Unhealthy air days now
- 1 days/yr
- Unhealthy air days in 30 yrs
- 2 days/yr
Risk factors via First Street. Map © Google.
Why this score? — see what drove the D- grade
The composite is a weighted blend of 9 inputs, each scored 0–100. Each bar is that input's sub-score; the figure is the points it added to the 100-point composite (weight × sub-score).
- Cash flow +12.2/30.0
- ARV discount +7.5/15.0
- DSCR +3.6/10.0
- 1% rule +3.5/10.0
- Livability +3.2/5.0
- Rent growth +2.5/5.0
- Condition / age +2.5/5.0
- Schools +2.1/10.0
- Appreciation +0.0/10.0
$10,500
🖨 Deal sheet (PDF) 📄 Offer letter ✓ Due diligence
Listing remarks MLS
This Property will be auctioned on Auction.com - please go to the website, register an account and submit your offer(s). Listed for $10,500. PANA FULL BASEMENT VALUE! Estimated as a 2BR/1BA bungalow with 916 above grade sq ft PLUS 916 sq ft full basement & 1 car garage! Full basement adds significant square footage and utility despite compact 916 sq ft main level. Full basement differentiates property and supports premium vs. slab homes. Target buyers: Central Illinois investors familiar with smaller city markets, rental portfolio builders, contractors, budget flippers seeking manageable total investment. Pana offers affordability and stability! Exterior showing (curb viewing) only. NO inside showings available, no more inside pictures available. No contingencies will be accepted. Cash sale only. Sold "where is and as is" No Survey or Keys Provided. Interior Access for Home Inspections Will Not Be Granted. Listing Information May Not Be Accurate. Buyers Must Do Their Own Due Diligence to Verify Number of Beds, Baths, Square Footage, Room Sizes, Lot Size & Any Other Property Details. Photos, Marketing Comments, and Due Diligence Items are Provided for Guidance Purposes Only. By Making an Offer on This Property, the Buyer Represents They Have Independently Verified All Information and Have Made the Decision to Make an Offer Based Upon Their Own Investigation.
Key facts
- 7,575 sq ft lot
- Garage
- Built 1900
Neighborhood map
What this means for you Summary
Snapshot
- This is a 2-bed/2.0-bath single-family listed at $10k.
Deal economics
- At list price, monthly cash flow is $-22 ($-265/yr) — negative.
- The deal already cash-flows at list — no discount required.
- Meets the 1% rule at list price ($899 rent vs $10k).
- Recommended offer: $9k (12.0% below list) — sets the bar for market timing.
Location & tenants
- Location reads 65/100 on livability (#599 in IL) — a middle-class / working-renter tenant base. Strengths: crime A+, cost of living A+, housing A+; Watch: amenities F, commute F, health & safety F.
- Pana CUSD 8 (town): math 20% / reading 29% proficiency, ranked #360 of 620 in IL (top 58%) — low school quality limits family demand, transient renter base, plan for 1-2y turnover.
- Zoned schools: Washington Elem School (299 students, 0% FRL); Pana Jr High School (math 13% / reading 28%, grade F, #410 of 665 statewide, top 62%, 264 students, 0% FRL); Pana Sr High School (math 17% / reading 22%, grade F, #397 of 693 statewide, top 61%, 392 students, 0% FRL) — zoned schools average 0% FRL vs 54% district-wide (54 pts lower); this property's tenant base skews higher-income than the district average.
- Market conditions: 67 active listings in the ZIP; 26 units permitted in Christian County in 2024 (0 in 5+ unit buildings).
Forward outlook
- Local home prices are declining (-3.0%/yr); year-one equity from $732 of loan paydown is wiped out by about $3k of value loss. Plan a longer hold.
- Christian County population projected at -24% by 2050 — secular population decline; favor cash flow + early exit over multi-decade hold.
Negotiation context
- It's been on market 121 days — a 12% lower offer ($9k) is reasonable based on typical stale-listing flexibility.
Risks & watch-outs
- Watch-outs: property tax is 15.1% of price; built in 1900 — expect roof / HVAC / electrical / plumbing capex.
Questions for the listing agent
- What do current leases actually rent for vs. the listed asking? Can we see a recent rent roll and the last 12 months of T-12 income?
- It's been on market 121 days. Have you received any prior offers? Is the seller open to a 12% concession, seller financing, or rate buy-down credit?
- Built in 1900 — when were the roof, HVAC, electrical panel, plumbing, and water heater last replaced?
- Property tax is high relative to price — has the assessment been appealed recently, and will the sale trigger a re-assessment?
- Why hasn't it sold? Are there any deal-killer items the seller is aware of (foundation, flood, title, zoning, code violations)?
- Is there a deadline driving the sale (1031 exchange, divorce, estate, relocation)? That informs how much negotiation room exists.
- Schools are F-rated, which usually means shorter tenancies and higher turnover. Who's the typical renter profile here, and what's been the actual vacancy rate?
- The area grade is low — what's the realistic commute time and amenity access for the typical tenant pool here? Any planned neighborhood developments (good or bad) we should know about?
- What's the average days-on-market for RENTAL listings here right now (not sales)? A rising rental-DOM trend means longer vacancies and softer asking-rent achievability than the comps imply.
- What's the recent tenant-quality profile in this submarket — average credit score on applications, eviction rate, late-payment / NSF rate, and stable-employment percentage? A property-management company in the area should have these aggregated.
- How much new for-sale + rental construction is in the pipeline within 1–3 miles? Heavy new supply typically softens prices + rents 12–24 months out; constrained supply supports both.
Investment metrics
- 1% rule
- 0.85% ✗
- Cap rate
- 6.04%
- Cash-on-cash
- -0.89%
- DSCR
- 0.96
- GRM
- 9.8
CMA / ARV
- ARV (median comp)
- $105,977
- List price
- $10,500
- Delta
- -90.09%
- Verdict
- UNDERPRICED
- Comps
- 20 within 1.0 mi
Show comp detail 9 sales within ~0.75 mi
| Address | Dist | Beds/Ba | Sqft | Sold | Price | $/sf | Match |
|---|---|---|---|---|---|---|---|
| 408 N Sheridan St | 0.09mi | 2/1.0 | 824 (-10%) | 19mo | $29,500 | $36 | 60 |
| 401 W Orange St | 0.20mi | 3/1.0 (+1) | 870 (-5%) | 17mo | $45,000 | $52 | 59 |
| 6 Dewitt St | 0.37mi | 2/1.0 | 840 (-8%) | 12mo | $15,000 | $18 | 55 |
| 602 W 2nd St | 0.44mi | 2/1.0 | 884 (-4%) | 23mo | $56,500 | $64 | 50 |
| 402 W 2nd St | 0.42mi | 2/1.0 | 1,008 (+10%) | 15mo | $35,000 | $35 | 47 |
| 304 N Poplar St | 0.62mi | 2/1.0 | 864 (-6%) | 19mo | $95,000 | $110 | 42 |
| 106 W Washington St | 0.35mi | 2/1.0 | 780 (-15%) | 19mo | $12,000 | $15 | 39 |
| 400 S Clark St | 0.73mi | 3/1.0 (+1) | 1,020 (+11%) | 14mo | $36,000 | $35 | 27 |
| 204 Wells St | 0.57mi | 3/1.0 (+1) | 1,020 (+11%) | 24mo | $93,000 | $91 | 26 |
Match score weights: distance 35% · size 25% · config 20% · recency 20%. Top-matched comps best support the ARV.
Projected returns pro-forma
-3.0% appreciation · 3.0% rent growth · sell at horizon
- IRR
- -17.8%
- Equity multiple
- 0.37×
- Total profit
- $-18,563
- Equity at exit
- $15,801
- IRR
- -9.9%
- Equity multiple
- 0.40×
- Total profit
- $-17,917
- Equity at exit
- $9,163
Cash invested: $29,673 (down + closing). Projections, not guarantees.
Landlord ↔ Tenant lean methodology
- Overall (STATE)
- 43 Moderately Tenant-Leaning
- State Illinois
- 43 Moderately Tenant-Leaning · D+7
- County
- — inherits STATE
- City
- — inherits STATE
ZIP-level market 62557
- Home prices YoY
- -18.5%
- Active inventory
- 67
- Price-to-rent
- 1.0×
Monthly cashflow live
- Estimated rent
- $899 medium interval (Pro) →
- Mortgage (P&I)
- −$556
- Tax est. 1.5%
- −$132 /mo · $1,590/yr
- Insurance
- −$44
- HOA
- −$0
- Lot rent
- −$0
- Vacancy / Maint / Mgmt
- −$189
- Net cashflow
- $-22
Break-even live
Sensitivity live
| Price | -10% $51 | -5% $15 | +0% $-22 | +5% $-59 | +10% $-95 |
|---|---|---|---|---|---|
| Rent | -10% $-93 | -5% $-58 | +0% $-22 | +5% $13 | +10% $49 |
| Rate | -1.0pp $31 | -0.5pp $5 | base $-22 | +0.5pp $-50 | +1.0pp $-77 |
UW: 25.0% down · 7.5% · 30yr · 1.5% tax · 5.0% vac · 8.0% maint · 8.0% mgmt
Financing live
Cash to close
- Down payment
- $26,494
- Closing costs
- $3,179
- Reserves months
- —
- Total cash needed
- —
Loan-product check · same deal, 3 products live
Conventional
25% down · 7.5% · 30yr
- Down + closing
- —
- Monthly P&I
- —
- Monthly cashflow
- —
- DSCR
- —
- Eligible?
- —
Personal DTI + credit; lowest rate.
DSCR
20% down · 8.5% · 30yr
- Down + closing
- —
- Monthly P&I
- —
- Monthly cashflow
- —
- DSCR
- —
- Eligible?
- —
No personal income docs; deal must DSCR.
Hard money
10% down · 12.0% · 12mo
- Down + closing
- —
- Monthly P&I
- —
- Monthly cashflow
- —
- DSCR
- —
- Eligible?
- —
Short-term bridge; refi at stabilization.
Listing history 7 events
-
2026-06-03days on market $10,500 Active 121 DOM
-
2026-06-02days on market $10,500 Active 120 DOM
-
2026-06-01days on market $10,500 Active 119 DOM
-
2026-05-31days on market $10,500 Active 118 DOM
-
2026-05-30days on market $10,500 Active 117 DOM
-
2026-02-02$10,500 Active 1397-char remark
Show marketing remark (1397 chars)
This Property will be auctioned on Auction.com - please go to the website, register an account and submit your offer(s). Listed for $10,500. PANA FULL BASEMENT VALUE! Estimated as a 2BR/1BA bungalow with 916 above grade sq ft PLUS 916 sq ft full basement & 1 car garage! Full basement adds significant square footage and utility despite compact 916 sq ft main level. Full basement differentiates property and supports premium vs. slab homes. Target buyers: Central Illinois investors familiar with smaller city markets, rental portfolio builders, contractors, budget flippers seeking manageable total investment. Pana offers affordability and stability! Exterior showing (curb viewing) only. NO inside showings available, no more inside pictures available. No contingencies will be accepted. Cash sale only. Sold "where is and as is" No Survey or Keys Provided. Interior Access for Home Inspections Will Not Be Granted. Listing Information May Not Be Accurate. Buyers Must Do Their Own Due Diligence to Verify Number of Beds, Baths, Square Footage, Room Sizes, Lot Size & Any Other Property Details. Photos, Marketing Comments, and Due Diligence Items are Provided for Guidance Purposes Only. By Making an Offer on This Property, the Buyer Represents They Have Independently Verified All Information and Have Made the Decision to Make an Offer Based Upon Their Own Investigation.
-
2016-09-14historical
ⓘ Source: listings_history table (triggers on properties + properties_extension) + one-shot
backfill from property_details.listing_events for pre-trigger history.
Climate risk First Street
- Flood 1/10 Low FEMA zone X (unshaded) · 0% chance over 30 yrs
- Wildfire 1/10 Low
- Heat 4/10 Moderate 7 d/yr ≥105°F today · 20 d/yr by 30 yrs out
- Wind 2/10 Low 2% chance of damaging wind over 30 yrs
- Air quality 2/10 Low 1 unhealthy d/yr today · 2 by 30 yrs out
Nearby sold comps map
Loading sold comps map…
Walkable amenities ~0.75 mi
Loading nearby amenities…
Taxation est. · year 1
- Rental income
- $10,790
- − Mortgage interest
- −$5,936
- − Property taxes
- −$1,590
- − Insurance
- −$530
- − Repairs & maintenance
- −$863
- − Management
- −$863
- − Depreciation
- −$3,083
- Taxable loss
- −$2,075
- Est. tax savings @ 24.0%
- +$498
- After-tax cash flow
- $234/yr
For passive investors: Depreciation is non-cash, so a rental often shows a tax loss while cash-flowing — sheltering income. Rental losses are passive: they offset passive income freely, and up to $25,000/yr can offset ordinary (W-2) income if you actively participate and your MAGI is under $100k (phasing out to $0 by $150k); unused losses carry forward. On sale, claimed depreciation is recaptured at up to 25%, and gains may owe capital-gains tax (a 1031 exchange can defer both). Figures are a year-1 estimate at your 24.0% rate — not tax advice; consult a CPA.
Schools (NCES district)
- District
- Pana CUSD 8
- NCES district ID
- 1730630
- Math proficiency
- 20% ▼ -4.00%
- Reading proficiency
- 29% ▼ -7.00%
- Median HH income
- $42,385
- Composite
- 20.88/100
- National rank
- #8493
- State rank
- #360 of 620 in IL
Livability — Pana
- Score
- 65/100
- State rank
- #599
- US rank
- #12409
Category grades
Schools grade is shown separately in the Schools card above.
Census & demographics
- Census place
- Pana, IL
- Population (ZIP)
- 6,859
Population outlook (Christian County) Hauer SSP2
- Today (2025)
- 31,182 people
- By 2030
- 29,787 · -4.5%
- By 2040
- 26,793 · -14.1%
- By 2050
- 23,757 · -23.8%
- By 2075
- 17,333 · -44.4%
- By 2100
- 11,573 · -62.9%
Race, ethnicity, and origin ACS 2023
- Neighborhood character
- Predominantly White (91%)
- Race & ethnicity
- White 91% Hispanic / Latino 5% Two or more races 3% Black 1%
- Common ancestry
- Lithuanian 4% Slovak 3% Romanian 3%
- Foreign-born
- 1% · Canada
Political lean MEDSL · Christian
- 2024 margin
- Solid R (+46.7) · D 25.9% · R 72.6% · Other 1.5%
- 2008→2024 swing
- -40.4pp toward R · 2008: -6.3pp · 2024: -46.7pp
- All cycles
- 2024: R+46.7 2020: R+44.6 2016: R+42.7 2012: R+23.1 2008: R+6.3
Not yet ingested
- Civics
- —
Market trends
- HPI YoY
- ▼ -30.82%
- Current HPI
- 135.6938
- Rent YoY
- —
- Metro
- —
- State GDP YoY
- ▲ 1.59%
- F500 in state
- 60
Industry mix (Fortune 500 HQ in IL)
| Industry | F500 HQs | Revenue |
|---|---|---|
| Insurance | 4 | $201B |
|
||
| Consumer Goods | 4 | $87B |
|
||
| Industrial Machinery | 3 | $64B |
|
||
| Healthcare | 2 | $55B |
|
||
| Retail / Pharmacy | 1 | $148B |
|
||
| Agriculture / Food | 1 | $86B |
|
||
Price history
2 events — show timeline
- 2026-02-02 Listed $10,500 MARIS as Distributed by MLS Grid
- 2016-09-14 Listing Removed — MRED as Distributed by MLS Grid
Property tax history
+1.4%/yrLatest (2023): $657 · -24.6% YoY. Source: county tax records.
Cash-flow waterfall
monthlySold comps — $/sqft
last 12 mo · ≤1 miLoading sold comps…