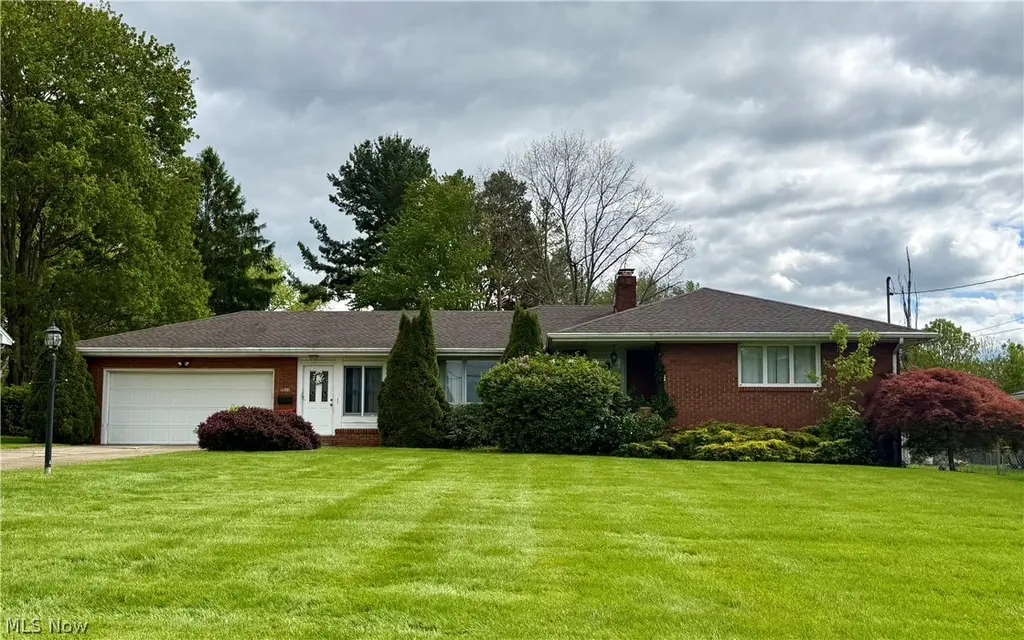
2825 Saginaw Dr · Poland, OH
Flood risk 1/10 · Minimal
- FEMA flood zone
- X (unshaded)
- Chance of flooding over 30 yrs
- 0.0%
- Est. flood insurance / yr
- $473 – $860
Fire risk 1/10 · Minimal
- Est. fire insurance / yr
- $713 – $1,323
Heat risk 3/10 · Minor
- Hot days now (above 95°F)
- 7 days/yr
- Hot days in 30 yrs
- 17 days/yr
Wind risk 1/10 · Minimal
- Chance of severe wind over 30 yrs
- —
Air-quality risk 2/10 · Minimal
- Unhealthy air days now
- 1 days/yr
- Unhealthy air days in 30 yrs
- 3 days/yr
Risk factors via First Street. Map © Google.
Why this score? — see what drove the C grade
The composite is a weighted blend of 9 inputs, each scored 0–100. Each bar is that input's sub-score; the figure is the points it added to the 100-point composite (weight × sub-score).
- Cash flow +17.4/30.0
- ARV discount +15.0/15.0
- Schools +6.4/10.0
- DSCR +5.4/10.0
- 1% rule +4.5/10.0
- Livability +4.1/5.0
- Rent growth +2.5/5.0
- Condition / age +2.5/5.0
- Appreciation +0.0/10.0
$220,000
🖨 Deal sheet 📄 Offer letter ✓ Due diligence
Listing remarks
Probate Sale
Key facts
- 0.46 acre lot
- 2 garage spots
- Built 1959
Neighborhood map
What this means for you Summary
Snapshot
- This is a 3-bed/1.5-bath single-family listed at $220k.
Deal economics
- At list price, monthly cash flow is $166 ($2k/yr) — positive.
- The deal already cash-flows at list — no discount required.
- To meet the 1% rule (rent ≥ 1% of price), the offer needs to be $208k (5.3% below list).
- Recommended offer: $208k (5.3% below list) — sets the bar for 1% rule.
- Cap rate 7.2% vs local median 3.4% in Poland — top-decile yield for the area; either an underpriced asset or a hidden risk that comps aren't pricing in. Stress-test before assuming the spread holds.
Location & tenants
- Location reads 82/100 on livability (#72 in OH, #1,108 nationally) — a professional / high-income tenant draw. Strengths: schools A+, crime A+, cost of living A+; Watch: amenities F, commute F.
- Poland Local (suburban): math 70% / reading 78% proficiency, ranked #94 of 656 in OH (top 14%) — strong family-tenant draw, lease renewals of 3-5y typical; only 12% free/reduced lunch — higher-income household profile.
- Market conditions: 155 active listings in the ZIP; 2 comparable units currently listed for rent nearby; solid renter incomes; 147 units permitted in Mahoning County in 2024 (0 in 5+ unit buildings).
- This rent runs 31% of the median local income ($80k/yr) — at the standard rent-burdened threshold; future hikes will face affordability resistance.
Forward outlook
- Local home prices are declining (-3.0%/yr); year-one equity from $2k of loan paydown is wiped out by about $7k of value loss. Plan a longer hold.
- Mahoning County population projected at -14% by 2050 — secular population decline; favor cash flow + early exit over multi-decade hold.
Negotiation context
- Only 1 days on market — expect competitive offers; lowballing is unlikely to land.
Risks & watch-outs
- Watch-outs: built in 1959 — expect roof / HVAC / electrical / plumbing capex.
Questions for the listing agent
- Built in 1959 — when were the roof, HVAC, electrical panel, plumbing, and water heater last replaced?
- Is there a deadline driving the sale (1031 exchange, divorce, estate, relocation)? That informs how much negotiation room exists.
- Schools are A-rated — typically a magnet for longer-tenancy family renters. What's the average tenant stay here, and is there a school-zone premium baked into asking?
- What's the average days-on-market for RENTAL listings here right now (not sales)? A rising rental-DOM trend means longer vacancies and softer asking-rent achievability than the comps imply.
- What's the recent tenant-quality profile in this submarket — average credit score on applications, eviction rate, late-payment / NSF rate, and stable-employment percentage? A property-management company in the area should have these aggregated.
- How much new for-sale + rental construction is in the pipeline within 1–3 miles? Heavy new supply typically softens prices + rents 12–24 months out; constrained supply supports both.
Investment metrics
- 1% rule
- 0.95% ✗
- Cap rate
- 7.20%
- Cash-on-cash
- 3.24%
- DSCR
- 1.14
- GRM
- 8.8
CMA / ARV
- ARV (on-the-fly)
- $281,445
- Comps found
- 12
Show comp detail 12 sales within ~0.75 mi
| Address | Dist | Beds/Ba | Sqft | Sold | Price | $/sf | Match |
|---|---|---|---|---|---|---|---|
| 2959 Holyoke Dr | 0.25mi | 3/2.5 | 1,965 (+1%) | 6mo | $284,500 | $145 | 77 |
| 6534 Diana Dr | 0.26mi | 3/3.0 | 1,888 (-3%) | 3mo | $282,000 | $149 | 75 |
| 2949 Algonquin Dr | 0.35mi | 3/2.5 | 1,942 (+0%) | 8mo | $239,000 | $123 | 72 |
| 2721 Algonquin Dr | 0.27mi | 4/2.5 (+1) | 1,878 (-3%) | 7mo | $289,900 | $154 | 67 |
| 3151 Heatherbrae Dr | 0.39mi | 3/1.5 | 1,720 (-11%) | 4mo | $277,400 | $161 | 59 |
| 2979 Saginaw Dr | 0.18mi | 4/2.0 (+1) | 2,184 (+12%) | 10mo | $305,000 | $140 | 56 |
| 2838 Coblentz Dr | 0.48mi | 3/1.5 | 1,686 (-13%) | 8mo | $240,000 | $142 | 48 |
| 3064 Howell Dr | 0.74mi | 3/2.0 | 1,793 (-8%) | 7mo | $210,000 | $117 | 45 |
| 8 Centennial Dr | 0.62mi | 3/2.0 | 2,188 (+13%) | 8mo | $342,500 | $157 | 41 |
| 25 Water St | 0.73mi | 4/1.5 (+1) | 2,096 (+8%) | 9mo | $225,000 | $107 | 40 |
| 6845 Katahdin Dr | 0.60mi | 3/2.5 | 2,217 (+14%) | 7mo | $355,000 | $160 | 39 |
| 2407 Clyde St | 0.65mi | 4/1.0 (+1) | 1,728 (-11%) | 10mo | $207,000 | $120 | 36 |
Match score weights: distance 35% · size 25% · config 20% · recency 20%. Top-matched comps best support the ARV.
Projected returns pro-forma
-3.0% appreciation · 3.0% rent growth · sell at horizon
- IRR
- -11.2%
- Equity multiple
- 0.59×
- Total profit
- $-25,061
- Equity at exit
- $32,803
- IRR
- -2.0%
- Equity multiple
- 0.87×
- Total profit
- $-8,170
- Equity at exit
- $19,022
Cash invested: $61,600 (down + closing). Projections, not guarantees.
Landlord ↔ Tenant lean methodology
- Overall (STATE)
- 73 Landlord-Friendly
- State Ohio
- 73 Landlord-Friendly · R+6
- County
- — inherits STATE
- City
- — inherits STATE
ZIP-level market 44514
- Home prices YoY
- -23.8%
- Active inventory
- 155
- Price-to-rent
- 8.8×
Monthly cashflow live
- Estimated rent
- $2,083 medium interval (Pro) →
- Mortgage (P&I)
- −$1,154
- Tax from tax record
- −$234 /mo · $2,808/yr
- Insurance
- −$92
- HOA
- −$0
- Vacancy / Maint / Mgmt
- −$437
- Net cashflow
- $166
Break-even live
UW: 25.0% down · 7.5% · 30yr · 1.5% tax · 5.0% vac · 8.0% maint · 8.0% mgmt
Financing live
Cash to close
- Down payment
- $55,000
- Closing costs
- $6,600
- Reserves months
- —
- Total cash needed
- —
Loan-product check · same deal, 3 products live
Conventional
25% down · 7.5% · 30yr
- Down + closing
- —
- Monthly P&I
- —
- Monthly cashflow
- —
- DSCR
- —
- Eligible?
- —
Personal DTI + credit; lowest rate.
DSCR
20% down · 8.5% · 30yr
- Down + closing
- —
- Monthly P&I
- —
- Monthly cashflow
- —
- DSCR
- —
- Eligible?
- —
No personal income docs; deal must DSCR.
Hard money
10% down · 12.0% · 12mo
- Down + closing
- —
- Monthly P&I
- —
- Monthly cashflow
- —
- DSCR
- —
- Eligible?
- —
Short-term bridge; refi at stabilization.
Rent comps 2 comps
| Address | Beds | Baths | Sqft | Rent | $/sqft | DOM | Units | Dist |
|---|---|---|---|---|---|---|---|---|
| 2670 Center Rd Youngstown, OH | 3.0 | 2.5 | 1722 | $2,500 | $1.45 | 21d | 1 | 0.16mi |
| 465 W Omar St Struthers, OH | 3.0 | 2.0 | 1544 | $1,800 | $1.17 | 13d | 1 | 1.44mi |
Listing history 2 events
-
2026-05-15status Pending
-
2026-05-12$220,000 Active
ⓘ Source: listings_history table (triggers on properties + properties_extension) + one-shot
backfill from property_details.listing_events for pre-trigger history.
Tax reassessment forecast OH · Partial reset (capped growth)
- Current annual tax
- $2,808 · $234/mo
- Projected year-2 tax
- $3,120 · $260/mo
- Expected delta
- +$312/yr (+$26/mo · 11.1%)
ⓘ Screening estimate from a state-policy table — verify with the county assessor before closing.
Climate risk First Street
- Flood 1/10 Low FEMA zone X (unshaded) · 0% chance over 30 yrs
- Wildfire 1/10 Low
- Heat 3/10 Moderate 7 d/yr ≥95°F today · 17 d/yr by 30 yrs out
- Wind 1/10 Low
- Air quality 2/10 Low 1 unhealthy d/yr today · 3 by 30 yrs out
Nearby sold comps map
Loading sold comps map…
Walkable amenities ~0.75 mi
Loading nearby amenities…
Taxation est. · year 1
- Rental income
- $24,995
- − Mortgage interest
- −$12,323
- − Property taxes
- −$2,808
- − Insurance
- −$1,100
- − Repairs & maintenance
- −$2,000
- − Management
- −$2,000
- − Depreciation
- −$6,400
- Taxable loss
- −$1,635
- Est. tax savings @ 24.0%
- +$392
- After-tax cash flow
- $2,386/yr
For passive investors: Depreciation is non-cash, so a rental often shows a tax loss while cash-flowing — sheltering income. Rental losses are passive: they offset passive income freely, and up to $25,000/yr can offset ordinary (W-2) income if you actively participate and your MAGI is under $100k (phasing out to $0 by $150k); unused losses carry forward. On sale, claimed depreciation is recaptured at up to 25%, and gains may owe capital-gains tax (a 1031 exchange can defer both). Figures are a year-1 estimate at your 24.0% rate — not tax advice; consult a CPA.
Schools (NCES district)
- District
- Poland Local
- NCES district ID
- 3904834
- Math proficiency
- 70% ▼ -14.00%
- Reading proficiency
- 78% ▼ -4.00%
- Median HH income
- $66,236
- Composite
- 64.21/100
- National rank
- #564
- State rank
- #94 of 656 in OH
Livability — Poland
- Score
- 82/100
- State rank
- #72
- US rank
- #1108
Category grades
Schools grade is shown separately in the Schools card above.
Census & demographics
- County
- Mahoning County · 84,956 people
- City population
- 23,917
- Metro
- Youngstown-Warren-Boardman, OH-PA
- Population (ZIP)
- 23,917
- Household income
- $79,808
- Rent vs Own
- Severe rent burden
- 411.0
Population outlook (Mahoning County) Hauer SSP2
- Today (2025)
- 223,932 people
- By 2030
- 218,387 · -2.5%
- By 2040
- 205,367 · -8.3%
- By 2050
- 193,606 · -13.5%
- By 2075
- 173,694 · -22.4%
- By 2100
- 151,147 · -32.5%
Race, ethnicity, and origin ACS 2023
- Neighborhood character
- Predominantly White (91%)
- Race & ethnicity
- White 91% Two or more races 4% Hispanic / Latino 3% Black 2%
- Common ancestry
- Romanian 6% Slovak 2% Lithuanian 2%
- Foreign-born
- 2% · Canada
- Languages at home
- 95% English-only · Other Indo-European 2% Spanish 2%
Political lean MEDSL · Mahoning
- 2024 margin
- Lean R (+9.4) · D 44.9% · R 54.4%
- 2008→2024 swing
- -36.1pp toward R · 2008: 26.6pp · 2024: -9.4pp
- All cycles
- 2024: R+9.4 2020: R+1.9 2016: D+3.0 2012: D+27.7 2008: D+26.6
Not yet ingested
- Civics
- —
Market trends
- HPI YoY
- ▼ -65.78%
- Current HPI
- 210.5511
- Rent YoY
- —
- Metro
- Youngstown-Warren-Boardman, OH-PA
- State GDP YoY
- ▲ 1.98%
- F500 in state
- 48
Industry mix (Fortune 500 HQ in OH)
| Industry | F500 HQs | Revenue |
|---|---|---|
| Insurance | 3 | $145B |
|
||
| Industrial Machinery | 3 | $49B |
|
||
| Financial Services | 3 | $24B |
|
||
| Consumer Goods | 2 | $93B |
|
||
| Aerospace / Defense | 2 | $47B |
|
||
| Utilities | 2 | $33B |
|
||
Price history
2 events — show timeline
- 2026-05-15 Pending — MLSNOW
- 2026-05-12 Listed $220,000 MLSNOW
Property tax history
+2.4%/yrLatest (2025): $2,808 · -3.4% YoY. Source: county tax records.
Cash-flow waterfall
monthlySold comps — $/sqft
last 12 mo · ≤1 miLoading sold comps…