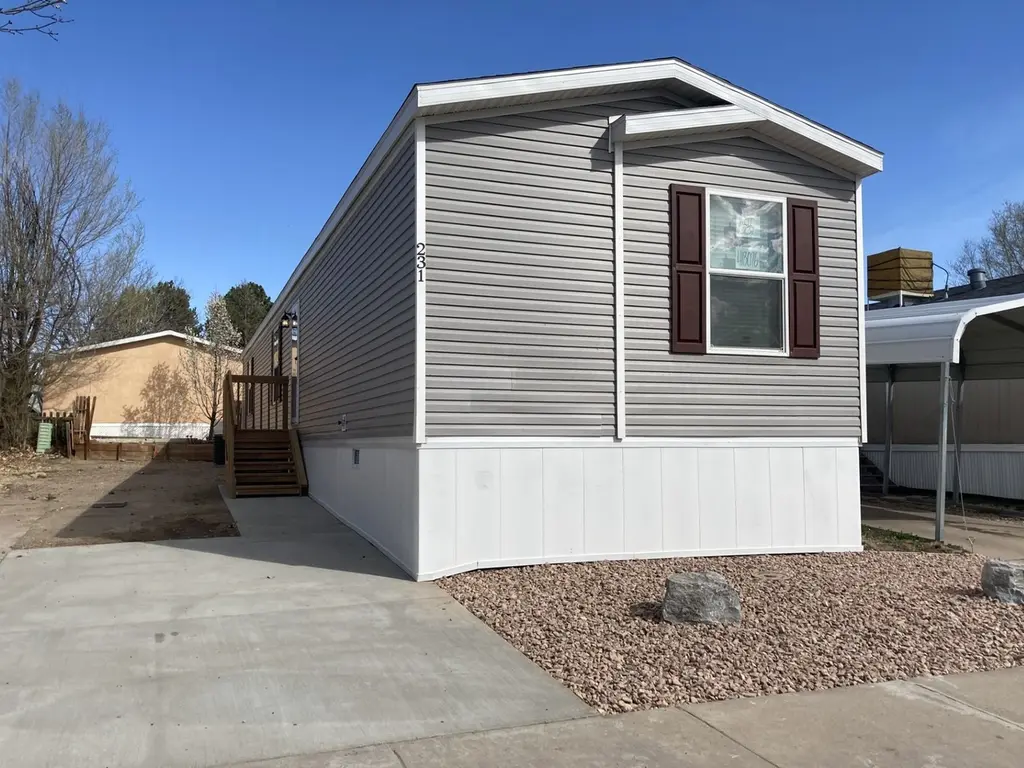
85 Sunflower Rd #231 · Colorado Springs, CO
Flood risk 1/10 · Minimal
- FEMA flood zone
- X (shaded)
- Chance of flooding over 30 yrs
- 0.0%
- Est. flood insurance / yr
- $507 – $1,088
Fire risk 6/10 · Moderate
- Est. fire insurance / yr
- $939 – $1,743
Heat risk 2/10 · Minimal
- Hot days now (above 89°F)
- 7 days/yr
- Hot days in 30 yrs
- 20 days/yr
Wind risk 2/10 · Minimal
- Chance of severe wind over 30 yrs
- —
Air-quality risk 2/10 · Minimal
- Unhealthy air days now
- 0 days/yr
- Unhealthy air days in 30 yrs
- 1 days/yr
Risk factors via First Street. Map © Google.
Why this score? — see what drove the B grade
The composite is a weighted blend of 9 inputs, each scored 0–100. Each bar is that input's sub-score; the figure is the points it added to the 100-point composite (weight × sub-score).
- Cash flow +30.0/30.0
- 1% rule +10.0/10.0
- DSCR +10.0/10.0
- ARV discount +7.5/15.0
- Condition / age +5.0/5.0
- Livability +3.9/5.0
- Rent growth +2.5/5.0
- Schools +2.5/10.0
- Appreciation +0.0/10.0
$80,900
🖨 Deal sheet (PDF) 📄 Offer letter ✓ Due diligence
Listing remarks
Your brand new 3 bedroom, 2 bathroom home is waiting for you to move in! This comfortable home features premium entry doors, a modern bathroom, as well as new brand name appliances. In the community, enjoy with your friends and family all the amenities we have to offer such as community events, a basketball court, and a picnic area / pavilion / grill. This home won't be on the market long, so call us today for more information or to schedule a tour. Deposits & Fees are subject to change.
Key facts
- Picnic area
- Basketball court
- Modern bathroom
Tags
Property features AI
Finance
- Other: Living area approximately 1,216 (as reported)
- Financial info: List price $80,400
Exterior
- Utilities: Natural gas; Central air
- Home design: Spec home; Plan 92135
Interior
- Bedrooms: 3 bedrooms
- Bathrooms: 2 full bathrooms
- Heating & cooling: Natural gas heating; Central air conditioning
- Interior features: 2 total bathrooms
Neighborhood map
What this means for you Summary
Snapshot
- This is a 3-bed/2.0-bath manufactured listed at $81k. Condition is rated excellent.
Deal economics
- At list price, monthly cash flow is $722 ($9k/yr) — positive.
- The deal already cash-flows at list — no discount required.
- Meets the 1% rule at list price ($2k rent vs $81k).
- Recommended offer: $76k (6.0% below list) — sets the bar for market timing.
- Cap rate 17.0% vs local median 3.3% in Colorado Springs — top-decile yield for the area; either an underpriced asset or a hidden risk that comps aren't pricing in. Stress-test before assuming the spread holds.
Location & tenants
- Location reads 78/100 on livability (#23 in CO, #2,639 nationally) — a middle-class / working-renter tenant base. Strengths: amenities A+, housing A+, health & safety A+; Watch: cost of living C-, crime F.
- Colorado Springs School District No. 11 In The County Of E (urban): math 20% / reading 37% proficiency, ranked #56 of 86 in CO (top 65%) — low school quality limits family demand, transient renter base, plan for 1-2y turnover.
- Zoned schools: Jackson Elementary School (math 15% / reading 27%, grade F, #673 of 966 statewide, top 71%, 342 students, 82% FRL); North Middle School (math 21% / reading 42%, grade F, #121 of 270 statewide, top 46%, 590 students, 63% FRL); Coronado High School (math 32% / reading 58%, grade D-, #139 of 381 statewide, top 36%, 1,305 students, 45% FRL).
- Market conditions: Rents flat; 192 active listings in the ZIP; 40 comparable units currently listed for rent nearby; rentals leasing fast (median 5d on market — plan ~1-2 weeks tenant-placement turnaround); 3,906 units permitted in El Paso County in 2024 (872 in 5+ unit buildings).
Forward outlook
- Local home prices are declining (-3.0%/yr); year-one equity from $559 of loan paydown is wiped out by about $2k of value loss. Plan a longer hold.
- El Paso County population projected at +28% by 2050 — long-run rental-demand tailwind backs the buy-and-hold thesis.
- At projected returns (-3.0% appreciation + 0.1% rent growth), your $23k cash investment doubles in ~4 years — after that, you're playing with house money.
Negotiation context
- It's been on market 84 days — a 6% lower offer ($76k) is reasonable based on typical stale-listing flexibility.
Risks & watch-outs
- Climate carrying-cost: major wildfire risk — expect insurance premiums to compound above CPI over the hold.
Questions for the listing agent
- It's been on market 84 days. Have you received any prior offers? Is the seller open to a 6% concession, seller financing, or rate buy-down credit?
- Why hasn't it sold? Are there any deal-killer items the seller is aware of (foundation, flood, title, zoning, code violations)?
- Is there a deadline driving the sale (1031 exchange, divorce, estate, relocation)? That informs how much negotiation room exists.
- Schools are B-rated — typically a magnet for longer-tenancy family renters. What's the average tenant stay here, and is there a school-zone premium baked into asking?
- Crime grade is F in this area — have there been break-ins, vandalism, or insurance claims at this property in the last 3 years? What carrier currently insures it and at what premium?
- What's the average days-on-market for RENTAL listings here right now (not sales)? A rising rental-DOM trend means longer vacancies and softer asking-rent achievability than the comps imply.
- What's the recent tenant-quality profile in this submarket — average credit score on applications, eviction rate, late-payment / NSF rate, and stable-employment percentage? A property-management company in the area should have these aggregated.
- How much new for-sale + rental construction is in the pipeline within 1–3 miles? Heavy new supply typically softens prices + rents 12–24 months out; constrained supply supports both.
Investment metrics
- 1% rule
- 2.00% ✓
- Cap rate
- 17.00%
- Cash-on-cash
- 38.23%
- DSCR
- 2.70
- GRM
- 4.2
CMA / ARV
No comps found within radius.
Projected returns pro-forma
-3.0% appreciation · 0.11% rent growth · sell at horizon
- IRR
- 31.0%
- Equity multiple
- 2.25×
- Total profit
- $28,293
- Equity at exit
- $12,062
- IRR
- 36.5%
- Equity multiple
- 3.92×
- Total profit
- $66,173
- Equity at exit
- $6,995
Cash invested: $22,652 (down + closing). Projections, not guarantees.
Landlord ↔ Tenant lean methodology
- Overall (STATE)
- 38 Tenant-Leaning
- State Colorado
- 38 Tenant-Leaning · D+4
- County
- — inherits STATE
- City
- — inherits STATE
ZIP-level market 80907
- Rents YoY
- 0.1%
- Active inventory
- 192
- Price-to-rent
- 4.2×
Monthly cashflow live
- Estimated rent
- $1,621 high interval (Pro) →
- Mortgage (P&I)
- −$424
- Tax est. 1.5%
- −$101 /mo · $1,214/yr
- Insurance
- −$34
- HOA
- −$0
- Vacancy / Maint / Mgmt
- −$340
- Net cashflow
- $722
Break-even live
Sensitivity live
| Price | -10% $778 | -5% $750 | +0% $722 | +5% $694 | +10% $666 |
|---|---|---|---|---|---|
| Rent | -10% $594 | -5% $658 | +0% $722 | +5% $786 | +10% $850 |
| Rate | -1.0pp $762 | -0.5pp $742 | base $722 | +0.5pp $701 | +1.0pp $679 |
UW: 25.0% down · 7.5% · 30yr · 1.5% tax · 5.0% vac · 8.0% maint · 8.0% mgmt
Financing live
Cash to close
- Down payment
- $20,225
- Closing costs
- $2,427
- Reserves months
- —
- Total cash needed
- —
Loan-product check · same deal, 3 products live
Conventional
25% down · 7.5% · 30yr
- Down + closing
- —
- Monthly P&I
- —
- Monthly cashflow
- —
- DSCR
- —
- Eligible?
- —
Personal DTI + credit; lowest rate.
DSCR
20% down · 8.5% · 30yr
- Down + closing
- —
- Monthly P&I
- —
- Monthly cashflow
- —
- DSCR
- —
- Eligible?
- —
No personal income docs; deal must DSCR.
Hard money
10% down · 12.0% · 12mo
- Down + closing
- —
- Monthly P&I
- —
- Monthly cashflow
- —
- DSCR
- —
- Eligible?
- —
Short-term bridge; refi at stabilization.
Rent comps 40 comps
| Address | Beds | Baths | Sqft | Rent | $/sqft | DOM | Units | Dist |
|---|---|---|---|---|---|---|---|---|
| 3405 Sinton Rd #105 Colorado Springs, CO | 3.0 | 2.0 | 1152 | $1,875 | $1.63 | 4d | 1 | 0.32mi |
| 3850 Schafer Hts Colorado Springs, CO | 1.0–2.0 | 1.0–2.0 | 752 | $1,524 | $2.03 | 4d | 5 | 0.38mi |
| 3125 Sinton Rd Colorado Springs, CO | 2.0 | 1.0 | 660 | $1,402 | $2.12 | 4d | 6 | 0.47mi |
| 3210 N Chestnut St Colorado Springs, CO | 2.0 | 1.0 | 597 | $1,233 | $2.06 | 4d | 8 | 0.56mi |
| 2925 Tremont St Colorado Springs, CO | 1.0–2.0 | 1.0 | 682 | $915 | $1.34 | 4d | 8 | 0.61mi |
| 4311 N Chestnut St Apt 1 Colorado Springs, CO | 2.0 | 1.0 | 850 | $925 | $1.09 | 25d | 1 | 0.65mi |
| 2822 N Cascade Ave Unit 2824 Colorado Springs, CO | 2.0 | 2.0 | 1032 | $1,995 | $1.93 | 15d | 1 | 0.74mi |
| 2922 Straus Ln Colorado Springs, CO | 2.0 | 1.0 | 750 | $1,150 | $1.53 | 4d | 1 | 0.84mi |
| 2613 Concord St Apt 104 Colorado Springs, CO | 2.0 | 1.0 | 725 | $1,149 | $1.58 | 4d | 1 | 0.89mi |
| 6715 N Century St Colorado Springs, CO | 1.0–3.0 | 1.0–2.0 | 1043 | $2,645 | $2.54 | 4d | 26 | 0.90mi |
| 325 Cragmor Rd Colorado Springs, CO | 2.0 | 1.0 | 537 | $899 | $1.67 | 4d | 2 | 0.92mi |
| 4012 Muse Way Colorado Springs, CO | 2.0 | 1.5 | 1124 | $1,598 | $1.42 | 25d | 1 | 0.94mi |
| 4033 Muse Way Colorado Springs, CO | 2.0 | 1.5 | 1121 | $1,500 | $1.34 | 25d | 1 | 0.96mi |
| 921 Westmoreland Rd Colorado Springs, CO | 1.0–2.0 | 1.0 | 750 | $1,234 | $1.65 | 4d | 12 | 0.99mi |
| 3370 Bryson Hts Colorado Springs, CO | 1.0–3.0 | 1.0–2.0 | 980 | $2,294 | $2.34 | 4d | 21 | 1.00mi |
| 3630 Rialto Hts Colorado Springs, CO | 1.0–3.0 | 1.0–2.0 | 959 | $1,925 | $2.01 | 4d | 13 | 1.01mi |
| 720 Melany Ln Colorado Springs, CO | 3.0 | 1.0 | 1075 | $1,399 | $1.30 | 25d | 1 | 1.01mi |
| 2625 N Chestnut St Unit 1 Colorado Springs, CO | 3.0 | 1.0 | 1173 | $1,250 | $1.07 | 4d | 1 | 1.01mi |
| 2414 Tremont St Colorado Springs, CO | 1.0–2.0 | 1.0 | 806 | $1,580 | $1.96 | 4d | 5 | 1.03mi |
| 1318 Holland Park Blvd Unit B Colorado Springs, CO | 2.0 | 1.0 | 954 | $1,300 | $1.36 | 25d | 1 | 1.03mi |
| 980 Holli Springs Ln Colorado Springs, CO | 2.0 | 1.0 | 900 | $1,150 | $1.28 | 25d | 1 | 1.05mi |
| 309 Redwood Dr Colorado Springs, CO | 3.0 | 1.0 | 829 | $2,000 | $2.41 | 25d | 1 | 1.06mi |
| 3935 Stonedike Dr Unit D Colorado Springs, CO | 2.0 | 1.0 | 764 | $1,195 | $1.56 | 22d | 1 | 1.06mi |
| 4015 Stonedike Dr Unit B Colorado Springs, CO | 2.0 | 1.0 | 964 | $1,399 | $1.45 | 4d | 1 | 1.08mi |
| 1299 Vondelpark Dr Unit B Colorado Springs, CO | 2.0 | 1.5 | 992 | $1,450 | $1.46 | 4d | 1 | 1.09mi |
| 2524 N Weber St Colorado Springs, CO | 3.0 | 1.0 | 1242 | $2,700 | $2.17 | 25d | 1 | 1.10mi |
| 1035 Magnolia St Unit B Colorado Springs, CO | 2.0 | 1.0 | 850 | $1,145 | $1.35 | 4d | 1 | 1.11mi |
| 1035 Magnolia St Colorado Springs, CO | 2.0 | 1.0 | 850 | $1,199 | $1.41 | 25d | 1 | 1.11mi |
| 1016 Magnolia St Unit 1018 Colorado Springs, CO | 2.0 | 1.0 | 800 | $1,304 | $1.63 | 25d | 1 | 1.11mi |
| 1038 Westmoreland Rd Unit A Colorado Springs, CO | 2.0 | 1.0 | 700 | $875 | $1.25 | 15d | 1 | 1.11mi |
| 906 1/2 Carlisle St Colorado Springs, CO | 2.0 | 1.0 | 1128 | $1,245 | $1.10 | 25d | 1 | 1.13mi |
| 1075 Magnolia St Apt 1 Colorado Springs, CO | 2.0 | 1.0 | 900 | $795 | $0.88 | 4d | 1 | 1.14mi |
| 1075 Magnolia St Apt 3 Colorado Springs, CO | 2.0 | 1.0 | 900 | $845 | $0.94 | 4d | 1 | 1.14mi |
| 2924 N Arcadia St Colorado Springs, CO | 1.0–2.0 | 1.0 | 775 | $1,099 | $1.42 | 25d | 4 | 1.16mi |
| 4053 Flash Pt Colorado Springs, CO | 3.0 | 2.5 | 1499 | $2,195 | $1.46 | 25d | 1 | 1.16mi |
| 1140 Holli Springs Ln Unit D Colorado Springs, CO | 2.0 | 1.0 | 1100 | $1,550 | $1.41 | 15d | 1 | 1.19mi |
| 1134 Westmoreland Rd Colorado Springs, CO | 1.0–2.0 | 1.0 | 675 | $1,050 | $1.56 | 4d | 2 | 1.19mi |
| 4760 Rusina Rd Colorado Springs, CO | 1.0–2.0 | 1.0–2.0 | 705 | $1,441 | $2.04 | 4d | 14 | 1.20mi |
| 2510 Plumtree Grv Colorado Springs, CO | 2.0 | 2.0 | 912 | $1,800 | $1.97 | 4d | 1 | 1.20mi |
| 2510 Plumtree Grv Colorado Springs, CO | 2.0 | 2.0 | 912 | $1,800 | $1.97 | 25d | 1 | 1.20mi |
Listing history 14 events
-
2026-06-18days on market $80,900 Active 84 DOM
-
2026-06-17days on market $80,900 Active 83 DOM
-
2026-06-16days on market $80,900 Active 82 DOM
-
2026-06-15days on market $80,900 Active 81 DOM
-
2026-06-14days on market $80,900 Active 79 DOM
-
2026-06-10days on market $80,900 Active 76 DOM
-
2026-06-09days on market $80,900 Active 75 DOM
-
2026-06-08days on market $80,900 Active 74 DOM
-
2026-06-07days on market $80,900 Active 73 DOM
-
2026-06-05days on market $80,900 Active 70 DOM
-
2026-06-03days on market $80,900 Active 69 DOM
-
2026-06-03days on market $80,900 Active 68 DOM
-
2026-06-01pricedays on market $80,900 Active 67 DOM
-
2026-05-31days on market $80,400 Active 66 DOM
ⓘ Source: listings_history table (triggers on properties + properties_extension) + one-shot
backfill from property_details.listing_events for pre-trigger history.
Climate risk First Street
- Flood 1/10 Low FEMA zone X (shaded) · 0% chance over 30 yrs
- Wildfire 6/10 Major
- Heat 2/10 Low 7 d/yr ≥89°F today · 20 d/yr by 30 yrs out
- Wind 2/10 Low
- Air quality 2/10 Low 0 unhealthy d/yr today · 1 by 30 yrs out
Nearby sold comps map
Loading sold comps map…
Walkable amenities ~0.75 mi
Loading nearby amenities…
Taxation est. · year 1
- Rental income
- $19,454
- − Mortgage interest
- −$4,532
- − Property taxes
- −$1,214
- − Insurance
- −$404
- − Repairs & maintenance
- −$1,556
- − Management
- −$1,556
- − Depreciation
- −$2,353
- Taxable income
- $7,838
- Est. tax owed @ 24.0%
- −$1,881
- After-tax cash flow
- $6,778/yr
For passive investors: Depreciation is non-cash, so a rental often shows a tax loss while cash-flowing — sheltering income. Rental losses are passive: they offset passive income freely, and up to $25,000/yr can offset ordinary (W-2) income if you actively participate and your MAGI is under $100k (phasing out to $0 by $150k); unused losses carry forward. On sale, claimed depreciation is recaptured at up to 25%, and gains may owe capital-gains tax (a 1031 exchange can defer both). Figures are a year-1 estimate at your 24.0% rate — not tax advice; consult a CPA.
Condition & rehab AI · 13 photos
This brand new 3-bedroom, 2-bathroom home is move-in ready with excellent condition and no visible repairs needed. It offers a modern kitchen, bathrooms, and exterior, making it an attractive option for both resale and rental.
Value-add opportunities
- Both Painting the exterior and interior walls — Fresh paint can enhance curb appeal and interior aesthetics, attracting more buyers and renters.
- Both Landscaping improvements — Enhancing the landscaping can increase the home's curb appeal and attract more potential buyers and renters.
Renovation cost estimate screening
Value-add ROI direction
- Both Painting the exterior and interior walls — Fresh paint can enhance curb appeal and interior aesthetics, attracting more buyers and renters. ↑
- Both Landscaping improvements — Enhancing the landscaping can increase the home's curb appeal and attract more potential buyers and renters. ↑
ⓘ Cost ranges are severity-bucket heuristics (US national rule-of-thumb). Get contractor quotes + a written scope before underwriting a rehab budget.
Schools (NCES district)
- District
- Colorado Springs School District No. 11 In The County Of E
- NCES district ID
- 0803060
- Math proficiency
- 20% ▼ -8.00%
- Reading proficiency
- 37% ▼ -4.00%
- Median HH income
- $47,884
- Composite
- 24.69/100
- National rank
- #7613
- State rank
- #56 of 86 in CO
Livability — Colorado Springs
- Score
- 78/100
- State rank
- #23
- US rank
- #2639
Category grades
Schools grade is shown separately in the Schools card above.
Census & demographics
- Census place
- Colorado Springs, CO
- County
- El Paso County · 689,348 people
- City population
- 555,783
- Metro
- Colorado Springs, CO
- Population (ZIP)
- 27,815
- Household income
- $74,402
- Rent vs Own
- Severe rent burden
- 1396.0
Population outlook (El Paso County) Hauer SSP2
- Today (2025)
- 768,926 people
- By 2030
- 815,739 · +6.1%
- By 2040
- 903,489 · +17.5%
- By 2050
- 981,204 · +27.6%
- By 2075
- 1,155,542 · +50.3%
- By 2100
- 1,202,070 · +56.3%
Race, ethnicity, and origin ACS 2023
- Neighborhood character
- Predominantly White (77%)
- Race & ethnicity
- White 77% Hispanic / Latino 12% Two or more races 10% Black 3% Asian 2%
- Hispanic origin (detail)
- Mexican 8%
- Common ancestry
- Italian 3% Lithuanian 3% Slovak 3%
- Foreign-born
- 5% · Canada
- Languages at home
- 93% English-only · Spanish 4% German/W. Germanic 1%
Political lean MEDSL · El Paso
- 2024 margin
- Lean R (+9.8) · D 43.8% · R 53.5% · Other 2.7%
- 2008→2024 swing
- +9.0pp toward D · 2008: -18.8pp · 2024: -9.8pp
- All cycles
- 2024: R+9.8 2020: R+10.8 2016: R+22.6 2012: R+21.4 2008: R+18.8
Not yet ingested
- Civics
- —
Market trends
- HPI YoY
- ▼ -544.07%
- Current HPI
- 276.2139
- Rent YoY
- ▲ 0.11%
- Metro
- Colorado Springs, CO
- State GDP YoY
- ▲ 1.95%
- F500 in state
- 14
Industry mix (Fortune 500 HQ in CO)
| Industry | F500 HQs | Revenue |
|---|---|---|
| Technology Distribution | 1 | $31B |
|
||
| Food / Agriculture | 1 | $18B |
|
||
| Packaging | 1 | $14B |
|
||
| Healthcare | 1 | $13B |
|
||
| Energy | 1 | $10B |
|
||
| Technology | 1 | $4B |
|
||
Cash-flow waterfall
monthlySold comps — $/sqft
last 12 mo · ≤1 miLoading sold comps…