9417 N Dixon Ave · Lubbock, TX
Flood risk 1/10 · Minimal
- FEMA flood zone
- X (unshaded)
- Chance of flooding over 30 yrs
- 0.0%
- Est. flood insurance / yr
- $507 – $1,088
Fire risk 5/10 · Moderate
- Est. fire insurance / yr
- $1,222 – $2,270
Heat risk 5/10 · Moderate
- Hot days now (above 100°F)
- 7 days/yr
- Hot days in 30 yrs
- 20 days/yr
Wind risk 2/10 · Minimal
- Chance of severe wind over 30 yrs
- 0.0%
Air-quality risk 2/10 · Minimal
- Unhealthy air days now
- 1 days/yr
- Unhealthy air days in 30 yrs
- 1 days/yr
Risk factors via First Street. Map © Google.
Why this score? — see what drove the C+ grade
The composite is a weighted blend of 9 inputs, each scored 0–100. Each bar is that input's sub-score; the figure is the points it added to the 100-point composite (weight × sub-score).
- Cash flow +25.4/30.0
- DSCR +8.4/10.0
- ARV discount +7.5/15.0
- 1% rule +6.7/10.0
- Livability +4.0/5.0
- Schools +3.5/10.0
- Rent growth +2.5/5.0
- Condition / age +2.5/5.0
- Appreciation +0.0/10.0
$98,000
🖨 Deal sheet 📄 Offer letter ✓ Due diligence
Listing remarks
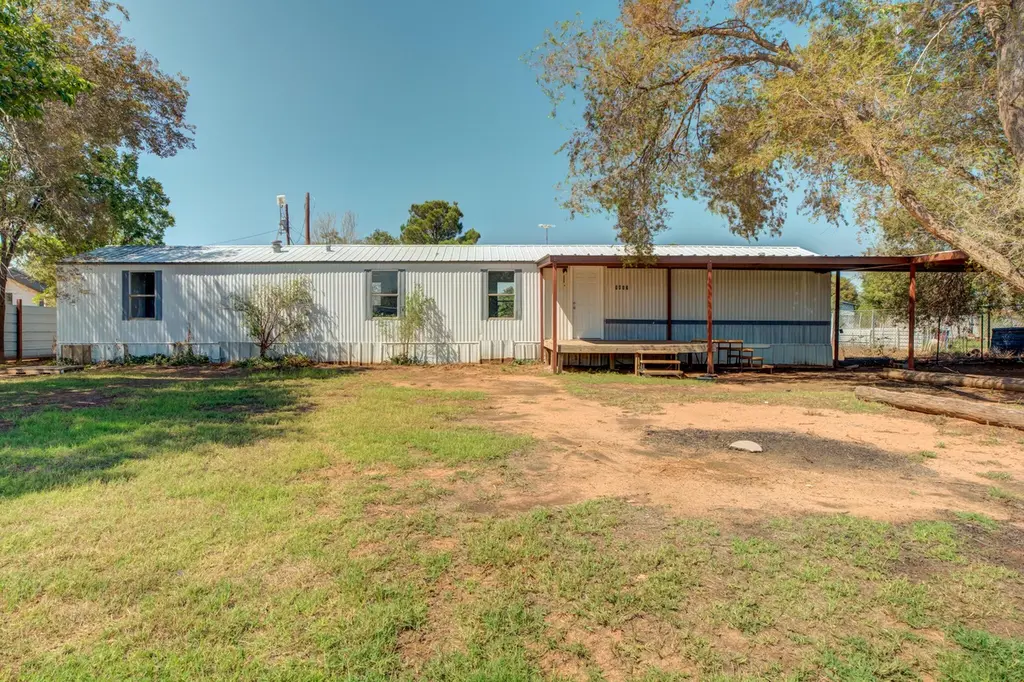
This three bedroom, two bathroom home is located just a short distance north of loop 289 in Lubbock. Outside, the property sits on a spacious lot with covered parking. Inside, this home has been remodeled with fresh paint and new flooring. Energy efficient mini split HVAC units have been installed to help keep the house at a comfortable temperature year round. The open concept kitchen and living room provide plenty of living space for comfortable living. The isolated master suite has its own attached bathroom and a walk in closet. Call today to come see this house for yourself!
Key facts
- Remodeled
- Covered parking
- Fresh paint
Tags
Property features AI
Exterior
- Parking: Carport (1 space)
- Utilities: Paved/asphalt road access
- Home design: Manufactured home; Single-story; Updated/remodeled
- Construction: Aluminum siding; Metal roof; Other foundation; Built as a manufactured home
- Exterior features: Awning-covered areas; Private yard; Fenced backyard; Front porch
Interior
- Kitchen: Gas range
- Bathrooms: 2 full bathrooms
- Heating & cooling: Ductless electric heating; Ductless electric cooling; Ceiling fans
- Interior features: Breakfast bar; Ceiling fans; Eat-in kitchen; Open floorplan; Vaulted ceilings; Walk-in closets
Neighborhood map
What this means for you Summary
Snapshot
- This is a 3-bed/2.0-bath manufactured listed at $98k.
Deal economics
- At list price, monthly cash flow is $226 ($3k/yr) — positive.
- The deal already cash-flows at list — no discount required.
- Meets the 1% rule at list price ($1k rent vs $98k).
- Recommended offer: $97k (1.5% below list) — sets the bar for market timing.
Location & tenants
- Location reads 80/100 on livability (#37 in TX, #1,749 nationally) — a professional / high-income tenant draw. Strengths: commute A+, cost of living A+, housing A+; Watch: employment C-, crime F.
- New Deal ISD (rural): math 39% / reading 43% proficiency, ranked #368 of 826 in TX (top 45%) — families likely to look elsewhere, expect single-tenant / working-renter base with shorter leases.
- Zoned schools: New Deal El (math 32% / reading 37%, grade F, #1,995 of 4,322 statewide, top 50%, 275 students, 73% FRL); New Deal Middle (math 38% / reading 40%, grade F, #690 of 1,662 statewide, top 42%, 235 students, 72% FRL); New Deal H S (math 57% / reading 64%, grade C+, #265 of 1,632 statewide, top 16%, 244 students, 68% FRL) — zoned schools average 71% FRL vs 53% district-wide (18 pts higher); higher-poverty schools than district average — tighter screening recommended.
- Market conditions: 110 active listings in the ZIP; lower-income renter base — watch delinquency; 2,219 units permitted in Lubbock County in 2024 (252 in 5+ unit buildings).
- This rent runs 38% of the median local income ($36k/yr) — at the standard rent-burdened threshold; future hikes will face affordability resistance.
Forward outlook
- Local home prices are declining (-3.0%/yr); year-one equity from $678 of loan paydown is wiped out by about $3k of value loss. Plan a longer hold.
- Lubbock County population projected at +39% by 2050 — long-run rental-demand tailwind backs the buy-and-hold thesis.
Negotiation context
- It's been on market 22 days — a 2% lower offer ($97k) is reasonable based on typical stale-listing flexibility.
Risks & watch-outs
- Climate carrying-cost: moderate wildfire risk; extreme-heat days projected 7→20/yr by 2055 (HVAC capex compounding) — expect insurance premiums to compound above CPI over the hold.
Questions for the listing agent
- Is there a deadline driving the sale (1031 exchange, divorce, estate, relocation)? That informs how much negotiation room exists.
- Schools are D-rated, which usually means shorter tenancies and higher turnover. Who's the typical renter profile here, and what's been the actual vacancy rate?
- Crime grade is F in this area — have there been break-ins, vandalism, or insurance claims at this property in the last 3 years? What carrier currently insures it and at what premium?
- What's the average days-on-market for RENTAL listings here right now (not sales)? A rising rental-DOM trend means longer vacancies and softer asking-rent achievability than the comps imply.
- What's the recent tenant-quality profile in this submarket — average credit score on applications, eviction rate, late-payment / NSF rate, and stable-employment percentage? A property-management company in the area should have these aggregated.
- How much new for-sale + rental construction is in the pipeline within 1–3 miles? Heavy new supply typically softens prices + rents 12–24 months out; constrained supply supports both.
Investment metrics
- 1% rule
- 1.17% ✓
- Cap rate
- 9.06%
- Cash-on-cash
- 9.89%
- DSCR
- 1.44
- GRM
- 7.1
CMA / ARV
No comps found within radius.
Projected returns pro-forma
-3.0% appreciation · 3.0% rent growth · sell at horizon
- IRR
- -1.4%
- Equity multiple
- 0.95×
- Total profit
- $-1,457
- Equity at exit
- $14,612
- IRR
- 8.3%
- Equity multiple
- 1.63×
- Total profit
- $17,352
- Equity at exit
- $8,473
Cash invested: $27,440 (down + closing). Projections, not guarantees.
Landlord ↔ Tenant lean methodology
- Overall (STATE)
- 87 Strongly Landlord-Friendly
- State Texas
- 87 Strongly Landlord-Friendly · R+5
- County
- — inherits STATE
- City
- — inherits STATE
ZIP-level market 79415
- Home prices YoY
- -20.1%
- Active inventory
- 110
- Price-to-rent
- 7.1×
Monthly cashflow live
- Estimated rent
- $1,144 medium interval (Pro) →
- Mortgage (P&I)
- −$514
- Tax est. 1.5%
- −$122 /mo · $1,470/yr
- Insurance
- −$41
- HOA
- −$0
- Vacancy / Maint / Mgmt
- −$240
- Net cashflow
- $226
Break-even live
UW: 25.0% down · 7.5% · 30yr · 1.5% tax · 5.0% vac · 8.0% maint · 8.0% mgmt
Financing live
Cash to close
- Down payment
- $24,500
- Closing costs
- $2,940
- Reserves months
- —
- Total cash needed
- —
Loan-product check · same deal, 3 products live
Conventional
25% down · 7.5% · 30yr
- Down + closing
- —
- Monthly P&I
- —
- Monthly cashflow
- —
- DSCR
- —
- Eligible?
- —
Personal DTI + credit; lowest rate.
DSCR
20% down · 8.5% · 30yr
- Down + closing
- —
- Monthly P&I
- —
- Monthly cashflow
- —
- DSCR
- —
- Eligible?
- —
No personal income docs; deal must DSCR.
Hard money
10% down · 12.0% · 12mo
- Down + closing
- —
- Monthly P&I
- —
- Monthly cashflow
- —
- DSCR
- —
- Eligible?
- —
Short-term bridge; refi at stabilization.
Listing history 14 events
-
2026-06-13statusdays on market $98,000 Pending 22 DOM
-
2026-06-10days on market $98,000 Active 21 DOM
-
2026-06-09days on market $98,000 Active 20 DOM
-
2026-06-08days on market $98,000 Active 19 DOM
-
2026-06-07days on market $98,000 Active 18 DOM
-
2026-06-03days on market $98,000 Active 14 DOM
-
2026-06-02days on market $98,000 Active 13 DOM
-
2026-06-01days on market $98,000 Active 12 DOM
-
2026-05-31days on market $98,000 Active 11 DOM
-
2026-05-30days on market $98,000 Active 10 DOM
-
2026-05-20$98,000 Active
-
2025-12-26price $89,950
-
2025-12-06price $91,500
-
2025-10-15price $92,000
ⓘ Source: listings_history table (triggers on properties + properties_extension) + one-shot
backfill from property_details.listing_events for pre-trigger history.
Climate risk First Street
- Flood 1/10 Low FEMA zone X (unshaded) · 0% chance over 30 yrs
- Wildfire 5/10 Major
- Heat 5/10 Major 7 d/yr ≥100°F today · 20 d/yr by 30 yrs out
- Wind 2/10 Low 0% chance of damaging wind over 30 yrs
- Air quality 2/10 Low 1 unhealthy d/yr today · 1 by 30 yrs out
Nearby sold comps map
Loading sold comps map…
Walkable amenities ~0.75 mi
Loading nearby amenities…
Taxation est. · year 1
- Rental income
- $13,723
- − Mortgage interest
- −$5,490
- − Property taxes
- −$1,470
- − Insurance
- −$490
- − Repairs & maintenance
- −$1,098
- − Management
- −$1,098
- − Depreciation
- −$2,851
- Taxable income
- $1,227
- Est. tax owed @ 24.0%
- −$294
- After-tax cash flow
- $2,420/yr
For passive investors: Depreciation is non-cash, so a rental often shows a tax loss while cash-flowing — sheltering income. Rental losses are passive: they offset passive income freely, and up to $25,000/yr can offset ordinary (W-2) income if you actively participate and your MAGI is under $100k (phasing out to $0 by $150k); unused losses carry forward. On sale, claimed depreciation is recaptured at up to 25%, and gains may owe capital-gains tax (a 1031 exchange can defer both). Figures are a year-1 estimate at your 24.0% rate — not tax advice; consult a CPA.
Schools (NCES district)
- District
- New Deal ISD
- NCES district ID
- 4832430
- Math proficiency
- 39% ▼ -3.00%
- Reading proficiency
- 43% ▼ -2.00%
- Median HH income
- $48,346
- Composite
- 35.15/100
- National rank
- #5009
- State rank
- #368 of 826 in TX
Livability — Lubbock
- Score
- 80/100
- State rank
- #37
- US rank
- #1749
Category grades
Schools grade is shown separately in the Schools card above.
Census & demographics
- County
- Lubbock County · 293,542 people
- City population
- 283,030
- Metro
- Lubbock, TX
- Population (ZIP)
- 15,794
- Household income
- $36,468
- Rent vs Own
- Severe rent burden
- 1287.0
Population outlook (Lubbock County) Hauer SSP2
- Today (2025)
- 345,960 people
- By 2030
- 371,449 · +7.4%
- By 2040
- 424,539 · +22.7%
- By 2050
- 481,150 · +39.1%
- By 2075
- 633,467 · +83.1%
- By 2100
- 746,853 · +115.9%
Race, ethnicity, and origin ACS 2023
- Neighborhood character
- Diverse neighborhood (Simpson 0.58)
- Race & ethnicity
- Hispanic / Latino 59% White 26% Two or more races 19% Black 7% Asian 5%
- Hispanic origin (detail)
- Mexican 49%
- Common ancestry
- Italian 1% Serbian 1% Estonian 1%
- Foreign-born
- 15% · Canada, China
- Languages at home
- 57% English-only · Spanish 36% Other Indo-European 4% Arabic 1%
Political lean MEDSL · Lubbock
- 2024 margin
- Solid R (+39.5) · D 29.7% · R 69.2% · Other 1.0%
- 2008→2024 swing
- -2.8pp toward R · 2008: -36.7pp · 2024: -39.5pp
- All cycles
- 2024: R+39.5 2020: R+32.2 2016: R+38.4 2012: R+40.9 2008: R+36.7
Not yet ingested
- Civics
- —
Market trends
- HPI YoY
- ▼ -41.79%
- Current HPI
- 165.7933
- Rent YoY
- —
- Metro
- Lubbock, TX
- State GDP YoY
- ▲ 3.95%
- F500 in state
- 110
Industry mix (Fortune 500 HQ in TX)
| Industry | F500 HQs | Revenue |
|---|---|---|
| Energy | 16 | $1,198B |
|
||
| Technology | 5 | $198B |
|
||
| Engineering / Construction | 4 | $72B |
|
||
| Energy Services | 3 | $60B |
|
||
| Utilities | 3 | $41B |
|
||
| Healthcare | 2 | $330B |
|
||
Price history
+6.5% since first listed4 events — show timeline
- 2026-05-20 Listed $98,000 LARMLS
- 2025-12-26 Price Changed $89,950 LARMLS
- 2025-12-06 Price Changed $91,500 LARMLS
- 2025-10-15 Price Changed $92,000 LARMLS
Property tax history
+2.1%/yrLatest (2025): $149 · +23.5% YoY. Source: county tax records.
Cash-flow waterfall
monthlySold comps — $/sqft
last 12 mo · ≤1 miLoading sold comps…