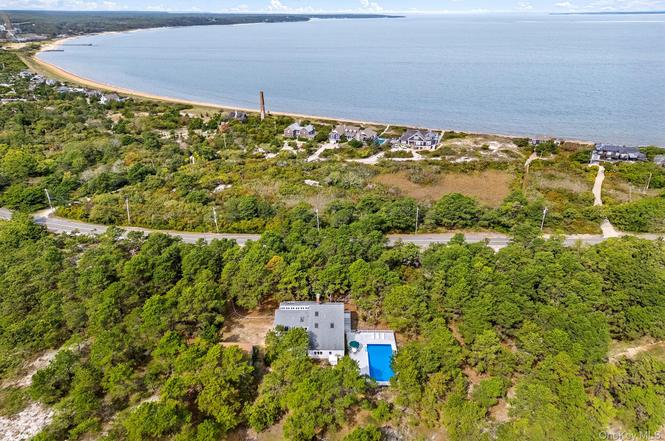
278 Cranberry Hole Rd · Napeague, NY
Flood risk 7/10 · Major
- FEMA flood zone
- AE
- Chance of flooding over 30 yrs
- 0.95%
- Est. flood insurance / yr
- $2,026 – $9,024
Fire risk 1/10 · Minimal
- Est. fire insurance / yr
- $691 – $1,283
Heat risk 4/10 · Minor
- Hot days now (above 89°F)
- 7 days/yr
- Hot days in 30 yrs
- 18 days/yr
Wind risk 8/10 · Major
- Chance of severe wind over 30 yrs
- 80.0%
Air-quality risk 3/10 · Minor
- Unhealthy air days now
- 3 days/yr
- Unhealthy air days in 30 yrs
- 4 days/yr
Risk factors via First Street. Map © Google.
Why this score? — see what drove the C+ grade
The composite is a weighted blend of 9 inputs, each scored 0–100. Each bar is that input's sub-score; the figure is the points it added to the 100-point composite (weight × sub-score).
- Cash flow +27.1/30.0
- DSCR +9.4/10.0
- Schools +6.7/10.0
- 1% rule +6.4/10.0
- Appreciation +5.6/10.0
- Rent growth +2.5/5.0
- Condition / age +2.5/5.0
- Livability +2.3/5.0
- ARV discount +1.9/15.0
$2,695,000
🖨 Deal sheet 📄 Offer letter ✓ Due diligence
Listing remarks
Bordered by 100's of acres of protected land, this authentic beach house is found in a location that defines the east end. A 1980's Contemporary surrounded by nature's best and affording a locational advantage to appreciate. Be only five minutes to the Amagansett Square, the Atlantic Ocean or Gardiners Bay, ten minutes to Montauk and seconds to nostalgic Hampton's roadside dining destinations. Set on 1.4 acres, this spacious home offers a total of 4 bedrooms and 4 bathrooms within its 2,796 sq. ft. of interior living space, a 20 x 40 pool, and a 936 sq. ft. detached garage. A preeminent opportunity in The Promised Land of Amagansett. Enjoy as is, renovate or start over and be the next to st
Key facts
- Beach house
- 1.4 acres
- 20 x 40 pool
Tags
Neighborhood map
What this means for you Summary
Snapshot
- This is a 4-bed/4.0-bath single-family listed at $2.69M.
Deal economics
- At list price, monthly cash flow is $7k ($86k/yr) — positive.
- The deal already cash-flows at list — no discount required.
- Meets the 1% rule at list price ($31k rent vs $2.69M).
- Recommended offer: $2.61M (3.0% below list) — sets the bar for market timing.
Location & tenants
- Location reads 46/100 on livability (#1,184 in NY) — a working-class tenant base; expect higher turnover. Strengths: housing A+, crime A; Watch: amenities F, commute F, employment F.
- Amagansett Union Free School District (town): math 70% / reading 80% proficiency, ranked #106 of 755 in NY (top 14%) — strong family-tenant draw, lease renewals of 3-5y typical.
- Zoned schools: Amagansett School (math 74% / reading 74%, grade A, #314 of 2,108 statewide, top 17%, 125 students, 0% FRL) — zoned schools average 0% FRL vs 24% district-wide (24 pts lower); this property's tenant base skews higher-income than the district average.
- Market conditions: 20 active listings in the ZIP; 4 comparable units currently listed for rent nearby; rentals at typical pace (median 19d on market — plan ~3-4 weeks tenant-placement turnaround); high-income renter base; 1,366 units permitted in Suffolk County in 2024 (216 in 5+ unit buildings).
- At $30,631/mo this rent would consume 298% of the median local household income ($123k/yr) — very limited rent-growth headroom before tenants either downsize or default.
Forward outlook
- In year one you build about $52k of equity ($19k loan paydown + $34k appreciation (1.2% local appreciation)).
- Suffolk County population projected to shrink 5% by 2050 — rents likely to lag national; underwrite the cash flow, not the appreciation.
- At projected returns (1.2% appreciation + 3.0% rent growth), your $755k cash investment doubles in ~5 years — after that, you're playing with house money.
- By year 4, paydown + projected appreciation supports a ~$187k cash-out refi (75% LTV) — recoverable capital for the next deal without selling this one.
Negotiation context
- It's been on market 47 days — a 3% lower offer ($2.61M) is reasonable based on typical stale-listing flexibility.
Risks & watch-outs
- Watch-outs: flood insurance adds $460/mo.
- Climate carrying-cost: in FEMA flood zone AE (mandatory federal flood insurance); severe wind risk, 80% chance of damaging wind over 30y — expect insurance premiums to compound above CPI over the hold.
Questions for the listing agent
- It's been on market 47 days. Have you received any prior offers? Is the seller open to a 3% concession, seller financing, or rate buy-down credit?
- What's the actual annual flood-insurance premium (NFIP or private), and is the property in a SFHA with mandatory coverage?
- Is there a deadline driving the sale (1031 exchange, divorce, estate, relocation)? That informs how much negotiation room exists.
- What's the average days-on-market for RENTAL listings here right now (not sales)? A rising rental-DOM trend means longer vacancies and softer asking-rent achievability than the comps imply.
- What's the recent tenant-quality profile in this submarket — average credit score on applications, eviction rate, late-payment / NSF rate, and stable-employment percentage? A property-management company in the area should have these aggregated.
- How much new for-sale + rental construction is in the pipeline within 1–3 miles? Heavy new supply typically softens prices + rents 12–24 months out; constrained supply supports both.
Investment metrics
- 1% rule
- 1.14% ✓
- Cap rate
- 9.68%
- Cash-on-cash
- 12.09%
- DSCR
- 1.54
- GRM
- 7.3
CMA / ARV
- ARV (on-the-fly)
- $2,398,968
- Comps found
- 1
Show comp detail 1 sale within ~0.75 mi
| Address | Dist | Beds/Ba | Sqft | Sold | Price | $/sf | Match |
|---|---|---|---|---|---|---|---|
| 278 Cranberry Hole Rd | 0.00mi | 4/4.0 | 2,796 (0%) | 0mo | $2,400,000 | $858 | 100 |
Match score weights: distance 35% · size 25% · config 20% · recency 20%. Top-matched comps best support the ARV.
Projected returns pro-forma
1.25% appreciation · 3.0% rent growth · sell at horizon
- IRR
- 13.8%
- Equity multiple
- 1.71×
- Total profit
- $538,252
- Equity at exit
- $955,742
- IRR
- 17.1%
- Equity multiple
- 3.12×
- Total profit
- $1,600,137
- Equity at exit
- $1,298,181
Cash invested: $754,600 (down + closing). Projections, not guarantees.
Landlord ↔ Tenant lean methodology
- Overall (STATE)
- 15 Strongly Tenant-Friendly
- State New York
- 15 Strongly Tenant-Friendly · D+10
- County
- — inherits STATE
- City
- — inherits STATE
ZIP-level market 11930
- Home prices YoY
- 0.2%
- Active inventory
- 20
- Price-to-rent
- 7.3×
Monthly cashflow live
- Estimated rent
- $30,631 medium interval (Pro) →
- Mortgage (P&I)
- −$14,133
- Tax from tax record
- −$1,341 /mo · $16,097/yr
- Insurance
- −$1,123
- Flood insurance flood zone
- −$460 /mo · $5,525/yr
- HOA
- −$0
- Vacancy / Maint / Mgmt
- −$6,432
- Net cashflow
- $7,141
Break-even live
UW: 25.0% down · 7.5% · 30yr · 1.5% tax · 5.0% vac · 8.0% maint · 8.0% mgmt
Financing live
Cash to close
- Down payment
- $673,750
- Closing costs
- $80,850
- Reserves months
- —
- Total cash needed
- —
Loan-product check · same deal, 3 products live
Conventional
25% down · 7.5% · 30yr
- Down + closing
- —
- Monthly P&I
- —
- Monthly cashflow
- —
- DSCR
- —
- Eligible?
- —
Personal DTI + credit; lowest rate.
DSCR
20% down · 8.5% · 30yr
- Down + closing
- —
- Monthly P&I
- —
- Monthly cashflow
- —
- DSCR
- —
- Eligible?
- —
No personal income docs; deal must DSCR.
Hard money
10% down · 12.0% · 12mo
- Down + closing
- —
- Monthly P&I
- —
- Monthly cashflow
- —
- DSCR
- —
- Eligible?
- —
Short-term bridge; refi at stabilization.
Rent comps 4 comps
| Address | Beds | Baths | Sqft | Rent | $/sqft | DOM | Units | Dist |
|---|---|---|---|---|---|---|---|---|
| 11 Heatherwood Ln Amagansett, NY | 3.0 | 2.0 | 2000 | $25,000 | $12.50 | 1d | 1 | 0.95mi |
| 8 Devon Woods Close Amagansett, NY | 4.0 | 4.5 | 4000 | $25,000 | $6.25 | 10d | 1 | 1.33mi |
| 16 Dune Ln Amagansett, NY | 4.0 | 3.0 | 2000 | $70,000 | $35.00 | 24d | 1 | 1.44mi |
| 112 Central Ave Amagansett, NY | 4.0 | 3.0 | 2300 | $25,000 | $10.87 | 19d | 1 | 1.44mi |
Listing history 2 events
-
2025-11-25status Pending
-
2025-10-09$2,695,000 Active
ⓘ Source: listings_history table (triggers on properties + properties_extension) + one-shot
backfill from property_details.listing_events for pre-trigger history.
Tax reassessment forecast NY · Partial reset (capped growth)
- Current annual tax
- $16,097 · $1,341/mo
- Projected year-2 tax
- $30,821 · $2,568/mo
- Expected delta
- +$14,724/yr (+$1,227/mo · 91.5%)
ⓘ Screening estimate from a state-policy table — verify with the county assessor before closing.
Climate risk First Street
- Flood 7/10 Severe FEMA zone AE · 95% chance over 30 yrs
- Wildfire 1/10 Low
- Heat 4/10 Moderate 7 d/yr ≥89°F today · 18 d/yr by 30 yrs out
- Wind 8/10 Severe 80% chance of damaging wind over 30 yrs
- Air quality 3/10 Moderate 3 unhealthy d/yr today · 4 by 30 yrs out
Nearby sold comps map
Loading sold comps map…
Walkable amenities ~0.75 mi
Loading nearby amenities…
Taxation est. · year 1
- Rental income
- $367,567
- − Mortgage interest
- −$150,962
- − Property taxes
- −$16,097
- − Insurance
- −$19,000
- − Repairs & maintenance
- −$29,405
- − Management
- −$29,405
- − Depreciation
- −$78,400
- Taxable income
- $44,297
- Est. tax owed @ 24.0%
- −$10,631
- After-tax cash flow
- $75,055/yr
For passive investors: Depreciation is non-cash, so a rental often shows a tax loss while cash-flowing — sheltering income. Rental losses are passive: they offset passive income freely, and up to $25,000/yr can offset ordinary (W-2) income if you actively participate and your MAGI is under $100k (phasing out to $0 by $150k); unused losses carry forward. On sale, claimed depreciation is recaptured at up to 25%, and gains may owe capital-gains tax (a 1031 exchange can defer both). Figures are a year-1 estimate at your 24.0% rate — not tax advice; consult a CPA.
Schools (NCES district)
- District
- Amagansett Union Free School District
- NCES district ID
- 3602880
- Math proficiency
- 70% ▼ -10.00%
- Reading proficiency
- 80% ▬ 0.00%
- Median HH income
- $78,077
- Composite
- 67.17/100
- National rank
- #848
- State rank
- #106 of 755 in NY
Livability — Napeague
- Score
- 46/100
- State rank
- #1184
- US rank
- #26459
Category grades
Schools grade is shown separately in the Schools card above.
Census & demographics
- Census place
- Napeague, NY
- County
- Suffolk County · 679,920 people
- Metro
- New York-Newark-Jersey City, NY-NJ-PA
- Population (ZIP)
- 842
- Household income
- $123,257
- Rent vs Own
Population outlook (Suffolk County) Hauer SSP2
- Today (2025)
- 1,505,262 people
- By 2030
- 1,498,318 · -0.5%
- By 2040
- 1,471,101 · -2.3%
- By 2050
- 1,424,848 · -5.3%
- By 2075
- 1,337,157 · -11.2%
- By 2100
- 1,217,720 · -19.1%
Race, ethnicity, and origin ACS 2023
- Neighborhood character
- Predominantly White (84%)
- Race & ethnicity
- White 84% Hispanic / Latino 10% Two or more races 5%
- Hispanic origin (detail)
- Mexican 4%
- Common ancestry
- Italian 10% Slovene 5% Romanian 3%
- Foreign-born
- 12% · Canada, Jamaica
- Languages at home
- 87% English-only · Spanish 11% Other Indo-European 2%
Political lean MEDSL · Suffolk
- 2024 margin
- Lean R (+10.0) · D 45.0% · R 55.0%
- 2008→2024 swing
- -16.0pp toward R · 2008: 6.0pp · 2024: -10.0pp
- All cycles
- 2024: R+10.0 2020: R+0.0 2016: R+8.2 2012: D+2.9 2008: D+6.0
Not yet ingested
- Civics
- —
Market trends
- HPI YoY
- ▲ 1.25%
- Current HPI
- 541.254
- Rent YoY
- —
- Metro
- New York-Newark-Jersey City, NY-NJ-PA
- State GDP YoY
- ▲ 2.60%
- F500 in state
- 92
Industry mix (Fortune 500 HQ in NY)
| Industry | F500 HQs | Revenue |
|---|---|---|
| Financial Services | 10 | $950B |
|
||
| Consumer Goods | 9 | $162B |
|
||
| Insurance | 4 | $225B |
|
||
| Telecommunications | 2 | $144B |
|
||
| Pharmaceuticals | 2 | $112B |
|
||
| Media / Entertainment | 2 | $69B |
|
||
Price history
2 events — show timeline
- 2025-11-25 Pending — OneKey® MLS as Distributed by MLS Grid
- 2025-10-09 Listed $2,695,000 OneKey® MLS as Distributed by MLS Grid
Property tax history
+2.4%/yrLatest (2025): $16,097 · +0.0% YoY. Source: county tax records.
Cash-flow waterfall
monthlySold comps — $/sqft
last 12 mo · ≤1 miLoading sold comps…