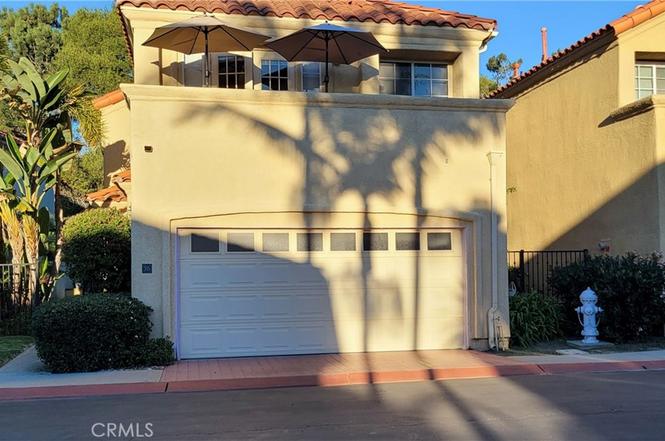
36 Saint Kitts · Dana Point, CA
Flood risk 1/10 · Minimal
- FEMA flood zone
- X (unshaded)
- Chance of flooding over 30 yrs
- 0.0%
- Est. flood insurance / yr
- $507 – $1,088
Fire risk 1/10 · Minimal
- Est. fire insurance / yr
- $659 – $1,223
Heat risk 5/10 · Moderate
- Hot days now (above 84°F)
- 2 days/yr
- Hot days in 30 yrs
- 7 days/yr
Wind risk 1/10 · Minimal
- Chance of severe wind over 30 yrs
- —
Air-quality risk 4/10 · Minor
- Unhealthy air days now
- 5 days/yr
- Unhealthy air days in 30 yrs
- 5 days/yr
Risk factors via First Street. Map © Google.
Why this score? — see what drove the D grade
The composite is a weighted blend of 9 inputs, each scored 0–100. Each bar is that input's sub-score; the figure is the points it added to the 100-point composite (weight × sub-score).
- ARV discount +15.0/15.0
- Appreciation +9.1/10.0
- Schools +5.7/10.0
- Cash flow +3.5/30.0
- Rent growth +3.5/5.0
- Livability +3.2/5.0
- Condition / age +2.5/5.0
- 1% rule +0.0/10.0
- DSCR +0.0/10.0
$1,430,000
🖨 Deal sheet (PDF) 📄 Offer letter ✓ Due diligence
Listing remarks
Welcome to the prestigious Monarch Beach community in the Antigua Neighborhood, a 24-hour guard-gated enclave offering unparalleled security and exclusivity. This home, located on a private and quiet cul-de-sac, features an open floor plan with high ceilings, creating a spacious and airy ambiance. It includes two bedrooms upstairs, a large den downstairs that can serve as an office, a balcony for relaxing views, and a cozy living room with a fireplace. The property is equipped boasts a charming patio area perfect for outdoor dining or unwinding. Although it needs some work, this home provides a fantastic opportunity to customize and make it your own. Ideally situated, it's just a short stro
Key facts
- Private cul de sac
- Guard gated enclave
- 4,200 sq ft lot
Tags
Neighborhood map
What this means for you Summary
Snapshot
- This is a 2-bed/2.5-bath single-family listed at $1.43M.
Deal economics
- At list price, monthly cash flow is $-4k ($-52k/yr) — negative.
- To cash-flow at today's rent, offer at most $662k (53.7% below list).
- To meet the 1% rule (rent ≥ 1% of price), the offer needs to be $655k (54.2% below list).
- Recommended offer: $655k (54.2% below list) — sets the bar for 1% rule.
- Cap rate 2.6% vs local median 1.5% in Dana Point — top-decile yield for the area; either an underpriced asset or a hidden risk that comps aren't pricing in. Stress-test before assuming the spread holds.
Location & tenants
- Location reads 65/100 on livability (#398 in CA) — a middle-class / working-renter tenant base. Strengths: commute A+, employment A+, health & safety A+; Watch: amenities F, cost of living F.
- Capistrano Unified (suburban): math 50% / reading 72% proficiency, ranked #64 of 517 in CA (top 12%) — acceptable for families but not a draw, mixed tenant base, ~2y average lease; only 19% free/reduced lunch — higher-income household profile.
- Zoned schools: John Malcom Elementary (548 students, 29% FRL); Marco Forster Middle (math 24% / reading 24%, grade F, #277 of 498 statewide, top 73%, 1,082 students, 70% FRL); Dana Hills High (math 43% / reading 68%, grade C, #246 of 1,170 statewide, top 21%, 1,965 students, 39% FRL) — zoned schools average 46% FRL vs 19% district-wide (28 pts higher); higher-poverty schools than district average — tighter screening recommended.
- Zoned-school proficiency averages 40% at this address vs 61% district-wide (-21 pts) — the specific schools serving this property underperform the Capistrano Unified average; the district grade overstates school quality for this exact location.
- Market conditions: Rents rising fast (+4.2%/yr); 89 active listings in the ZIP; 40 comparable units currently listed for rent nearby; rentals lingering (median 46d on market — plan ~5-8 weeks vacancy on turnover, expect pricing pressure); 50% of comp listings sitting > 30 days — soft ceiling on asking rent; high-income renter base; 6,974 units permitted in Orange County in 2024 (3,839 in 5+ unit buildings).
Forward outlook
- In year one you build about $128k of equity ($10k loan paydown + $118k appreciation (8.3% local appreciation)).
- Orange County population projected at +14% by 2050 — modest demand growth; plan on rents tracking national, not racing it.
- By year 2, paydown + projected appreciation supports a ~$205k cash-out refi (75% LTV) — recoverable capital for the next deal without selling this one.
Negotiation context
- It's been on market 141 days — a 12% lower offer ($1.26M) is reasonable based on typical stale-listing flexibility.
- 13 sale attempts since 21y ago with the ask held roughly flat each time — persistent listings suggest the price (not the market) is what's stuck; bring a comps-based counter.
- Current owner paid $790k; list at $1.43M implies a 81% gain — meaningful room to come down on a strong offer.
Risks & watch-outs
- Climate carrying-cost: extreme-heat days projected 2→7/yr by 2055 (HVAC capex compounding) — expect insurance premiums to compound above CPI over the hold.
Questions for the listing agent
- What do current leases actually rent for vs. the listed asking? Can we see a recent rent roll and the last 12 months of T-12 income?
- It's been on market 141 days. Have you received any prior offers? Is the seller open to a 54% concession, seller financing, or rate buy-down credit?
- What does the HOA fee cover, when was the last increase, and are there any pending special assessments or reserve-fund shortfalls?
- Why hasn't it sold? Are there any deal-killer items the seller is aware of (foundation, flood, title, zoning, code violations)?
- Is there a deadline driving the sale (1031 exchange, divorce, estate, relocation)? That informs how much negotiation room exists.
- The area grade is low — what's the realistic commute time and amenity access for the typical tenant pool here? Any planned neighborhood developments (good or bad) we should know about?
- What's the average days-on-market for RENTAL listings here right now (not sales)? A rising rental-DOM trend means longer vacancies and softer asking-rent achievability than the comps imply.
- What's the recent tenant-quality profile in this submarket — average credit score on applications, eviction rate, late-payment / NSF rate, and stable-employment percentage? A property-management company in the area should have these aggregated.
- How much new for-sale + rental construction is in the pipeline within 1–3 miles? Heavy new supply typically softens prices + rents 12–24 months out; constrained supply supports both.
Investment metrics
- 1% rule
- 0.46% ✗
- Cap rate
- 2.64%
- Cash-on-cash
- -13.03%
- DSCR
- 0.42
- GRM
- 18.2
CMA / ARV
- ARV (median comp)
- $1,739,259
- List price
- $1,430,000
- Delta
- -17.78%
- Verdict
- UNDERPRICED
- Comps
- 20 within 1.0 mi
Show comp detail 12 sales within ~0.75 mi
| Address | Dist | Beds/Ba | Sqft | Sold | Price | $/sf | Match |
|---|---|---|---|---|---|---|---|
| 24232 Porto Nuovo | 0.74mi | 2/2.0 | 1,625 (-0%) | 2mo | $2,350,000 | $1,446 | 61 |
| 23731 Colima Bay | 0.59mi | 2/2.0 | 1,542 (-6%) | 1mo | $2,850,000 | $1,848 | 60 |
| 33003 Christina | 0.34mi | 3/2.0 (+1) | 1,440 (-12%) | 4mo | $1,550,000 | $1,076 | 55 |
| 23915 Danzig | 0.57mi | 3/2.0 (+1) | 1,589 (-3%) | 9mo | $2,300,000 | $1,447 | 55 |
| 24851 Seagate | 0.71mi | 2/2.5 | 1,748 (+7%) | 2mo | $1,545,000 | $884 | 53 |
| 24 Imperatrice | 0.47mi | 3/3.0 (+1) | 1,789 (+10%) | 4mo | $1,851,000 | $1,035 | 52 |
| 33792 Blue Lantern St | 0.62mi | 2/2.5 | 1,502 (-8%) | 8mo | $2,515,000 | $1,674 | 51 |
| 23835 BLUEHILL Bay | 0.53mi | 3/2.0 (+1) | 1,754 (+8%) | 7mo | $3,300,000 | $1,881 | 50 |
| 24135 Windward Dr | 0.54mi | 3/2.0 (+1) | 1,515 (-7%) | 9mo | $2,700,000 | $1,782 | 48 |
| 23782 Perth Bay | 0.74mi | 3/2.0 (+1) | 1,758 (+8%) | 6mo | $2,610,000 | $1,485 | 40 |
| 33551 Sandcastle Ct | 0.71mi | 3/2.5 (+1) | 1,819 (+12%) | 8mo | $1,560,000 | $858 | 36 |
| 23741 Montego Bay | 0.71mi | 3/2.0 (+1) | 1,425 (-13%) | 6mo | $4,200,000 | $2,947 | 34 |
Match score weights: distance 35% · size 25% · config 20% · recency 20%. Top-matched comps best support the ARV.
Projected returns pro-forma
8.28% appreciation · 4.16% rent growth · sell at horizon
- IRR
- 11.3%
- Equity multiple
- 1.86×
- Total profit
- $345,282
- Equity at exit
- $1,113,500
- IRR
- 12.2%
- Equity multiple
- 4.06×
- Total profit
- $1,225,463
- Equity at exit
- $2,236,636
Cash invested: $400,400 (down + closing). Projections, not guarantees.
Landlord ↔ Tenant lean methodology
- Overall (STATE)
- 18 Strongly Tenant-Friendly
- State California
- 18 Strongly Tenant-Friendly · D+13
- County
- — inherits STATE
- City
- — inherits STATE
ZIP-level market 92629
- Home prices YoY
- 1.8%
- Rents YoY
- 4.2%
- Active inventory
- 89
- Price-to-rent
- 18.2×
Monthly cashflow live
- Estimated rent
- $6,554 high interval (Pro) →
- Mortgage (P&I)
- −$7,499
- Tax from tax record
- −$1,072 /mo · $12,864/yr
- Insurance
- −$596
- HOA
- −$358
- Vacancy / Maint / Mgmt
- −$1,376
- Net cashflow
- $-4,347
Break-even live
Sensitivity live
| Price | -10% $-3,538 | -5% $-3,942 | +0% $-4,347 | +5% $-4,752 | +10% $-5,157 |
|---|---|---|---|---|---|
| Rent | -10% $-4,865 | -5% $-4,606 | +0% $-4,347 | +5% $-4,088 | +10% $-3,829 |
| Rate | -1.0pp $-3,627 | -0.5pp $-3,984 | base $-4,347 | +0.5pp $-4,718 | +1.0pp $-5,095 |
UW: 25.0% down · 7.5% · 30yr · 1.5% tax · 5.0% vac · 8.0% maint · 8.0% mgmt
Financing live
Cash to close
- Down payment
- $357,500
- Closing costs
- $42,900
- Reserves months
- —
- Total cash needed
- —
Loan-product check · same deal, 3 products live
Conventional
25% down · 7.5% · 30yr
- Down + closing
- —
- Monthly P&I
- —
- Monthly cashflow
- —
- DSCR
- —
- Eligible?
- —
Personal DTI + credit; lowest rate.
DSCR
20% down · 8.5% · 30yr
- Down + closing
- —
- Monthly P&I
- —
- Monthly cashflow
- —
- DSCR
- —
- Eligible?
- —
No personal income docs; deal must DSCR.
Hard money
10% down · 12.0% · 12mo
- Down + closing
- —
- Monthly P&I
- —
- Monthly cashflow
- —
- DSCR
- —
- Eligible?
- —
Short-term bridge; refi at stabilization.
Rent comps 40 comps
| Address | Beds | Baths | Sqft | Rent | $/sqft | DOM | Units | Dist |
|---|---|---|---|---|---|---|---|---|
| 51 Saint John Dana Point, CA | 3.0 | 2.0 | 2018 | $6,150 | $3.05 | 45d | 1 | 0.15mi |
| 31 Antigua Dana Point, CA | 3.0 | 2.5 | 2100 | $6,000 | $2.86 | 1d | 1 | 0.19mi |
| 24301 Taxco Dr Dana Point, CA | 3.0 | 2.0 | 1213 | $4,950 | $4.08 | 16d | 1 | 0.19mi |
| 37 Regina Dana Point, CA | 3.0 | 2.5 | 1960 | $7,500 | $3.83 | 1d | 1 | 0.32mi |
| 5 Duquesa Dana Point, CA | 3.0 | 2.5 | 1969 | $6,000 | $3.05 | 1d | 1 | 0.36mi |
| 25 Centre Ct #90 Dana Point, CA | 2.0 | 2.0 | 1357 | $7,000 | $5.16 | 45d | 1 | 0.37mi |
| 6 Marquesa Dana Point, CA | 3.0 | 2.5 | 1969 | $11,000 | $5.59 | 45d | 1 | 0.37mi |
| 33565 Via Corvalian Dana Point, CA | 3.0 | 2.5 | 1422 | $6,500 | $4.57 | 45d | 1 | 0.40mi |
| 33581 Moonsail Dr Dana Point, CA | 2.0 | 2.0 | 1500 | $6,500 | $4.33 | 45d | 1 | 0.41mi |
| 24412 Lantern Hill Dr Unit E Dana Point, CA | 2.0 | 2.0 | 1106 | $4,250 | $3.84 | 45d | 1 | 0.41mi |
| 32 Dauphin Dana Point, CA | 3.0 | 3.0 | 1603 | $11,750 | $7.33 | 20d | 1 | 0.42mi |
| 21 Tennis Villas Dr #64 Dana Point, CA | 2.0 | 2.0 | 1357 | $5,250 | $3.87 | 1d | 1 | 0.42mi |
| 33611 Marlinspike Dr Dana Point, CA | 3.0 | 3.0 | 1949 | $11,000 | $5.64 | 45d | 1 | 0.42mi |
| 33391 Periwinkle Dr Dana Point, CA | 3.0 | 2.0 | 1782 | $15,000 | $8.42 | 20d | 1 | 0.43mi |
| 33611 Flying Jib Dr Dana Point, CA | 3.0 | 2.0 | 1482 | $9,000 | $6.07 | 45d | 1 | 0.43mi |
| 7 Wimbledon Ct Dana Point, CA | 2.0 | 2.0 | 1450 | $5,600 | $3.86 | 26d | 1 | 0.44mi |
| 33232 Christina Dr Dana Point, CA | 3.0 | 2.0 | 1260 | $5,400 | $4.29 | 26d | 1 | 0.46mi |
| 33651 Crossjack Dr Dana Point, CA | 2.0 | 2.0 | 1628 | $12,000 | $7.37 | 12d | 1 | 0.47mi |
| 24561 Harbor View Dr #13 Dana Point, CA | 3.0 | 2.5 | 1685 | $5,100 | $3.03 | 16d | 1 | 0.49mi |
| 33681 Marlinspike Dr Dana Point, CA | 2.0 | 2.0 | 1500 | $7,500 | $5.00 | 45d | 1 | 0.49mi |
| 33672 Chula Vista Ave Unit C Dana Point, CA | 3.0 | 3.0 | 2200 | $7,495 | $3.41 | 9d | 1 | 0.50mi |
| 24601 Harbor View Dr Dana Point, CA | 3.0 | 3.0 | 1685 | $5,395 | $3.20 | 19d | 1 | 0.50mi |
| 24601 Harbor View Dr Unit B Dana Point, CA | 3.0 | 2.5 | 1685 | $5,395 | $3.20 | 16d | 1 | 0.50mi |
| 33721 Flying Jib Dr Dana Point, CA | 3.0 | 2.0 | 1400 | $8,500 | $6.07 | 45d | 1 | 0.54mi |
| 33685 Granada Dr Dana Point, CA | 2.0 | 2.0 | 1986 | $6,900 | $3.47 | 45d | 1 | 0.56mi |
| 32951 Danapine Dana Point, CA | 3.0 | 2.5 | 1837 | $7,800 | $4.25 | 45d | 1 | 0.59mi |
| 33212 Ocean Bright Dana Point, CA | 2.0 | 3.0 | 1334 | $4,400 | $3.30 | 6d | 1 | 0.59mi |
| 50 Corniche Dr Unit G Dana Point, CA | 2.0 | 2.0 | 1165 | $4,995 | $4.29 | 20d | 1 | 0.62mi |
| 33431 Nottingham Way Unit A Dana Point, CA | 3.0 | 2.0 | 1400 | $4,750 | $3.39 | 9d | 1 | 0.62mi |
| 68 Corniche Dr Unit B Dana Point, CA | 2.0 | 2.0 | 1130 | $5,995 | $5.31 | 45d | 1 | 0.62mi |
| 54 Corniche Dr Unit D Dana Point, CA | 2.0 | 2.0 | 1165 | $4,500 | $3.86 | 45d | 1 | 0.62mi |
| 24065 Windward Dr Dana Point, CA | 3.0 | 3.5 | 1750 | $10,000 | $5.71 | 45d | 1 | 0.62mi |
| 33792 Chula Vista Ave Dana Point, CA | 3.0 | 3.0 | 1400 | $7,950 | $5.68 | 45d | 1 | 0.63mi |
| 25 Ville Franche Dana Point, CA | 3.0 | 2.5 | 2000 | $11,000 | $5.50 | 45d | 1 | 0.64mi |
| 56 Sea Terrace St Dana Point, CA | 1.0–3.0 | 1.0–2.5 | 856 | $3,830 | $4.47 | 1d | 19 | 0.65mi |
| 33792 Granada Dr Dana Point, CA | 2.0 | 2.0 | 1200 | $5,500 | $4.58 | 6d | 1 | 0.66mi |
| 10 Corniche Dr Unit E Dana Point, CA | 2.0 | 2.0 | 1130 | $4,500 | $3.98 | 45d | 1 | 0.67mi |
| 24612 Polaris Dr #271 Dana Point, CA | 3.0 | 3.0 | 2090 | $6,000 | $2.87 | 45d | 1 | 0.67mi |
| 23862 Marmara Bay Dana Point, CA | 3.0 | 2.0 | 1589 | $8,300 | $5.22 | 26d | 1 | 0.68mi |
| 24076 Gourami Bay Dana Point, CA | 3.0 | 2.5 | 1698 | $6,950 | $4.09 | 45d | 1 | 0.69mi |
HOA detail
- Monthly dues
- $358 · $4,296/yr
- Likely covers
- security
Listing history 31 events
-
2026-06-18statusdays on market $1,430,000 Active 141 DOM
-
2026-05-02status Active
-
2026-04-22historical Active Under Contract
-
2026-04-22status Active
-
2026-04-20historical
-
2026-04-08status Active
-
2026-03-25status Active
-
2026-03-07status Pending Sale
-
2026-01-14status Active
-
2026-01-14historical Active Under Contract
-
2025-11-25$1,430,000 Active
-
2025-03-14status Active
-
2025-02-26status Active
-
2025-02-10historical Active Under Contract
-
2024-08-23$1,480,000 Active
-
2024-08-08historical
-
2018-10-16status Active
-
2018-10-16historical
-
2018-09-02status Pending Sale
-
2018-09-01historical Hold Do Not Show
-
2018-08-21price $785,000
-
2018-08-10price $810,000
-
2018-07-30$839,000 Active
-
2013-05-05historical Hold
-
2013-05-01$650,000 Active
-
2005-05-09soldstatus $790,000
-
2005-05-09soldstatus $790,000
-
2005-03-23$790,000
-
2003-10-28soldstatus $550,000
-
1998-07-24soldstatus $324,000
-
1991-04-09soldstatus $285,500
ⓘ Source: listings_history table (triggers on properties + properties_extension) + one-shot
backfill from property_details.listing_events for pre-trigger history.
Tax reassessment forecast CA · Resets to sale price
- Current annual tax
- $12,864 · $1,072/mo
- Projected year-2 tax
- $12,864 · $1,072/mo
- Expected delta
- $0/yr ($0/mo · 0.0%)
ⓘ Screening estimate from a state-policy table — verify with the county assessor before closing.
Climate risk First Street
- Flood 1/10 Low FEMA zone X (unshaded) · 0% chance over 30 yrs
- Wildfire 1/10 Low
- Heat 5/10 Major 2 d/yr ≥84°F today · 7 d/yr by 30 yrs out
- Wind 1/10 Low
- Air quality 4/10 Moderate 5 unhealthy d/yr today · 5 by 30 yrs out
Nearby sold comps map
Loading sold comps map…
Walkable amenities ~0.75 mi
Loading nearby amenities…
Taxation est. · year 1
- Rental income
- $78,648
- − Mortgage interest
- −$80,102
- − Property taxes
- −$12,864
- − Insurance
- −$7,150
- − Repairs & maintenance
- −$6,292
- − Management
- −$6,292
- − HOA
- −$4,296
- − Depreciation
- −$41,600
- Taxable loss
- −$79,948
- Est. tax savings @ 24.0%
- +$19,187
- After-tax cash flow
- $-32,979/yr
For passive investors: Depreciation is non-cash, so a rental often shows a tax loss while cash-flowing — sheltering income. Rental losses are passive: they offset passive income freely, and up to $25,000/yr can offset ordinary (W-2) income if you actively participate and your MAGI is under $100k (phasing out to $0 by $150k); unused losses carry forward. On sale, claimed depreciation is recaptured at up to 25%, and gains may owe capital-gains tax (a 1031 exchange can defer both). Figures are a year-1 estimate at your 24.0% rate — not tax advice; consult a CPA.
Schools (NCES district)
- District
- Capistrano Unified
- NCES district ID
- 0607440
- Math proficiency
- 50% ▼ -11.00%
- Reading proficiency
- 72% ▲ 2.00%
- Median HH income
- $99,673
- Composite
- 56.56/100
- National rank
- #1147
- State rank
- #64 of 517 in CA
Livability — Dana Point
- Score
- 65/100
- State rank
- #398
- US rank
- #13526
Category grades
Schools grade is shown separately in the Schools card above.
Census & demographics
- Census place
- Dana Point, CA
- County
- Orange County · 3,096,323 people
- City population
- 32,790
- Metro
- Los Angeles-Long Beach-Anaheim, CA
- Population (ZIP)
- 25,579
- Household income
- $142,807
- Rent vs Own
- Severe rent burden
- 1161.0
Population outlook (Orange County) Hauer SSP2
- Today (2025)
- 3,477,456 people
- By 2030
- 3,613,117 · +3.9%
- By 2040
- 3,835,945 · +10.3%
- By 2050
- 3,968,736 · +14.1%
- By 2075
- 4,097,053 · +17.8%
- By 2100
- 3,903,633 · +12.3%
Race, ethnicity, and origin ACS 2023
- Neighborhood character
- Predominantly White (73%)
- Race & ethnicity
- White 73% Hispanic / Latino 14% Two or more races 11% Asian 4% Black 2%
- Hispanic origin (detail)
- Mexican 10%
- Common ancestry
- Italian 4% Slovak 3% Romanian 3%
- Foreign-born
- 14% · Canada, Vietnam
- Languages at home
- 84% English-only · Spanish 7% Other Indo-European 3% Tagalog/Filipino 1%
Political lean MEDSL · Orange
- 2024 margin
- Toss-up / Even · D 49.7% · R 47.1% · Other 3.2%
- 2008→2024 swing
- +5.2pp toward D · 2008: -2.6pp · 2024: 2.6pp
- All cycles
- 2024: D+2.6 2020: D+9.0 2016: D+7.7 2012: R+8.3 2008: R+2.6
Not yet ingested
- Civics
- —
Market trends
- HPI YoY
- ▲ 8.28%
- Current HPI
- 461.7852
- Rent YoY
- ▲ 4.16%
- Metro
- Los Angeles-Long Beach-Anaheim, CA
- State GDP YoY
- ▲ 3.21%
- F500 in state
- 116
Industry mix (Fortune 500 HQ in CA)
| Industry | F500 HQs | Revenue |
|---|---|---|
| Technology | 27 | $1,492B |
|
||
| Financial Services | 3 | $174B |
|
||
| Retail | 3 | $44B |
|
||
| Insurance | 3 | $26B |
|
||
| Media / Entertainment | 2 | $115B |
|
||
| Pharmaceuticals / Biotech | 2 | $62B |
|
||
Price history
+400.9% since first listed30 events — show timeline
- 2026-05-02 Relisted — CRMLS
- 2026-04-22 Contingent — CRMLS
- 2026-04-22 Relisted — CRMLS
- 2026-04-20 Listing Removed — CRMLS
- 2026-04-08 Relisted — CRMLS
- 2026-03-25 Relisted — CRMLS
- 2026-03-07 Pending — CRMLS
- 2026-01-14 Relisted — CRMLS
- 2026-01-14 Contingent — CRMLS
- 2025-11-25 Listed $1,430,000 CRMLS
- 2025-03-14 Relisted — CRMLS
- 2025-02-26 Relisted — CRMLS
- 2025-02-10 Contingent — CRMLS
- 2024-08-23 Listed $1,480,000 CRMLS
- 2024-08-08 Coming Soon — CRMLS
- 2018-10-16 Relisted — CRMLS
- 2018-10-16 Listing Removed — CRMLS
- 2018-09-02 Pending — CRMLS
- 2018-09-01 Delisted — CRMLS
- 2018-08-21 Price Changed $785,000 CRMLS
- 2018-08-10 Price Changed $810,000 CRMLS
- 2018-07-30 Listed $839,000 CRMLS
- 2013-05-05 Delisted — CRMLS
- 2013-05-01 Listed $650,000 CRMLS
- 2005-05-09 Sold (Public Records) $790,000 Public Records
- 2005-05-09 Sold (MLS) $790,000 CRMLS
- 2005-03-23 Listed $790,000 CRMLS
- 2003-10-28 Sold (Public Records) $550,000 Public Records
- 1998-07-24 Sold (Public Records) $324,000 Public Records
- 1991-04-09 Sold (Public Records) $285,500 Public Records
Property tax history
+2.6%/yrLatest (2025): $12,864 · +2.8% YoY. Source: county tax records.
Cash-flow waterfall
monthlySold comps — $/sqft
last 12 mo · ≤1 miLoading sold comps…