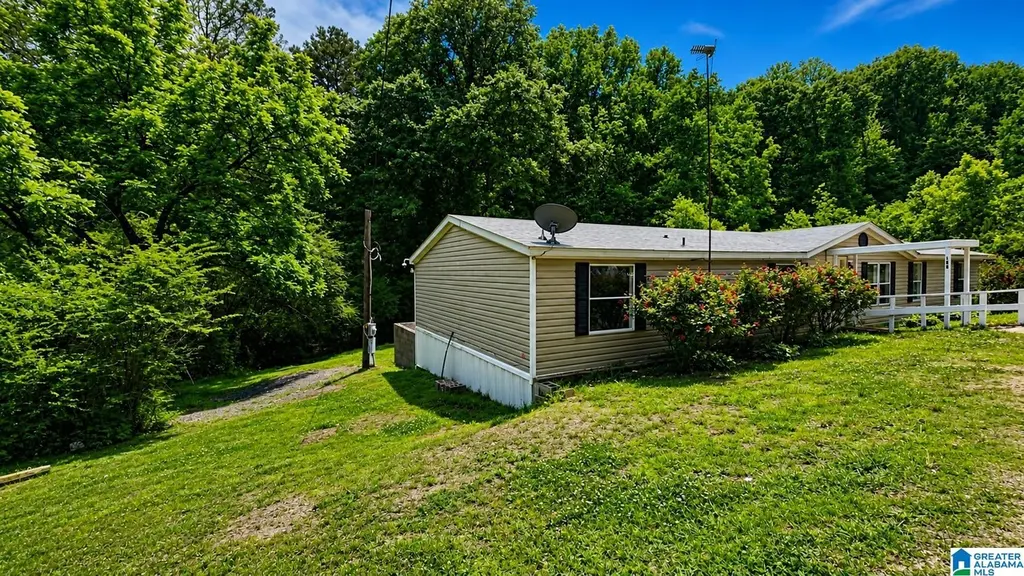
105 21st St · Carbon Hill, AL
Flood risk 9/10 · Severe
- FEMA flood zone
- X (unshaded)
- Chance of flooding over 30 yrs
- 0.99%
- Est. flood insurance / yr
- $507 – $1,088
Fire risk 5/10 · Moderate
- Est. fire insurance / yr
- $916 – $1,700
Heat risk 5/10 · Moderate
- Hot days now (above 107°F)
- 7 days/yr
- Hot days in 30 yrs
- 19 days/yr
Wind risk 6/10 · Moderate
- Chance of severe wind over 30 yrs
- 27.0%
Air-quality risk 3/10 · Minor
- Unhealthy air days now
- 2 days/yr
- Unhealthy air days in 30 yrs
- 3 days/yr
Risk factors via First Street. Map © Google.
Why this score? — see what drove the C grade
The composite is a weighted blend of 9 inputs, each scored 0–100. Each bar is that input's sub-score; the figure is the points it added to the 100-point composite (weight × sub-score).
- Cash flow +22.4/30.0
- ARV discount +7.5/15.0
- DSCR +7.2/10.0
- 1% rule +5.9/10.0
- Appreciation +5.0/10.0
- Livability +3.1/5.0
- Rent growth +2.5/5.0
- Condition / age +2.5/5.0
- Schools +2.2/10.0
$118,400
🖨 Deal sheet 📄 Offer letter ✓ Due diligence
Listing remarks MLS
Manufactured double wide in need of a few repairs located in the middle of Townley. Sold as is. Motivated seller call today!
Key facts
- 8,712 sq ft lot
- Built 2004
- Listed 44 days
Property features AI
Finance
- Other: Parcel ID: 19-06-13-0-000-020.001
- Financial info: Quarterly garbage fee
- HOA & community: No association fee
Exterior
- Parking: Driveway parking; Off-street parking; On-street parking; Parking at multiple levels
- Utilities: Public water; Septic system; Electric water heater; Internet service available
- Home design: Single-story layout (all listed rooms on main level); Vinyl siding
- Construction: Vinyl siding construction; Crawl space foundation; Existing (previously built) property
- Exterior features: Covered and open decks; Covered patio; Porch; Workshop; No pool; Not waterfront
Interior
- Kitchen: Laminate countertops; Electric cooktop; Built-in dishwasher; Electric oven
- Bedrooms: Master bedroom on main level; Additional bedrooms on main level
- Flooring: Vinyl
- Bathrooms: Two full bathrooms; Master bathroom with garden tub, separate shower and separate vanities; Additional bathroom with tub/shower combo
- Heating & cooling: Central heating; Central air conditioning; Window units
- Interior features: Split bedroom layout; Vinyl flooring; Tile fireplace in the family room; One wood-burning fireplace; Ceilings: other (see remarks)
- Laundry & utility: Main-level laundry room; Washer hookup; Electric dryer hookup
Neighborhood map
What this means for you Summary
Snapshot
- This is a 4-bed/2.0-bath manufactured listed at $118k.
Deal economics
- At list price, monthly cash flow is $130 ($2k/yr) — positive.
- The deal already cash-flows at list — no discount required.
- Meets the 1% rule at list price ($1k rent vs $118k).
- Recommended offer: $115k (3.0% below list) — sets the bar for market timing.
Location & tenants
- Location reads 62/100 on livability (#208 in AL) — a middle-class / working-renter tenant base. Strengths: crime A+, cost of living A+, housing A+; Watch: health & safety D, amenities F, commute F.
- Walker County (rural): math 13% / reading 39% proficiency, ranked #89 of 129 in AL (top 69%) — low school quality limits family demand, transient renter base, plan for 1-2y turnover.
- Zoned schools: Carbon Hill Elementaryjunior High School (math 13% / reading 31%, grade F, #442 of 627 statewide, top 72%, 492 students, 70% FRL); Carbon Hill High School (math 12% / reading 17%, grade F, #220 of 305 statewide, top 77%, 359 students, 66% FRL).
- Market conditions: 3 active listings in the ZIP; 36 units permitted in Walker County in 2024 (0 in 5+ unit buildings).
Forward outlook
- In year one you build about $4k of equity ($819 loan paydown + $4k appreciation (3.0% local appreciation)).
- Walker County population projected at -21% by 2050 — secular population decline; favor cash flow + early exit over multi-decade hold.
- At projected returns (3.0% appreciation + 3.0% rent growth), your $33k cash investment doubles in ~5 years — after that, you're playing with house money.
- By year 8, paydown + projected appreciation supports a ~$32k cash-out refi (75% LTV) — recoverable capital for the next deal without selling this one.
Negotiation context
- It's been on market 44 days — a 3% lower offer ($115k) is reasonable based on typical stale-listing flexibility.
- 2 sale attempts; this cycle's ask has dropped $6k (5%) from the opening price — seller is motivated, your offer sets the floor, not the list.
- Current owner paid $35k; list at $118k implies a 237% gain — meaningful room to come down on a strong offer.
Risks & watch-outs
- Watch-outs: flood insurance adds $66/mo.
- Climate carrying-cost: severe flood risk; major wind risk, 27% chance of damaging wind over 30y; moderate wildfire risk; extreme-heat days projected 7→19/yr by 2055 (HVAC capex compounding) — expect insurance premiums to compound above CPI over the hold.
Questions for the listing agent
- It's been on market 44 days. Have you received any prior offers? Is the seller open to a 3% concession, seller financing, or rate buy-down credit?
- What's the actual annual flood-insurance premium (NFIP or private), and is the property in a SFHA with mandatory coverage?
- Is there a deadline driving the sale (1031 exchange, divorce, estate, relocation)? That informs how much negotiation room exists.
- Schools are F-rated, which usually means shorter tenancies and higher turnover. Who's the typical renter profile here, and what's been the actual vacancy rate?
- What's the average days-on-market for RENTAL listings here right now (not sales)? A rising rental-DOM trend means longer vacancies and softer asking-rent achievability than the comps imply.
- What's the recent tenant-quality profile in this submarket — average credit score on applications, eviction rate, late-payment / NSF rate, and stable-employment percentage? A property-management company in the area should have these aggregated.
- How much new for-sale + rental construction is in the pipeline within 1–3 miles? Heavy new supply typically softens prices + rents 12–24 months out; constrained supply supports both.
Investment metrics
- 1% rule
- 1.09% ✓
- Cap rate
- 8.29%
- Cash-on-cash
- 7.13%
- DSCR
- 1.32
- GRM
- 7.7
CMA / ARV
No comps found within radius.
Projected returns pro-forma
3.0% appreciation · 3.0% rent growth · sell at horizon
- IRR
- 11.9%
- Equity multiple
- 1.68×
- Total profit
- $22,632
- Equity at exit
- $53,238
- IRR
- 14.0%
- Equity multiple
- 3.08×
- Total profit
- $69,025
- Equity at exit
- $82,046
Cash invested: $33,152 (down + closing). Projections, not guarantees.
Landlord ↔ Tenant lean methodology
- Overall (STATE)
- 90 Strongly Landlord-Friendly
- State Alabama
- 90 Strongly Landlord-Friendly · R+15
- County
- — inherits STATE
- City
- — inherits STATE
ZIP-level market 35587
- Active inventory
- 3
- Price-to-rent
- 7.7×
Monthly cashflow live
- Estimated rent
- $1,285 medium interval (Pro) →
- Mortgage (P&I)
- −$621
- Tax est. 1.5%
- −$148 /mo · $1,776/yr
- Insurance
- −$49
- Flood insurance flood zone
- −$66 /mo · $798/yr
- HOA
- −$0
- Vacancy / Maint / Mgmt
- −$270
- Net cashflow
- $130
Break-even live
UW: 25.0% down · 7.5% · 30yr · 1.5% tax · 5.0% vac · 8.0% maint · 8.0% mgmt
Financing live
Cash to close
- Down payment
- $29,600
- Closing costs
- $3,552
- Reserves months
- —
- Total cash needed
- —
Loan-product check · same deal, 3 products live
Conventional
25% down · 7.5% · 30yr
- Down + closing
- —
- Monthly P&I
- —
- Monthly cashflow
- —
- DSCR
- —
- Eligible?
- —
Personal DTI + credit; lowest rate.
DSCR
20% down · 8.5% · 30yr
- Down + closing
- —
- Monthly P&I
- —
- Monthly cashflow
- —
- DSCR
- —
- Eligible?
- —
No personal income docs; deal must DSCR.
Hard money
10% down · 12.0% · 12mo
- Down + closing
- —
- Monthly P&I
- —
- Monthly cashflow
- —
- DSCR
- —
- Eligible?
- —
Short-term bridge; refi at stabilization.
Listing history 20 events
-
2026-06-18days on market $118,400 Active 44 DOM
-
2026-06-17days on market $118,400 Active 43 DOM
-
2026-06-16days on market $118,400 Active 42 DOM
-
2026-06-15days on market $118,400 Active 41 DOM
-
2026-06-13pricedays on market $118,400 Active 39 DOM
-
2026-06-13days on market $118,900 Active 38 DOM
-
2026-06-10days on market $118,900 Active 36 DOM
-
2026-06-09days on market $118,900 Active 35 DOM
-
2026-06-08days on market $118,900 Active 34 DOM
-
2026-06-07days on market $118,900 Active 33 DOM
-
2026-06-05days on market $118,900 Active 30 DOM
-
2026-06-03pricedays on market $118,900 Active 29 DOM
-
2026-06-03days on market $119,400 Active 28 DOM
-
2026-06-01days on market $119,400 Active 27 DOM
-
2026-05-31days on market $119,400 Active 26 DOM
-
2026-05-14price $119,900 959-char remark
-
2026-05-05$124,900 Active 959-char remark
-
2025-11-19soldstatus $35,113 Closed 124-char remark
Show marketing remark (124 chars)
Manufactured double wide in need of a few repairs located in the middle of Townley. Sold as is. Motivated seller call today!
-
2025-10-01status Pending 124-char remark
Show marketing remark (124 chars)
Manufactured double wide in need of a few repairs located in the middle of Townley. Sold as is. Motivated seller call today!
-
2025-09-26$35,000 Active 124-char remark
Show marketing remark (124 chars)
Manufactured double wide in need of a few repairs located in the middle of Townley. Sold as is. Motivated seller call today!
ⓘ Source: listings_history table (triggers on properties + properties_extension) + one-shot
backfill from property_details.listing_events for pre-trigger history.
Climate risk First Street
- Flood 9/10 Extreme FEMA zone X (unshaded) · 99% chance over 30 yrs
- Wildfire 5/10 Major
- Heat 5/10 Major 7 d/yr ≥107°F today · 19 d/yr by 30 yrs out
- Wind 6/10 Major 27% chance of damaging wind over 30 yrs
- Air quality 3/10 Moderate 2 unhealthy d/yr today · 3 by 30 yrs out
Nearby sold comps map
Loading sold comps map…
Walkable amenities ~0.75 mi
Loading nearby amenities…
Taxation est. · year 1
- Rental income
- $15,420
- − Mortgage interest
- −$6,632
- − Property taxes
- −$1,776
- − Insurance
- −$1,390
- − Repairs & maintenance
- −$1,234
- − Management
- −$1,234
- − Depreciation
- −$3,444
- Taxable loss
- −$289
- Est. tax savings @ 24.0%
- +$69
- After-tax cash flow
- $1,635/yr
For passive investors: Depreciation is non-cash, so a rental often shows a tax loss while cash-flowing — sheltering income. Rental losses are passive: they offset passive income freely, and up to $25,000/yr can offset ordinary (W-2) income if you actively participate and your MAGI is under $100k (phasing out to $0 by $150k); unused losses carry forward. On sale, claimed depreciation is recaptured at up to 25%, and gains may owe capital-gains tax (a 1031 exchange can defer both). Figures are a year-1 estimate at your 24.0% rate — not tax advice; consult a CPA.
Schools (NCES district)
- District
- Walker County
- NCES district ID
- 0103450
- Math proficiency
- 13% ▼ -28.00%
- Reading proficiency
- 39% ▼ -5.00%
- Median HH income
- $36,664
- Composite
- 21.51/100
- National rank
- #8321
- State rank
- #89 of 129 in AL
Livability — Carbon Hill
- Score
- 62/100
- State rank
- #208
- US rank
- #16127
Category grades
Schools grade is shown separately in the Schools card above.
Census & demographics
- Population (ZIP)
- 694
Population outlook (Walker County) Hauer SSP2
- Today (2025)
- 61,037 people
- By 2030
- 58,391 · -4.3%
- By 2040
- 53,080 · -13.0%
- By 2050
- 48,031 · -21.3%
- By 2075
- 37,799 · -38.1%
- By 2100
- 29,001 · -52.5%
Race, ethnicity, and origin ACS 2023
- Neighborhood character
- Predominantly White (98%)
- Race & ethnicity
- White 98% Two or more races 2%
- Common ancestry
- Lithuanian 1% Iranian 1%
Political lean MEDSL · Walker
- 2024 margin
- Solid R (+71.8) · D 13.8% · R 85.6%
- 2008→2024 swing
- -25.4pp toward R · 2008: -46.4pp · 2024: -71.8pp
- All cycles
- 2024: R+71.8 2020: R+67.9 2016: R+67.4 2012: R+52.9 2008: R+46.4
Not yet ingested
- Civics
- —
Market trends
- HPI YoY
- —
- Current HPI
- —
- Rent YoY
- —
- Metro
- —
- State GDP YoY
- ▲ 2.94%
- F500 in state
- 4
Industry mix (Fortune 500 HQ in AL)
| Industry | F500 HQs | Revenue |
|---|---|---|
| Financial Services | 1 | $8B |
|
||
| Healthcare | 1 | $5B |
|
||
Price history
+238.3% since first listed8 events — show timeline
- 2026-06-13 Price Changed $118,400 Greater Alabama MLS
- 2026-06-03 Price Changed $118,900 Greater Alabama MLS
- 2026-05-24 Price Changed $119,400 Greater Alabama MLS
- 2026-05-14 Price Changed $119,900 Greater Alabama MLS
- 2026-05-05 Listed $124,900 Greater Alabama MLS
- 2025-11-19 Sold (MLS) $35,113 Walker County Area MLS
- 2025-10-01 Pending — Walker County Area MLS
- 2025-09-26 Listed $35,000 Walker County Area MLS
Property tax history
+0.0%/yrLatest (2022): $177 · +0.0% YoY. Source: county tax records.
Cash-flow waterfall
monthlySold comps — $/sqft
last 12 mo · ≤1 miLoading sold comps…