11544 Maple Ave · Naples, NY
Flood risk 1/10 · Minimal
- FEMA flood zone
- X
- Chance of flooding over 30 yrs
- 0.0%
- Est. flood insurance / yr
- $507 – $1,088
Fire risk 2/10 · Minimal
- Est. fire insurance / yr
- $691 – $1,283
Heat risk 2/10 · Minimal
- Hot days now (above 89°F)
- 8 days/yr
- Hot days in 30 yrs
- 18 days/yr
Wind risk 1/10 · Minimal
- Chance of severe wind over 30 yrs
- —
Air-quality risk 1/10 · Minimal
- Unhealthy air days now
- 0 days/yr
- Unhealthy air days in 30 yrs
- 0 days/yr
Risk factors via First Street. Map © Google.
Why this score? — see what drove the B grade
The composite is a weighted blend of 9 inputs, each scored 0–100. Each bar is that input's sub-score; the figure is the points it added to the 100-point composite (weight × sub-score).
- Cash flow +30.0/30.0
- 1% rule +10.0/10.0
- DSCR +10.0/10.0
- ARV discount +7.5/15.0
- Schools +4.8/10.0
- Livability +3.4/5.0
- Rent growth +2.5/5.0
- Condition / age +2.5/5.0
- Appreciation +0.0/10.0
$59,000
🖨 Deal sheet 📄 Offer letter ✓ Due diligence
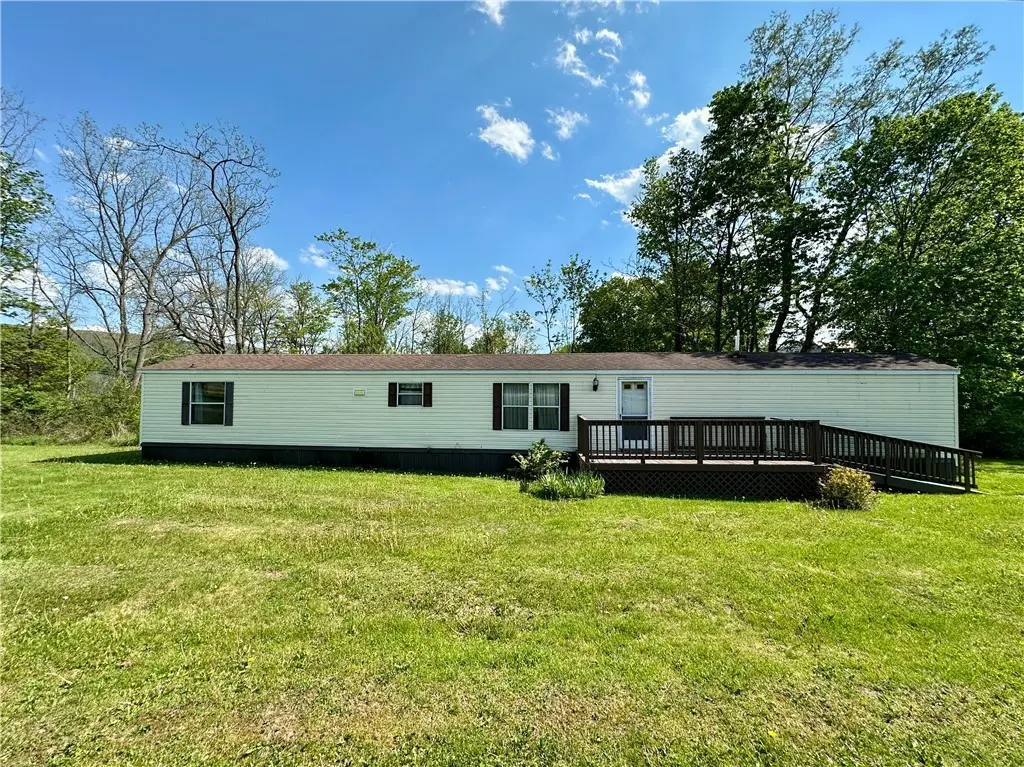
Listing remarks
Beautifully maintained 3 bedroom, 2 bath home on . 36 acres. New Decks with an access ramp making it easy to maneuver in all seasons. Roof and furnace are 7 years old and the hot water tank is only 2 years old. Driveway has potential to see the stone again underneath. All appliances are original, 1994.
Key facts
- Roof and furnace
- Hot water tank
- Driveway
Tags
Property features AI
Exterior
- Parking: No garage
- Utilities: Well water; Septic tank
- Home design: Single-wide mobile home; Single-story; Resale property
- Construction: Vinyl siding; Asphalt roof; Crawl space foundation; Built as existing (pre-owned)
- Exterior features: Gravel driveway; Shed(s) and storage; See remarks
Interior
- Kitchen: Gas oven; Gas range; Microwave; Refrigerator
- Bedrooms: Three main-level bedrooms
- Flooring: Carpet; Laminate; Varied flooring
- Bathrooms: Two full bathrooms (both on the main level)
- Heating & cooling: Propane forced-air heating
- Interior features: Eat-in kitchen; Kitchen open to family room; Main-level primary suite; Low-threshold shower; Accessible approach with ramp
- Laundry & utility: Main-level laundry; Washer; Dryer; Propane water heater
Neighborhood map
What this means for you Summary
Snapshot
- This is a 3-bed/2.0-bath manufactured listed at $59k.
Deal economics
- At list price, monthly cash flow is $671 ($8k/yr) — positive.
- The deal already cash-flows at list — no discount required.
- Meets the 1% rule at list price ($1k rent vs $59k).
- Cap rate 19.9% vs local median 1.1% in Naples — top-decile yield for the area; either an underpriced asset or a hidden risk that comps aren't pricing in. Stress-test before assuming the spread holds.
Location & tenants
- Location reads 67/100 on livability (#608 in NY) — a middle-class / working-renter tenant base. Strengths: cost of living A+, housing A+, health & safety A+; Watch: employment D, crime F, amenities F.
- Naples Central School District (rural): math 51% / reading 61% proficiency, ranked #292 of 590 in NY (top 50%) — acceptable for families but not a draw, mixed tenant base, ~2y average lease.
- Market conditions: 51 active listings in the ZIP; 196 units permitted in Steuben County in 2024 (0 in 5+ unit buildings).
Forward outlook
- Local home prices are declining (-3.0%/yr); year-one equity from $408 of loan paydown is wiped out by about $2k of value loss. Plan a longer hold.
- Steuben County population projected at -20% by 2050 — secular population decline; favor cash flow + early exit over multi-decade hold.
- At projected returns (-3.0% appreciation + 3.0% rent growth), your $17k cash investment doubles in ~3 years — after that, you're playing with house money.
Negotiation context
- Only 2 days on market — expect competitive offers; lowballing is unlikely to land.
Questions for the listing agent
- Is there a deadline driving the sale (1031 exchange, divorce, estate, relocation)? That informs how much negotiation room exists.
- Schools are B-rated — typically a magnet for longer-tenancy family renters. What's the average tenant stay here, and is there a school-zone premium baked into asking?
- Crime grade is F in this area — have there been break-ins, vandalism, or insurance claims at this property in the last 3 years? What carrier currently insures it and at what premium?
- What's the average days-on-market for RENTAL listings here right now (not sales)? A rising rental-DOM trend means longer vacancies and softer asking-rent achievability than the comps imply.
- What's the recent tenant-quality profile in this submarket — average credit score on applications, eviction rate, late-payment / NSF rate, and stable-employment percentage? A property-management company in the area should have these aggregated.
- How much new for-sale + rental construction is in the pipeline within 1–3 miles? Heavy new supply typically softens prices + rents 12–24 months out; constrained supply supports both.
Investment metrics
- 1% rule
- 2.34% ✓
- Cap rate
- 19.94%
- Cash-on-cash
- 48.76%
- DSCR
- 3.17
- GRM
- 3.6
CMA / ARV
No comps found within radius.
Projected returns pro-forma
-3.0% appreciation · 3.0% rent growth · sell at horizon
- IRR
- 46.3%
- Equity multiple
- 3.01×
- Total profit
- $33,216
- Equity at exit
- $8,797
- IRR
- 52.1%
- Equity multiple
- 6.09×
- Total profit
- $84,082
- Equity at exit
- $5,101
Cash invested: $16,520 (down + closing). Projections, not guarantees.
Landlord ↔ Tenant lean methodology
- Overall (STATE)
- 15 Strongly Tenant-Friendly
- State New York
- 15 Strongly Tenant-Friendly · D+10
- County
- — inherits STATE
- City
- — inherits STATE
ZIP-level market 14512
- Home prices YoY
- -4.3%
- Active inventory
- 51
- Price-to-rent
- 3.6×
Monthly cashflow live
- Estimated rent
- $1,380 medium interval (Pro) →
- Mortgage (P&I)
- −$309
- Tax from tax record
- −$85 /mo · $1,016/yr
- Insurance
- −$25
- HOA
- −$0
- Vacancy / Maint / Mgmt
- −$290
- Net cashflow
- $671
Break-even live
UW: 25.0% down · 7.5% · 30yr · 1.5% tax · 5.0% vac · 8.0% maint · 8.0% mgmt
Financing live
Cash to close
- Down payment
- $14,750
- Closing costs
- $1,770
- Reserves months
- —
- Total cash needed
- —
Loan-product check · same deal, 3 products live
Conventional
25% down · 7.5% · 30yr
- Down + closing
- —
- Monthly P&I
- —
- Monthly cashflow
- —
- DSCR
- —
- Eligible?
- —
Personal DTI + credit; lowest rate.
DSCR
20% down · 8.5% · 30yr
- Down + closing
- —
- Monthly P&I
- —
- Monthly cashflow
- —
- DSCR
- —
- Eligible?
- —
No personal income docs; deal must DSCR.
Hard money
10% down · 12.0% · 12mo
- Down + closing
- —
- Monthly P&I
- —
- Monthly cashflow
- —
- DSCR
- —
- Eligible?
- —
Short-term bridge; refi at stabilization.
Listing history 2 events
-
2026-05-20status Pending
-
2026-05-18$59,000 Active
ⓘ Source: listings_history table (triggers on properties + properties_extension) + one-shot
backfill from property_details.listing_events for pre-trigger history.
Tax reassessment forecast NY · Partial reset (capped growth)
- Current annual tax
- $1,016 · $85/mo
- Projected year-2 tax
- $1,016 · $85/mo
- Expected delta
- $0/yr ($0/mo · 0.0%)
ⓘ Screening estimate from a state-policy table — verify with the county assessor before closing.
Climate risk First Street
- Flood 1/10 Low FEMA zone X · 0% chance over 30 yrs
- Wildfire 2/10 Low
- Heat 2/10 Low 8 d/yr ≥89°F today · 18 d/yr by 30 yrs out
- Wind 1/10 Low
- Air quality 1/10 Low 0 unhealthy d/yr today · 0 by 30 yrs out
Nearby sold comps map
Loading sold comps map…
Walkable amenities ~0.75 mi
Loading nearby amenities…
Taxation est. · year 1
- Rental income
- $16,555
- − Mortgage interest
- −$3,305
- − Property taxes
- −$1,016
- − Insurance
- −$295
- − Repairs & maintenance
- −$1,324
- − Management
- −$1,324
- − Depreciation
- −$1,716
- Taxable income
- $7,574
- Est. tax owed @ 24.0%
- −$1,818
- After-tax cash flow
- $6,237/yr
For passive investors: Depreciation is non-cash, so a rental often shows a tax loss while cash-flowing — sheltering income. Rental losses are passive: they offset passive income freely, and up to $25,000/yr can offset ordinary (W-2) income if you actively participate and your MAGI is under $100k (phasing out to $0 by $150k); unused losses carry forward. On sale, claimed depreciation is recaptured at up to 25%, and gains may owe capital-gains tax (a 1031 exchange can defer both). Figures are a year-1 estimate at your 24.0% rate — not tax advice; consult a CPA.
Schools (NCES district)
- District
- Naples Central School District
- NCES district ID
- 3620220
- Math proficiency
- 51% ▼ -10.00%
- Reading proficiency
- 61% ▲ 9.00%
- Median HH income
- $51,934
- Composite
- 47.91/100
- National rank
- #2212
- State rank
- #292 of 590 in NY
Livability — Naples
- Score
- 67/100
- State rank
- #608
- US rank
- #10973
Category grades
Schools grade is shown separately in the Schools card above.
Census & demographics
- Population (ZIP)
- 4,908
Population outlook (Steuben County) Hauer SSP2
- Today (2025)
- 93,062 people
- By 2030
- 89,793 · -3.5%
- By 2040
- 82,353 · -11.5%
- By 2050
- 74,286 · -20.2%
- By 2075
- 55,589 · -40.3%
- By 2100
- 37,587 · -59.6%
Race, ethnicity, and origin ACS 2023
- Neighborhood character
- Predominantly White (95%)
- Race & ethnicity
- White 95% Two or more races 3%
- Common ancestry
- Romanian 4% Iranian 3% Lithuanian 2%
- Foreign-born
- 3% · Canada
- Languages at home
- 98% English-only · German/W. Germanic 1% Spanish 1%
Political lean MEDSL · Steuben
- 2024 margin
- Solid R (+31.8) · D 34.1% · R 65.9%
- 2008→2024 swing
- -15.0pp toward R · 2008: -16.8pp · 2024: -31.8pp
- All cycles
- 2024: R+31.8 2020: R+29.6 2016: R+36.2 2012: R+16.4 2008: R+16.8
Not yet ingested
- Civics
- —
Market trends
- HPI YoY
- ▼ -13.68%
- Current HPI
- 301.9192
- Rent YoY
- —
- Metro
- —
- State GDP YoY
- ▲ 2.60%
- F500 in state
- 92
Industry mix (Fortune 500 HQ in NY)
| Industry | F500 HQs | Revenue |
|---|---|---|
| Financial Services | 10 | $950B |
|
||
| Consumer Goods | 9 | $162B |
|
||
| Insurance | 4 | $225B |
|
||
| Telecommunications | 2 | $144B |
|
||
| Pharmaceuticals | 2 | $112B |
|
||
| Media / Entertainment | 2 | $69B |
|
||
Price history
2 events — show timeline
- 2026-05-20 Pending — UNYREIS
- 2026-05-18 Listed $59,000 UNYREIS
Property tax history
-0.8%/yrLatest (2025): $1,016 · +120.7% YoY. Source: county tax records.
Cash-flow waterfall
monthlySold comps — $/sqft
last 12 mo · ≤1 miLoading sold comps…